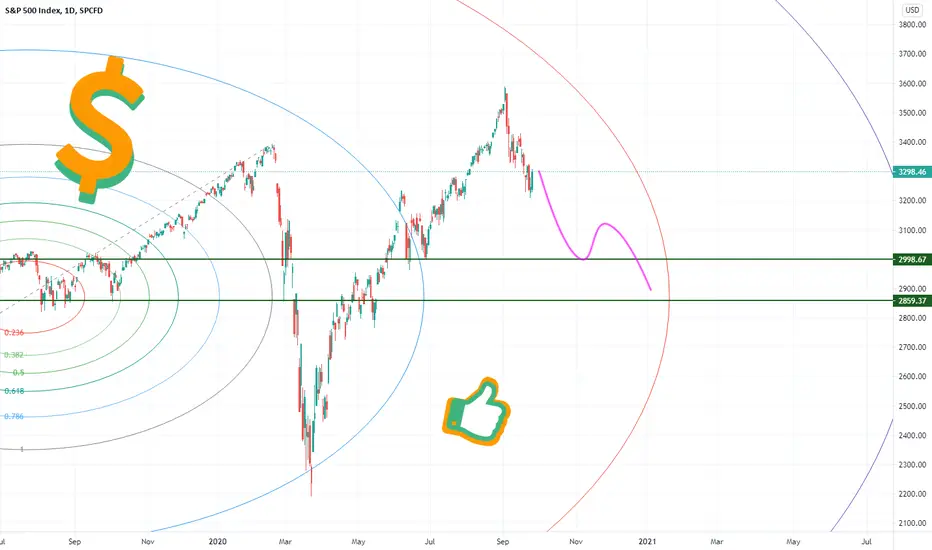
Time to finish this downtrend and start move for ATHsWith more data available, I am further homing in on the next reversal point and end of Intermediate wave 4. Due to prior projections and EW guideline violations, this forecast should finally find the end. It looks like Minor waves A and B are both completed. I am still projecting a gain early on Monday, but further downward movement during most of the week. All told I am expecting this week to move down at least 209 points from Friday’s close to the low point of this week. This would equate to a 6.31% drop, during the remainder of Minor wave C if it occurred. Minor wave A dropped 7.74% in 40 hours of trading at the beginning of September. This would see Minor wave C dropping 9.30% in roughly 40 trading hours.
The information below is slightly different from a similar forecast I provided earlier this month which at the time assessed Minor wave A to have lasted 40 trading hours, and waves B and C were estimations based on those 40 hours of movement.
What Minor wave A did:
It lasted 40 trading hours (6 trading days) and dropped 277.64 points. The rise over run (R/R) of this was a loss of approximately 6.941 points per hour. On average, A waves tend to make up 36% of the larger wave it resides in (Intermediate wave 4 in this instance). This means Intermediate wave 4 could last around 102 trading hours. At that time of this writing, Intermediate wave 4 is at least 75 hours long with additional time to go.
What Minor wave B did:
It lasted 22 trading hours (3 trading days) and gained 118.45 points. The rise over run of this was a gain was approximately 5.384 points per hour. On average, B waves tend to make up 21% of the larger wave they reside inside. This means Intermediate wave 4 could last around 102 trading hours. This conforms with wave A’s typical makeup of the larger wave as well.
MINOR WAVE C Estimations:
Length: Wave C should last around 40 hours. This is based on wave A making up about 39.22% of the larger wave and wave B providing 21.57% of the larger wave. This would leave wave C to make up the remaining 39.22%, which is also 40 hours. On average, waves A and C in the same wave are almost equal in length. This would also tie the maximum move that has occurred during specific Intermediate and Minor waves (Intermediate wave 4, Minor wave C) in the history of the S&P 500.
Movement: On average, the typical relationship of movement between A and C waves is 0.8632 which would equate to a drop around 3107. Wave B’s retracement of wave A’s movement is typically 0.37909 that of wave C’s extension of wave A’ s movement. This would equate to a drop around 3116.46.
The 5 wave down pattern estimations are based on Minor wave C moving 40 hours and down to roughly 318.92 from the end of Minor wave B. All estimates are based on the average of the average and median for each item.
Wave 1 typically lasts 27.85% of the larger wave it resides in. Wave 2 is around 10.80%, 3 is 36.45%, 4 is 6.33%, and 5 is 17.64%. Wave 1 typically moves 41.58% of the overall larger wave’s movement. Wave 2 is 19%, 3 is 56.5%, 4 is 22.22%, and 5 is 43.69%. This means wave 1 could last 11 hours and drop 132.61 points. Wave 2 could rise 60.59 points over 4 hours. Wave 3 could drop 180.19 points over 15 hours. Wave 4 could rise 70.86 points over 2 hours, and wave 5 could drop 139.34 points over 8 hours. This would have the ultimate bottom around 1230 on September 24 near 3108.24.
Before trading closed on Friday, wave 1 was likely completed. Even though the estimate was for wave 1 was a drop to 132.61 over 11 hours, it appears wave 1 found a bottom at 3292.40 (a drop of 136.52) over 13 hours which is 2 hours longer than forecasted. This could slide all of the following waves to the right by 2 hours. This could mean the market opens high or hits an early morning high around 3350, or wave 2 has already completed and the next 2 days will be down significantly.
Let’s get ready for another week of volatility. My guess is another down week. I still think we will see all-time highs in October before a nice 700+ point plunge beginning in November
Spx500short
This is how the week should play out.My initial projection from last weekend had Minor Wave B ending by the lunch hour on September 17. With more data, my projection has moved to the right a bit.
It looks like the Fed press conference ending Minute wave A and we are in the early stages of Minute wave B. Fortunately it should be short lived. I project this to end with a bottom around 3360 with about 3 hours left to trade on September 17.
Based on hitting that specific mark, I am projecting Minute wave C and ultimately Minor wave B to end around 3470 about one day later. I am still projecting the next down swing to begin before the week ends.
Another looser projection is the end of Minor wave B based solely on Minor wave A's movement. This has Minor wave B ending near the close of trade on September 17. I no longer assess this spot to be the end.
I will write again this weekend, but I am still bearish for the next two weeks before we are ready to test the ATH in mid to late October.
Follow and stay tuned for more!
DXY. P-Modeling Pt Z. Holographic Synchronicity of ChoiceWelcome Hyperspace Travelers.
Listen Carefully and Doubt everything I am about to say..
Watch. Closely. And see what is about to happen.
Bernie Sanders replaces Joe Biden and Defeats Donald Trump
Electoral Victory 84%.
Populous Victory 89%.
Landslide victory.
______________________
STOINKS
__________________
BULLRUN in DXY means DROP in Index-Equities = Global Re-set in Preperation for Roaring 20's.
BEARRUN in DXY means RISE in Index-Equities = Death to Middle Class America.
TRUMP will be re-elected if DXY goes into a BEARRUN. Because Stocks and Index will reach blistering new highs despite the clear separation between greed and commonwealth reality , indicating nothing is going to change in our crumbling world.
Bernie Sanders will be ELECTED IF.. DXY goes into a BULLRUN. Because Stocks and Index will reach blistering new lows, to price in the acute and longstanding crumbling infrastructure of our world.
DXY rising now sets the stage for a healthy long decade long BULLRUN on Index and Equities Assets.
DXY falling now sets the stage for an extremely unhealthy decade long BEARRUN on Index and Equtities after they peak under unsustainable greed, from the utter destruction of the middle class commonwealth.
SPX: 1450 LOW. by Mid November. Potential window in April - March. But sticking to Mid-November for now.
NAS 100: 4000 LOW. by Mid November. Potential window in April if Following DXY.
_________________________
FOREX
________________________
BULLRUN in DXY means shorting XXX.USD pairs.
BEARRUN in DXY means longing USD.XXX pairs.
Initiates a Trending Movement in this instance.
__________
CRYPTO
_______________
BULLRUN in DXY means BTC has a black swan death of -90%. TP $955.00 per BTC.USD
BEARRUN in DXY means BTC has Phoenix Rising of +90%. <---- Not happening until ^^ occurs. By 2023==> $150,000 per Bitcoin.
Stick to the story.
________________
OIL
_______________
is simply going to single digits again with a Rising DXY, OIL will fall in this case. FALLING DXY, oil will rise in this case.
TP $11.00 Stable.
***********************************************
-----TRADE SCENRIO---
Long OPGN.
Long UVXY
______________________________________________
Short AUD.USD 0.62
Short EUR.USD -
Long USD.CAD 1.50 -1.55
Long USD.CHF -
Short Bitcoin. TP: $955
Short Ethereum. TP: 12$
_________________________________
Then come the roaring 20s.
The start of the 4th industrial cybernetic revolution.
An age of prosperity and wealth for everyone.
A redistribution of power and opportunity for all and not just the few.
Happier times are coming...
Please try and be open minded...
The alternative is bad.
Very bad.
Thanks for Pondering the Unknown with Me,
Glitch420
SPX - Bearish PennantSPX is in a bearish Pennant. I'm expecting we break this by end of Thursday 9/17, if not tomorrow 9/15.
I'm hearing a lot of chatter that the correction is over..yada yada.
We are in a notoriously bad month for stocks, not to mention COVID 19 is ongoing, unemployment is still rampant, and most importantly we have a very important election coming up. Markets do not like uncertainty if Biden wins or Trump, it doesn't really matter the market needs concrete data to digest and reflect prices, until then I think we reached the top, fueled by retail traders, stimulus money, 0% interest rates, and of course the moon boys. I do not see a point to go long until after the presidency, I also have a feeling we will get a vaccine or treatment by then. Seems like the bubble already burst, would not be surprised to see SPX go below 3000 before the election. Not to mention the U.S marketcap to GDP ratio(Buffet indicator) is currently higher than it was during the dot com crash, something interesting to consider.
This is not financial advice, merely it is my reflection on what direction I believe the market is heading.
SPX heading down to 2000..On today's close, the uptrend that began in April is now over based on the intermediate term EMA cross. There are several factors which I would conclude are ripe for a major decline in the S&P 500 of which include:
- Upcoming election in the US
- Global economy mired in recession/depression
- Massive overvaluation
- Poor internals
- A few select stocks (FANG) leading the capitalization weightings
- Overall bearish seasonality
We will be taking short -5x ES contracts (-1x SP CME) on Sunday evening. Target is 2000 on the SPX with a slight possibility of a major reset down to 1550-1650 range if the panic is strong enough. VIX 100+ is possible during this timeframe. Buckle up and get ready. USD cash will be the strongest asset. All else (gold, bitcoin, commodities, etc.) are going to get hit BADLY...
SPX aka S&P500 doesnt look bullish at all 🚨😫🚨This chart shows it all. I will try to be summarize what I see. But what I see doesnt look good for the bulls.
If you can see that area with an arrow, you can see an almost bearish engulfing candle which is inherently bearish and considering the recent days bullish euphoria perhaps it is time for a correction before higher price actions.
The market has broken the uptrend line and hence we may form a consolidation zone and rip up to higher prices or we may coil down to the abyss.
The market is hanging on the 50MA line, will this magic line save the queen? Lets wait and see what the market does.
daily PSAR flipped to the bearish side but this is not terrible if we form a consolidation zone in the 3300 zone.
weekly PSAR is about to flip bearish. This is terrible most of the time it is followed by massive sell offs.
To me bears have come back with all their arsenal it is time to tighten stop losses. I will keep you updated for all the new moves this market is going to play.
Stay tuned and stay safe. Dont forget to smash the likes.
XTF.
SPX500 short/ approaching potential re-entrySPX has been looking solid for a short off the 1 hr/4 hr. The trend began within a channel, but there has officially been a breakthrough. It experienced some resistance around the 3380 price reversal zone. Should it break through and reach all the way to the 3438 area, there may be a complete reversal or a strong resistance @least.
I've been trading for almost 3 months now. This is my first mark-up. Feedback would be much appreciated. LMK what you think.
One week left for bears before moonshotEven though the downturn started a few days later than planned, it still met the expected drop. Wave A could have occurred until the end of trading on Friday, but it may have ended Friday morning at 1030.
The red down arrows and one green up arrow are based on Intermediate Wave 3 lasting 46 days and with its move extending beyond Intermediate Wave 1's movement by 134.09%. These arrows are a rough projection of movement. There length may not line up perfectly but points moved are typically much more accurate.
There are two possible tracks for the week.
Option 1:
Wave A may be in the early stages and have only completed wave 2 of wave A. This would drive the index down drastically at some point this week, before a bounce up and then more downward movement possibly with a bottom next week. A significant upward wave B would need to occur before the end of next week and then another week or too of significant drops until wave C finds its bottom. THIS COURSE IS UNLIKELY. I assess the next one to be most likely.
Option 2:
Wave A did in fact complete itself at 1030 Friday. This would mean it lasted roughly 18 30-minute bars instead of the projected 29. The projected top to bottom movement of Wave A was 246.25 versus the actual of 238.48.
Wave B's projected move was 145.44 over 20 30-minute bars. With wave B's likely end, it only lasted 9 bars and climbed 105.51. Based on my analysis, B waves typically last around 75% the length of their wave As. This B wave would be half of that, which is not abnormal, but could mean wave B moves a little higher over the first 2 hours of trading on Tuesday.
Wave C was initially projected to drop 223.11 over 33 bars. Wave C can still do this, especially if wave B moves up toward 3487 early on Tuesday.
If wave B does not find a new top by 1130 Tuesday, wave C could be in full force. With wave B starting early by 22 30-minute bars, wave C could end early by 22 bars or more. The earliest end for wave C is 1030 Thursday.
If wave B continues for a few more bars, wave C should find a solid bottom before 1430 Friday. It might be a little odd to sell during the course of a week, albeit it a shortened week, just to come off the bottom for the final 90 minutes of the week. A more likely action would be wave C's bottom earlier in the day Friday or the following Monday.
Long-term projection is still on track for a rise to new all-time highs before mid-October, followed by 700-800 point decline through Mach 2021, and a massive rise to new all-time highs again before finally crashing in early 2022.
We will see what happens. Keep checking back as we track this wild ride to the end in early 2022.
Possibly 5 waves completed - Target 1500 SPXI think this is a good spot to look for long-term shorts, It looks to me like it's 5 waves completed. Price is going up to test supply, we have bearish divergence. Vix has climbed back up onto a nice long-term uptrend with a bullish hammer. I think price can get higher in the supply zone but this is a good r/r short, and this will be cancelled if price closes above supply but I don't think it will.
Agressive 13 sell on the daily at major supply and trendline, I also think we're headed below the previous low, not sure what the catalyst will be but I think somethings coming unfortunately.
Target - 1500 SPX