SPx500 testing initial supportThe index price failed in yesterday’s trading to resume the upward attack, affected by the exit of the Stochastic indicator from the overbought level, forcing it to form a bearish corrective bounce,
We currently and continually expect the price to be exposed to negative pressures, forming an additional corrective decline to incur additional losses by being attracted towards 4328 and then trying to test the main support extending towards 4298 . As for its renewal of the upward push, this requires presenting a positive close above the 4383 level, to facilitate the task of achieving new gains that may extend towards 4402 and 4423 respectively.
Pivot Price: 4383
Resistance Price: 4402 & 4423 & 4464
support price: 4328 & 4298 & 4268
The expected general trend for today: corrective bearish
timeframe: 4H
Spx500short

SPx500 moving slowlyIn yesterday's trading, the index price touched the level of 4402 and then repeated the sideways fluctuation near 4362, affected by the attempt to exit the Stochastic indicator from the overbought level, while the general stability is above the support level extending towards 4383 and the attempt to form the moving average 55 for additional support by settling at 4423, this calls us to adhere to the bullish bias. Which may soon target 4423 and 4464, respectively.
Pivot Price: 4383
Resistance Price: 4402 & 4423 & 4464
support price: 4353 & 4328 & 4298
The general trend expected for today is bullish
timeframe: 4H

SPx500 remains positiveThe index price offered some recent positive trading yesterday , trying to confirm continued positive with repeated stability above support
The above calls us to wait for the price to gather additional positive momentum to facilitate the task of surpassing the 4383 level and reaching the next key target positioned at 4402.
Pivot Price: 4383
Resistance Price: 4402 & 4423 & 4464
support price: 4353 & 4328 & 4298
The general trend expected for today: bullish
timeframe: 4H

S&P / ES Setting up for shorts tomorrow and next week.S&P / ES are in an abnormal distribution right now; up 5% in a week even including priced in prior to Fed Interest rate, looks like a convenient short hunting continuation path at this point. Idea is, it should present a short set up pretty soon after the NFP and into next week, levels are stated in the chart, good luck.

SPX500 ShortThe SPX is showing 4 variables that suggest the price will drop.
In our trading strategy, when an asset that is showing 4 variables in the same direction, we take the trade. As always the SL is one that as of right now makes sense, we will update if something changes.
The 4 edges (Variables) that suggest downside:
1. Confirmation of old channel as resistance.
2. Confirmation of 2021 high as resistance after price failed to return above it.
3. Bearish divergence on the MacD.
4. A bearish dark cloud cover/ piercing line candlestick formation (Confirmed with a negative close today).
Not to mention the asset retraced 61.8% to its recent high from low putting it in the golden zone.
We can never say an asset WILL go in a specific direction. We just look for scenarios where, based on researched methods, an asset has a higher probability of going in a direction. When multiple edges line up, we take the trade. This is one of those cases.

SPX Break & RetestSPX is now at a key level of prior resistance. Will it be as simple as prior resistance turns into support for SPX?
This is definitely an area to watch.

SPX500 4H still bearishHello traders,The price currently needs new negative momentum to enable it to resume the negative attack to soon target the 4183 level, and then let us wait for it to attack the 50% Fibonacci retracement level positioned near 4138.
Pivot Price: 4215
Resistance prices: 4265 & 4302 & 4346
Support prices: 4183 & 4138 & 4098
The expected general trend for today: bearish with the stability of the barrier

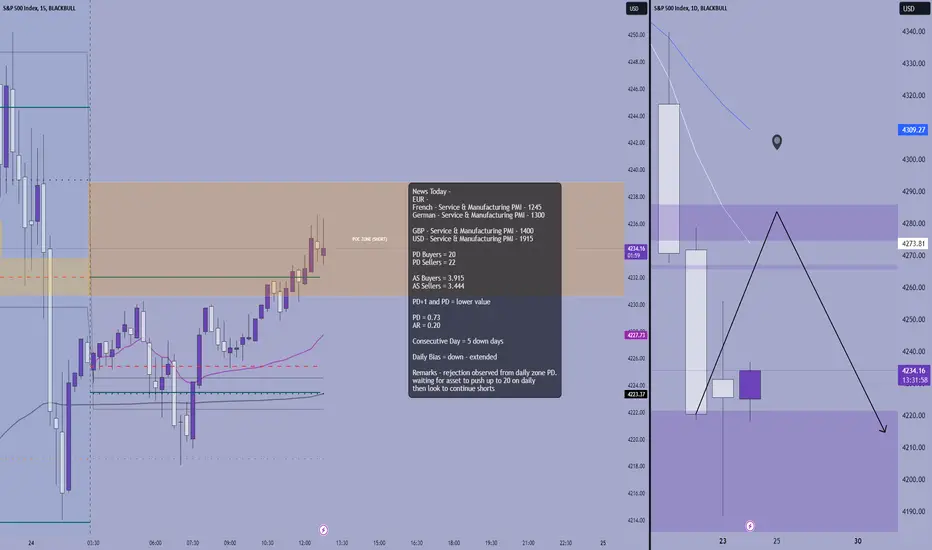
SPX ShortYesterday we observed a good rejection off of daily zone from SPX. now we wait for it to pull back to the daily zones coinciding with 8 EMA and the time base low AVWAP (red) and reject it.
inside value day today, so if it breaks PD VAH, there can be long opportunities but not interested in that today..
rest of the technical details are in the chart.
Key Technical Indicators Signal Downside Potential for S&P 500The market has recently exhibited a series of bearish indications, suggesting potential further downside for the SPX:
Price Action: The market gapped down after September 20th and hasn't recovered those levels.
Short-Term Moving Averages: The 50-day moving average recently crossed below the 21-day, indicating a potential short-term downtrend. Moreover, the price struggled to move back above the 50-day level.
Diverging Moving Averages: While the 21 and 50-day averages tilt downward, the longer 150 and 200-day averages remain bullish, suggesting a potential trend shift.
Critical Level Breach: The SPX closed below its 200-day SMA, a traditionally bearish signal.
Key Bearish Indicators:
TRIN: Indicates more volume with declining stocks.
TICK: Levels between -1000 to -1300 signal a bearish sentiment, hinting at institutional selling.
VIX: A 66% rise in the past week reflects increasing market uncertainty.
Prediction: Given these indicators, it seems probable that the SPX might not rebound off its 200-day SMA in the short term. There's potential for it to breach significant support levels, including S2 and the 1 Year anchored VWAP.

SPx500 It needs new positive momentum SPx500
if it falls above 4310 in this direction will rise to 4337 then 4361 then 4383
but if it is below 4310 the direction will go down 4278 , 4253 then 4227
Pivot Price: 4310
Resistance prices: 4337 & 4361 & 4383
Support prices: 4278 & 4253 & 4227
timeframe:4

SP500 ES - BEARISH BIAS NEXT WEEK! BEARS GONNA EAT
📉Bearish Bias Next Week 📉
🔴Weekly IRL Tagged
🔴Strong H4 Bearish PA after Weekly IRL Tag
🔴Looking to short towards Weekly ERL
🎯Target: 4235.5

SPX is in an uptrend now Let's be honest. SPX is in an uptrend now. The price has been creating higher lows and higher highs. The downsloping trendline which was acting as a strong resistance in March 2023 was retested and confirmed as a support. Since then the price has been in the uptrend and in our opinion we are at the early stage of the new BULL MARKET.
Yes, you hear it right: BULL market.
The price remains above the ichimoku cloud and it looks like it's breaking the horizontal resistance.
It will take time for a price to recover but let's be clear here: we don't expect new lows on SPX. There will be more corrections and pullbacks but overall 4800 -5000 is a target which in our opinion we may see in 2024/2025
What do you think?
Do you agree? Leave your comment :)

SPx500 4H The S&P is awaiting negative momentum SPx500
if it falls above 4265 in this direction will rise to 4288 then 4312 then 4334
but if it is below 4265 the direction will go down 4219 , 4197 then 4177
Pivot Price: 4265
Resistance prices: 4288 & 4312 & 4334
Support prices: 4219 & 4197 & 4177
The expected trading range for today is between 4219 and 4288
timeframe:4

SPx500 4H Still bearishSPx500
if it falls above 4265 in this direction will rise to 4288 then 4312 then 4334
but if it is below 4265 the direction will go down 4219 , 4197 then 4177
Pivot Price: 4265
Resistance prices: 4288 & 4312 & 4334
Support prices: 4219 & 4197 & 4177
The expected trading range for today is between 4219 and 4288
timeframe:4

SPX 500 - 04/10/23SPX 500
Lower highs now for the last two months and higher lows still bearish here till break the highs at the $4333 area, the target is the next low on the left at $4100

S&P 500 Analysis. Day trade Signal!!!Hello Everyone. I want share my idea about S&P 500 which will be signal for next week.
After Some pretty bearish momentum we got rejection from daily support. i think S&P will continue fall and i will try to catch that moment, for that i identify liquidity swings which gave me perfect entry area after used my Fibonacci levels, Fibonacci 78.60LVL and daily resistance is same place, trend what i see is still bearish, for that i decide to short it from That zone.
Here is my setup for my trading signal.
Open Short Position - 4332.1
Stop loss - 4358.00
Take Profit - First target at 4238.3 if it will reach then i will trail my stop loss at the Level.
Always Manage your own risk and make your own research!!!

SPX\S&P500 - H4\D1SPX\S&P500
W1 – the third wave pattern has formed. The previous week closed with the level consolidating and the 1st wave breaking through (4334.4) – global targets 4045 – 3800.
What can you expect?
You can consider an entry from breaking through the level of 4277 to continue the movement down to the levels of 4092. Having canceled the movement, the price will return to the level of 4340.
Targets 4185 - 4150 - 4092

SPx500 4H (Pivot Price: 4271)SPx500
if it falls above 4309 in this direction will rise to 4334 then 4353 then 4375
but if it is below 4309 the direction will go down 4279 ,4259 then 4240
Pivot Price: 4271
Resistance prices: 4334 & 4353 & 4375
Support prices: 4279 & 4259 & 4240
timeframe:4H

$SPDN Quarter 3 (Q3) AnalysisI believe that SPDN will form a new all-time low in Q4 with a drop below $13.90. For those who are bearish on the S&P, I drew the key price targets on the way up for those who are long SPDN. For now the EMA ribbon is acting as an area of resistance and a red resistance line that intersects with the yellow resistance zone. These are short-term resistance levels to monitor.

SPx500 4H (Pivot Price: 4271)SPx500
if it falls above 4271 in this direction will rise to 4290 then 4309 then 4334
but if it is below 4271 the direction will go down 4254 ,4232 then 4213
Pivot Price: 4271
Resistance prices: 4290 & 4309 & 4334
Support prices: 4254 & 4232 & 4213
timeframe:4H

SPx500 4H (Pivot Price: 4316)SPx500
if it falls above 4316 in this direction will rise to 4334 then 4353 then 4394
but if it is below 4316 the direction will go down 4304 then 4286 then 4254
Pivot Price: 4316
Resistance prices: 4334 & 4353 & 4394
Support prices: 4304 & 4286 & 4254
timeframe:4H

SPX Market Crash (upcoming) - 35% why?Hi Everyone,
A summary of the last 5 recessions since 1981... These recessions triggered declines of at least 20%. The Great Recession from December 2007 to June 2009 was the one that most affected the market with a decrease of about 57%. Regarding macroeconomics, the Americans are currently implementing a monetary tightening policies and have announced a final interest rate hike before the end of the year, so in my opinion, a recession is now inevitable.
The SPX is currently forming a tweezer top on the 3-month timeframe... In my opinion, a 35% decline is possible to test the M Neckline (entry gate).

SP500 Correction LevelThe SP500 index continues to rise as long as it remains above the 20-week moving average, but this may be coming to an end. Weekly closes below $4436 will create a negative outlook. A correction could push the index down to the 100-week moving average of $4160. But as long as the index remains above $4436, the rise will continue.
