SPx500 4H (Pivot Price: 4493)SPx500
stabilizing above 4493 will support rising to touch 4542 then 4561 then 4579
stabilizing under 4493 will support falling to touch 4503 and then 4483
Pivot Price: 4493
Resistance prices: 4542 & 4561& 4579
Support prices: 4503 & 4483 & 4465
timeframe: 4H
Spx500short

S&P 500 ForecastS&P 500 moved towards the 3980 level as traders prepared for tomorrow’s CPI data meanwhile, the tech heavy NASDAQ Composite was up by 0.4%.
Today’s rebound is led by energy stocks. WTI oil managed to get above the $73 level as traders focused on the Keystone pipeline outage.
From a big picture point of view, S&P 500 continues to consolidate in the range between the support at 3915 and the resistance at 3975. RSI is in the moderate territory, so there is plenty of room to gain additional momentum after the CPI data and the Fed decision. If the CPI report shows that inflation is slowing down, the current consolidation will serve as a good base for an upside move. However, it should be noted that traders may remain somewhat cautious ahead of the Fed decision.A move below the 50 EMA, which is located near the 3915 level, may be interpreted as a sign of an upcoming sell-off. S&P 500 received strong support near this level, so traders may rush out of their long positions if this support level is broken
we still in down trend and we should break the yellow line and back 4100 level
The Fed is still playing catch up to tame rising prices after its protracted gross mischaracterisation last year of inflation as ‘transitory’ and its initially timid steps to withdraw monetary stimulus,
The world’s most powerful central bank is now confronted with two unpleasant choices next year, crush growth and jobs to get to its 2% target or publicly validate a higher inflation target and risk a new round of destabilized inflationary expectations. I think Rather than fall to 2-3% by the end of next year, U.S. core PCE inflation will probably prove rather sticky at around 4% or above.

Time For The Long Await Selloff?IF Intermediate wave 2 finally ended, this will serve as the current preliminary analysis for tracking Intermediate wave 3 down. Confirmation of Intermediate wave 2 ending will take at least 3 more days, so this analysis is subject to change. Based on the most specific historical models that are relationally relevant to an Intermediate wave 3, the quartile movement extensions serving as checkpoints and likely bottom (pink levels on chart) for Intermediate wave 3 are 165.83%, 181.41%, and 227.27%. The models cannot agree on a specific duration in hours, however, there are pockets of agreement with the strongest at 168-175 hours, secondary is 185-192, third is 149-156 hours. The next set of data is slightly broader and places the quartile movement extensions (light blue levels) at 147.09%, 165.83%, and 306.68%. Strongest model agreement for duration is at 70 hours (which was the length of Intermediate wave 2), secondary is 112 (length of Intermediate wave 1) and 426 hours while third model agreement is at 155, 174, and 199 hours. The broader set of historical data has extension quartiles (yellow levels) at 141.46%, 176.435%, and the third quartile remains at 306.68%. Strongest model agreement for duration is 70 and 426 hours (which are unlikely for wave 3) with secondaries at 112, 142, and 224 (double length of wave 1). Third most agreement is at 168, 174, and 213 hours.
Preliminary forecast is the bottom around 174 hours which is around October 6th. The bottom could be between 4114-4156, but likely below 4140. The levels in this assessment will not change but the forecasts for the bottom will be updated in future forecasts as each of the 5 waves near completion. Intermediate wave 4 should begin more upward movement after Intermediate wave 3 has completed. September looks like a selloff, but October should claw back 20-50% of the losses.

SXP500 Index 30/08 MovePair : SPX500 Index
Description :
Bullish Channel in Long Time Frame and Rejecting from the Upper Trend Line Completing its " 3rd " Impulsive Wave. We have Break of Structure and Making its Retracement in Corrective Waves " ABC " . Possible Rejection from Fibonacci Level 61.80% or Previous Resistance

S&P500 downWill SPX be sacrificed?
will investors & the US government take the dollar out of the S&P 4 BTC ?
will this liquidity flow into Bitcoin?
i think so

SPX Further Downside Incoming (1D)SPX Daily
Price Chart
After the recent bounce of the level of resistance (Red Box) the SPX snapped it's first small level of resistance (Teal Dotted) and has continued lower. Price has also closed below the 50-day EMA while the 12-day and 26-day have recently crossed and the 50-day flattens out. The next level of support (First Green Box) should come into play within the next several days, unless we get a big sell-off Friday and hit it today, but this is the first area we expect to see a bounce. Also notable is the minor trend line (Yellow Dotted) that has been broken which should lead price action to eventually come in contact with it's major trend line (Yellow Solid) again.
Relative Strength
Not a lot to show here, however there have been two significant moves. First is the rejection of the 50 level (Aqua Circle) and the second is the break below (Aqua Highlighter) the major trend line (Yellow Solid). Both of these moves fortify the recent price action and indicate further weakness in trend.
On Balance Volume
OBV broke out of it's downward trend back in May (Yellow Solid) and started trading in an upward channel after. There hasn't been a reversal formation, but there is a small breakout forming (Aqua Highlighter) that coincides with recent price action and RSI movement. More evidence of an upcoming bounce is seen as a level of resistance is also being approached (Red Solid)
TLDR;
Dang man, talkin' bout no time man, dang ol' markets bleedin' man, come on up or dang ol' down man. Uh.. yea.. We think we understood that. Anyway.. Price action is on it's way down to a small level of resistance where we could see a bounce. RSI has bounced down off the 50 level and has broken down from it's main trend line; signaling a move lower. OBV has just begun to move down out of it's upward channel and also faces a level of resistance that could lead to bounce.
What Seems Legit?
A bit more of lower movement to hit the levels of resistance outlined above, then further downside
Chart Key
Yellow Solid = Major Trend Line
Yellow Dashed = Minor Trend Line
Red Solid = Major Support or Resistance
Red Box = Resistance
Green Boxes = Supports / Target Areas
Teal Dotted = Small Level of Resistance
Aqua Highlighter = RSI / OBV Breakouts

Where to from here on SPXI posted this chart few weeks ago as a follow up to my short to show the few paths SPX is going to take after it begins the descent and SPX has followed the one where I explained about a break of the channel into the deviation below. please refer links below the description to look at my previous posts on SPX short idea.
The only difference is that this happened a bit slower than I anticipated, which makes this drop out of the channel less likely to be a deviation now.
As you can see, we are bouncing from the Support zone as I had highlighted in my previous post.
Which brings us to the question of where we go from here.
On The Daily TF we have first hints of a reversal or a decent size bounce from here, we have bounced from a key support and ended the day with right candle stick on the daily, but we need one more day of price action to confirm the reversal. If we get another green day without breaching the low, we are likely to head up.
But if we zoom in to 4h TF things become clearer.
Let's Look at the following chart:
On Friday we broke structure to the upside on 4h and created a strong low at 4336. That number is not random , Will cover this in the next chart.
If we get a pull back and break higher than Fridays high, we will get a full Change of trend on 4h TF. Once we do, we should be able to break all the 4h strong highs until we meet the Daily Strong high at 4502 which is what I think will be hard to break and we will get a strong rejection from there. From there we can do one of the two things, either come back down create a double bottom and try again to break the daily high at 4500 and continue higher. If not, we will continue the daily trend by breaking 4336 low and head lower.
Now let's look at why the price bounced from 4336. The following chart has the answer. If you know VPA, then you know price moves in ranges, just like candle stick patterns are fractals, Ranges can act like fractals as well. In the chart you can see There are 3 ranges R1, R2 and R3 that formed on this uptrend. R3 is the larger range that encompasses R1 and R2 and 4336 is the VAL of this bigger range and as Per VPA theory , price in a range keeps roughly bouncing between VAH and VAL of the ranges .If you look at the VAH of R3 it coincides precisely with the Daily strong high at 4500 which gives us another confluence for a rejection there into the Daily OB shown in previous chart.
Finally, if throw regular old fibs and Gann Fan into the mix we get additional confluence for a rejection at the 4475-4500 region as shown in the chart below. 4475 region is a Gann resistance and 4475-4500 0.5 to 0.618 region of the retracement.
Some Projections:
If we do get a move like the one, I have explained, i.e. move to 4500 area and reject, we will have few patterns emerge like inverse H & S and cup and handle. I have highlighted the targets if they mature. But always remember all these patterns are pure manipulation by large institutions to trap retail traders, it possible that there is a fake out into the pattern where pa comes to lower 4300s and then reverses from there can creating yet another pattern a Double bottom, so only trade confirmations based on market structure change.
Happy Trading App!!!

Where to from here on SPXI posted this chart few weeks ago as a follwup to my short to show few possible paths SPX is going to take after it begins the descent and SPX has followed the one where I explained about a possible break of the channel into the deviation below. please refer links below the description to look at my previous posts on SPX short idea.
The only difference is that , this happened bit slowly than I anticipated , which makes this drop out of the channel less likely to be a deviation now.
As you can see we are bouncing from the Suupport zone as I had highlighed in my previous post.
Which brings us to the question where to from here.
On The Daily TF we have first hints of a reversal or a decent size bounce from here , We have bounced from a key support and ended the day with right candle stick on the daily, but we need one more day of price action to confirm the reversal. If we get another green day without breachnig the low we are likely to head up.
But If we zoom in to 4h TF things become clearer.
Lets Look at the follwing chart:
On Friday we broke structure to the upside on 4h and created a strong low at 4336. That number is not random , Will cover this in the next chart.
If we get a pull back and break higher than fridays high we will get a full Change of trend on 4h TF. Once we do we should be able to break all the 4h strong highs until we meet the Daily Strong high at 4502 which is what I think will be hard to break and we will get a strong rejection from there. From there we can do one of the two things , either come back down create a double bottom and try again to break the daily high at 4500 and continue higher. If not we will continue the daily trend by breaking 4336 low and head lower.
Now lets look at why price bounced from 4336. Following chart has the answer. If you know VPA , then you know price moves in ranges , just like candle stick patterns are fractles , Ranges can act like fractles as well. In the chart you can see There are 3 ranges R1 , R2 and R3 that formed on this uptrend. R3 is the larger range that encompasses R1 and R2 and 4336 is the VAL of this bigger range and as Per VPA theory , price in a range keeps roughly bouncing between VAH and VAL of the ranges .If you look at the VAH of R3 it concides precisely with the Daily strong high at 4500 which gives us another conflunece for a rejection there into the Daily OB shown in previous chart.
Finaly if throw regular old fibs and Gann Fan into the mix we get additional confluence for a rejection at the 4475-4500 region as shown in the chart below. 4475 rehion is a gann resistance and 4475-4500 0.5 to 0.618 region of the retracement.
Speculation:
If we do get a move like the one I have explained , i.e move to 4500 area and reject , we will have few pattern emerge like inverse H & S and cup and handle . I have highlighted the targets if they mature. But always remember all these patterns are pure manipulation to trap retails , it totally possible that there is a fakeout into the pattern where pa comes to lower 4300s and then reverses from there can creating yet another pattern a Double bottom so be careful , only trade confirmations based on market structure change.
Happy Trading All !!!

$SPX - Short Term Bearish to $4440 I share this idea on the date of 12th August 2023 (A Weekend)
Level: Experienced Options Trader
SP:SPX - Bearish until $4440
Existing Delta Prints: Buying @ $4440 - $477.961m Delta
Below $4400 the Delta is low & Bearish with low volume.
Stochastic RSI on 30min showing short term decline.
Trade Idea: Long at $4400 with tight SL. Below this and SPX has 400 points to move down.

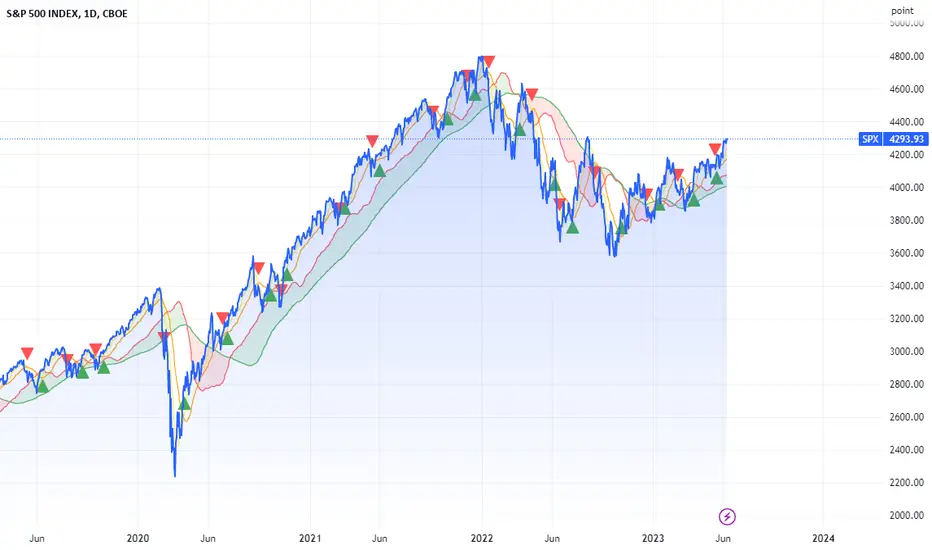
Much More Dangerous than The Dotcom Bubble According to the World Famous trader W.D. Gann, the ideal advancing angle in an uptrend is 45 Degrees. In other words, 45 Deg. is a perfect balance between supply and demand. However, even in the Dotcom Bubble, the trend angle was less steep than the current trend. This indicates a much more downward potential than the 2000s burst. Stay Safe!

SPX500 Broke The Support!SPX500 was going down
And the indice broke the
Support level of 4527.00
Which is now a resistance
And I think the price
Will go further down !

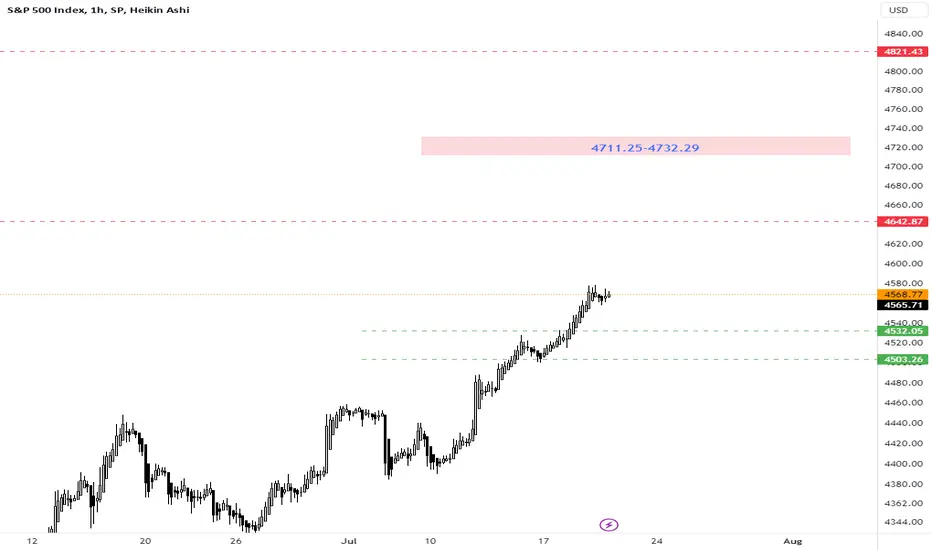
SPx500 4H SPx
stabilizing above 4561 will support rising to touch 4565 then 4569 then 4576
stabilizing under 4561 will support falling to touch 4552 and then 4547
Pivot Price: 4561
Resistance prices: 4565 & 4569 & 4576
Support prices: 4552& 4547& 4537
timeframe: 4H

spxTwo red lines can be considered as a resistance range. If there is a correction, it should be checked again.
SPX shortthe two major points are marked for short as yellow lines for SPX big reversal , i expect a major pullback from all of this area for SPX here

SPx500 4H (bearish)SPx
stabilizing above 4389 will support rising to touch 4419 then 4448 then 4475
stabilizing under 4389 will support falling to touch 4346 then 4319
Pivot Price: 4389
Resistance prices: 4419 & 4448 & 4475
Support prices: 4346 & 4319 & 4289
tendency: is bearish
timeframe: 4H and 1H

SPx500 4H SPx
if it is the next 4 hours stabilizing above 4389 will support rising to touch 4419 then 4448 then 4475
stabilizing under 4389 will support falling to touch 4346 then 4319
Pivot Price: 4389
Resistance prices: 4419 & 4448 & 4475
Support prices: 4346 & 4319 & 4289
timeframe: 4H and 1H

NQ big resistance. Reversal. FED. Market Euphoria.Started building a swing position with puts and margin. Will be actively managing it. Looking for approx 20% drop from here.
Markets euphoric, greed, AI mania.
FED clearly signaling more hikes.
Markets digesting news on a big resistance level. Trend reversal imminent.
Will look to scale out on a few daily consecutive closes above red box.
Enjoy.

SPX500 Next Possible movePair : SPX500 Index
Description :
Rising Wedge as an Correction in Long Time Frame
Consolidation Phase
S / R Level
Bullish Channel
Break of Structure
RSI - Divergence

SPX Short idea If SPX sweeps highs on a monthly perspective, could confirm indices shorting. Targeting Weekly Imbalance

Is there stock market drop based on around SPX possible? As we have all seen, the stock market has been on a steady rise for some time now, but I fear that we may be on the brink of a significant drop.
There are several reasons for my concern. While governments and central banks have taken measures to mitigate the effects of this past pandemic disruption, the long-term impact on the economy is still uncertain.
Secondly, we are seeing signs of overvaluation in many sectors of the market. Companies that are not yet profitable are seeing their stock prices soar, and the valuations of some of the largest tech companies are reaching levels that are difficult to justify.
Finally, we are seeing a significant increase in market volatility, with large swings in both directions becoming more common. This volatility is a clear sign that investors are becoming increasingly uncertain about the future of the market.
Given these factors, I believe it is important for traders to be wary of the current stock market rally. While it is always difficult to predict the future, I believe that the risks of a significant market drop are high.
As such, I encourage you to be cautious in your trading decisions and to consider taking steps to protect your investments. This could include diversifying your portfolio, investing in defensive sectors, or even reducing your exposure to the market altogether.
In conclusion, I urge you to take these warnings seriously and to be prepared for the possibility of a significant market drop. While I hope my concerns are unfounded, I believe it is better to be safe than sorry.
QQQ: Imminent Tech Smack Down!Tech has been on a tare, proceeded by a rip. QQQ has gone up further than I anticipated but the market is finally showing
serious signs of exhaustion. The outrageous valuations and proclamations of a new bull market are sure fire signs of the'
end of the road. It has touched the .618 fib level and depending on how you are looking at it, even surpassed it by a bit.
Looks awfully similar to the dot com bubble. The Nasdaq fell by almost 50% before retracing over 60%, arriving slightly
above the .618 fib and then resumed its downtrend, falling another 80% from its retracement high. The market also rings
of the 1973 bear market where only a few stocks were carrying the entire market before a significant downtrend and they
never quite recovered in the same way. History points to several scenarios that all shine a light on the unusual market
behaviour and what we might expect moving forward. Many are calling for a new bull market and saying that "this time
is different." That is one phrase that you want to avoid at all costs when referencing the stock market because it always
finds a way of delivering the same results, sometimes taking more time to play out or allowing those that refuse to accept
the reality of what is to come to gloat in a the,mporay victory over those more observant and subsequently cautious investors.
I think that it will not be much longer before we see a profound shift in the market and all of the indications of economic illness
are validated by price action.

Stock Market Death Cross, Impending Earnings RecessionRSP was trading below the 200 day moving average in the after hours. I wonder if it is going to open that way tomorrow. Also the 63 day moving average, which represents the quarterly moving average has fallen below the 200 day moving average as well. Not too often does this happen and more downside doesn't follow in the weeks to come.
From a pivot point perspective the total market is also trading below the pivot entering the month of June signaling that although mega caps have rallied in a major way, the average analyst consensus is a bearish stance. I say that as we've recently seen recent reports that further margin contraction is under way and an earnings recession later in the year is coming.
Check out the Equity Channel Podcast on Apple, Amazon and Spotify to learn more about stock trading and investing.

ES/SPX500 Drop offLooking for a drop off to occur in the market soon.
Seasonality wise speaking June tends to be negative. Thus, I would like to see a drop in the next couple of weeks.
There is the August high which looks tempting as a DOL and there is a FVG left back in April 2022. I will watch price when we engage in both of those levels and will see how price reacts, if correct price action is seen for the bears to take over, I will short.
The targets are also outlined, and once reached, will re-evaluate the scenario to see if we get further downside.
