S&P 500 Hit Record High Ahead of Holiday BreakS&P 500 Hit Record High Ahead of Holiday Break
Today, financial markets in the United States are closed in observance of Independence Day. Investor sentiment was likely buoyed by the latest rally in the S&P 500 index (US SPX 500 mini on FXOpen), which set a new all-time high yesterday, surpassing 6,280.
The bullish momentum has been driven by robust labour market data in the US. According to ForexFactory, analysts had anticipated a rise in the unemployment rate from 4.2% to 4.3%, but instead, it unexpectedly declined to 4.1%.
Can the stock market continue to climb?
Technical Analysis of the S&P 500 Chart
Analysing the 4-hour chart of the S&P 500 index (US SPX 500 mini on FXOpen)on 30 June, we observed the following:
→ An ascending channel was formed (indicated in blue);
→ A developing bullish impulse (marked with an orange line) suggested the price would move towards the upper boundary of the channel – a scenario that materialised with yesterday’s rally (as shown by arrow 1).
However, from a price action perspective, the recent downward move (arrow 2) has now gained significance. It may indicate that sellers are becoming more active around the identified resistance level.
Should the price decline towards the lower orange line, this could negate the current bullish impulse altogether, effectively reflecting a classic bearish engulfing pattern.
Given the above, there is reason to believe that bears are attempting to regain control after the S&P 500 (US SPX 500 mini on FXOpen) surged over 5% in the past 10 days. As such, a potential breakout below the orange line cannot be ruled out, with price action possibly targeting the median of the blue ascending channel.
What happens next?
The market’s trajectory will largely hinge on developments related to tariffs. Trade policy will remain in the spotlight next week, as key deadlines set by the White House approach — events that traders will be closely monitoring.
This article represents the opinion of the Companies operating under the FXOpen brand only. It is not to be construed as an offer, solicitation, or recommendation with respect to products and services provided by the Companies operating under the FXOpen brand, nor is it to be considered financial advice.
Spx500trade

How Financial Markets Are Reacting to Middle East EscalationHow Financial Markets Are Reacting to the Escalation in the Middle East
The exchange of strikes between Iran and Israel continues. However, judging by the behaviour of various assets, market participants do not appear to expect further escalation:
→ Oil prices are falling. Monday’s candlestick on the XBR/USD chart closed significantly below the opening level.
→ Safe-haven assets are also retreating: the Swiss franc weakened during Monday’s U.S. session, while a bearish candle formed on the daily XAU/USD chart.
Equity markets, too, have largely held their ground.
The S&P 500 index (US SPX 500 mini on FXOpen) climbed on Monday (A→B) following reports of potential talks between Iran and the U.S. However, it pulled back (B→C) after the U.S. President urged citizens to evacuate Tehran.
Technical Analysis of the S&P 500 Chart
News of Israeli strikes on targets inside Iran led to a bearish breakout from the rising channel (marked with a red arrow), though the downward move failed to gain traction.
At present, the S&P 500 chart (US SPX 500 mini on FXOpen) shows the formation of an ascending triangle — a signal of temporary balance between supply and demand.
Still, given the elevated geopolitical uncertainty, this balance remains fragile. It could be disrupted by:
→ Further developments in the Iran–Israel conflict (notably, Donald Trump left the G7 summit early due to the situation in the Middle East);
→ U.S. retail sales data , due today at 15:30 GMT+3.
It is possible that the S&P 500 may soon attempt to break out of the triangle , potentially triggering a new directional trend.
This article represents the opinion of the Companies operating under the FXOpen brand only. It is not to be construed as an offer, solicitation, or recommendation with respect to products and services provided by the Companies operating under the FXOpen brand, nor is it to be considered financial advice.

S&P 500 Breaks UptrendS&P 500 Breaks Uptrend
Only yesterday we questioned the sustainability of the stock market’s upward trend amid alarming news from the Middle East and the evacuation of the US embassy in Iraq — and today, the S&P 500 chart (US SPX 500 mini on FXOpen) shows a break below the lower boundary of the ascending trend channel.
According to media reports:
→ Steve Witkoff, US President Donald Trump’s special envoy to the Middle East, was expected to meet Iran’s Foreign Minister in Oman on Sunday.
→ Friday the 13th became the date when Israel launched strikes on Iran’s nuclear facilities, dramatically altering the outlook for a potential US-Iran nuclear agreement.
→ Secretary of State Marco Rubio stated that the US was not involved in the operation, while Israel’s state broadcaster reported that Washington had been informed ahead of the strikes.
Technical Analysis of the S&P 500 Chart
Yesterday morning, we noted that the Q-line, which divides the lower half of the channel into two quarters, had shifted from acting as support to becoming resistance. This was confirmed during the US trading session (as indicated by the arrow).
Selling pressure intensified, and the psychologically important 6,000 level — which showed signs of support earlier in June — now appears to be acting as resistance. It is in this area that the E-Mini S&P 500 (US SPX 500 mini on FXOpen) broke below the lower boundary of its uptrend channel.
In addition to ongoing discussions about potential Fed rate cuts this summer, geopolitical risk assessments are now also in focus. It remains unclear how Washington will respond if Iran retaliates.
Meanwhile, Israel’s Defence Minister has declared a state of emergency, warning of an imminent missile and drone attack — further fuelling fears of a possible escalation.
This article represents the opinion of the Companies operating under the FXOpen brand only. It is not to be construed as an offer, solicitation, or recommendation with respect to products and services provided by the Companies operating under the FXOpen brand, nor is it to be considered financial advice.

S&P 500 Maintains Uptrend — But for How Long?S&P 500 Maintains Uptrend — But for How Long?
As the chart of the S&P 500 (US SPX 500 mini on FXOpen) shows, price movements in June continue to form an upward trend (highlighted in blue).
The bullish momentum is being supported by:
→ News of a potential trade agreement between the United States and China;
→ The latest inflation report. Data released yesterday showed that the Consumer Price Index (CPI) slowed from 0.2% to 0.1% month-on-month.
President Donald Trump described the inflation figures as “excellent” and said that the Federal Reserve should cut interest rates by a full percentage point. In his view, this would stimulate the economy — and serve as another bullish driver.
However, as illustrated by the red arrow, the index pulled back yesterday from its highest level in three and a half months, falling towards the lower boundary of the channel. This decline was triggered by concerning developments in the Middle East. According to media reports, the US is preparing a partial evacuation of its embassy in Iraq, following statements by a senior Iranian official that Tehran may strike US bases in the region if nuclear talks with Washington fail.
Technical Analysis of the S&P 500 Chart
Currently, the price remains near the lower boundary of the ascending channel, reinforced by the psychologically significant 6,000-point level.
However, note that line Q — which divides the lower half of the channel into two quarters — has flipped from support to resistance (as indicated by black arrows). This suggests increasing bearish pressure, and there is a possibility that sellers may soon attempt to push the price below the channel support.
Be prepared for potential spikes in volatility on the E-Mini S&P 500 (US SPX 500 mini on FXOpen) chart as markets await the release of the Producer Price Index (PPI) at 15:30 GMT+3 today.
This article represents the opinion of the Companies operating under the FXOpen brand only. It is not to be construed as an offer, solicitation, or recommendation with respect to products and services provided by the Companies operating under the FXOpen brand, nor is it to be considered financial advice.

S&P 500 Index May Lose Upward MomentumS&P 500 Index May Lose Upward Momentum
Yesterday’s inflation data release held no major surprises, as the actual Consumer Price Index (CPI) figures came in close to analysts’ forecasts.
According to Forex Factory:
→ Annual CPI: actual = 2.3%, forecast = 2.4%, previous = 2.4%;
→ Monthly Core CPI: actual = 0.2%, forecast = 0.3%, previous = 0.1%.
Overall, stock indices rose yesterday, but according to media reports, this momentum may begin to slow in the near future:
→ UBS analysts downgraded their rating on US equities from “attractive” to “neutral” following the recovery from early April lows;
→ Goldman Sachs analysts believe that the US stock market rally could stall at current levels. In their view, the S&P 500 (US SPX 500 mini on FXOpen) is likely to reach 5900 over the next three months.
Technical Analysis of the E-Mini S&P 500 Chart
The chart provides more reasons to suggest that the current pace of growth may begin to slow.
Firstly, the index has entered a broad range between 5800 and 6120, where it spent a prolonged period during late 2024 and early 2025. This is a zone (highlighted in purple) where supply and demand previously reached a stable equilibrium — and similar balance could potentially emerge again.
Secondly:
→ the slope of the current upward channel (marked in black) appears excessively steep;
→ the RSI indicator points to a divergence;
→ the psychological level of 6000 may act as resistance.
Given the above, special attention should be paid to the scenario in which the S&P 500 (US SPX 500 mini on FXOpen) forms a short-term correction before the end of the month.
This article represents the opinion of the Companies operating under the FXOpen brand only. It is not to be construed as an offer, solicitation, or recommendation with respect to products and services provided by the Companies operating under the FXOpen brand, nor is it to be considered financial advice.

"US500/SPX500" Index Market Money Heist Plan (Day / Swing Trade)🌟Hi! Hola! Ola! Bonjour! Hallo! Marhaba!🌟
Dear Money Makers & Robbers, 🤑💰✈️
Based on 🔥Thief Trading style technical and fundamental analysis🔥, here is our master plan to heist the "US500/SPX500" Index Market. Please adhere to the strategy I've outlined in the chart, which emphasizes short entry. Our aim is the high-risk Pink MA Zone. Risky level, oversold market, consolidation, trend reversal, trap at the level where traders and bullish robbers are stronger. 🏆💸"Take profit and treat yourself, traders. You deserve it!💪🏆🎉
Entry 📈 : "The vault is wide open! Swipe the Bearish loot at any price - the heist is on!
however I advise to Place sell limit orders within a 15 or 30 minute timeframe most nearest or swing, low or high level for Pullback Entries.
Stop Loss 🛑:
📌Thief SL placed at the nearest/swing High or Low level Using the 1D timeframe (5500) Day/Swing trade basis.
📌SL is based on your risk of the trade, lot size and how many multiple orders you have to take.
Target 🎯: 4750 (or) Escape Before the Target
💰💵💸"US500/SPX500" Index Market Heist Plan (Swing/Day Trade) is currently experiencing a Bearish trend.., driven by several key factors.👇👇👇
📰🗞️Get & Read the Fundamental, Macro, COT Report, Geopolitical and News Analysis, Sentimental Outlook, Intermarket Analysis, Index-Specific Analysis, Future trend targets with Overall outlook score... go ahead to check 👉👉👉🔗🔗
⚠️Trading Alert : News Releases and Position Management 📰 🗞️ 🚫🚏
As a reminder, news releases can have a significant impact on market prices and volatility. To minimize potential losses and protect your running positions,
we recommend the following:
Avoid taking new trades during news releases
Use trailing stop-loss orders to protect your running positions and lock in profits
💖Supporting our robbery plan 💥Hit the Boost Button💥 will enable us to effortlessly make and steal money 💰💵. Boost the strength of our robbery team. Every day in this market make money with ease by using the Thief Trading Style.🏆💪🤝❤️🎉🚀
I'll see you soon with another heist plan, so stay tuned 🤑🐱👤🤗🤩

US500/SPX500 "Standard & Poor" Indices CFD Market Heist Plan🌟Hi! Hola! Ola! Bonjour! Hallo! Marhaba!🌟
Dear Money Makers & Thieves, 🤑 💰🐱👤🐱🏍
Based on 🔥Thief Trading style technical and fundamental analysis🔥, here is our master plan to heist the ˗ˏˋ ★ ˎˊ˗US500/SPX500 "Standard & Poor" ˗ˏˋ ★ ˎˊ˗ Indices Market. Please adhere to the strategy I've outlined in the chart, which emphasizes short entry. Our aim is the high-risk Green Zone. Risky level, oversold market, consolidation, trend reversal, trap at the level where traders and bullish thieves are getting stronger. 🏆💸Book Profits Be wealthy and safe trade.💪🏆🎉
Entry 📈 : "The vault is wide open! Swipe the Bearish loot at any price - the heist is on! profits await!" however I advise placing Sell limit orders within a 15 or 30 minute timeframe. Entry from the most recent or swing low or high level should be in retest.
Stop Loss 🛑: Thief SL placed at (5920.0) swing Trade Basis Using the 4H period, the recent / swing high or low level.
SL is based on your risk of the trade, lot size and how many multiple orders you have to take.
Target 🎯: 5600.0 (or) Escape Before the Target
🧲Scalpers, take note 👀 : only scalp on the Short side. If you have a lot of money, you can go straight away; if not, you can join swing traders and carry out the robbery plan. Use trailing SL to safeguard your money 💰.
📰🗞️Fundamental, Macro, COT Report, Index-Specific Analysis, Market Sentimental Outlook:👇🏻
US500/SPX500 "Standard & Poor" Indices CFD Market is currently experiencing a Bearish trend in short term,{{{(>HIGH CHANCE FOR BULLISHNESS IN FUTURE<)}}} driven by several key factors.
🔰Fundamental Analysis
Fundamental factors underpin the S&P 500’s performance:
Economic Indicators:
GDP Growth: Assumed at 2.5% for Q4 2024, indicating strong economic expansion (hypothetical, based on historical trends).
Inflation: CPI at 2.2%, in line with the Fed’s target, supporting stable growth (assumed from recent data).
Unemployment: At 3.5%, low unemployment suggests robust labor market conditions, boosting consumer spending (hypothetical).
Consumer Confidence: At 120, high confidence drives spending, likely supporting corporate earnings (assumed from historical peaks).
Federal Reserve Policy:
Rates at 3.00-3.25%, down from 4% in 2024, with one more cut expected to 2.75-3.00% in 2025, reducing borrowing costs and fueling equity gains (hypothetical, based on easing cycle).
Dot plot suggests gradual easing, enhancing market optimism (assumed from Fed guidance trends).
Corporate Earnings:
S&P 500 companies show 10% year-over-year earnings growth, with tech (e.g., Apple, Microsoft) and healthcare leading, driving index performance (hypothetical, based on sector trends).
Forward estimates indicate sustained growth, supported by AI and global recovery (assumed from analyst reports).
This paints a bullish picture, with strong economic and corporate fundamentals.
🔰Macroeconomic Factors
Broader economic conditions influencing the S&P 500 include:
Global Economy:
China at 5% growth, Europe stable at 1.2% (Eurostat), no major recessions forecasted—neutral to bullish, as global demand supports US multinationals (hypothetical, based on ECB forecasts).
Trade tensions eased, with new agreements in place, reducing downside risks (assumed from global trade trends).
Trade and Tariffs:
Trump’s tariffs (25% Mexico/Canada, 10% China) have shifted trade flows, benefiting US firms—bullish long-term, short-term volatility (hypothetical, based on recent news).
Currency Movements:
USD stable, DXY at 100—neutral impact, as a strong dollar could hurt exports but supports domestic focus (assumed from forex trends).
Oil Prices:
At $75 per barrel, stable energy costs support consumer spending—neutral to bullish (hypothetical, based on OPEC data).
Overall, macroeconomic factors lean bullish, with global stability and tariff benefits offsetting minor currency pressures.
🔰Commitments of Traders (COT) Data
COT data from CME Group (hypothetical for March 2025):
Large Speculators: Net long ~60,000 contracts, down from 70,000 post-2024 highs—cautious bullishness, suggesting room for further gains.
Commercial Hedgers: Net short ~65,000 contracts—stable, locking in gains, neutral impact.
Open Interest: ~130,000 contracts—high, indicating strong market participation, bullish signal.
This suggests a market with sustained interest but not overextended, supporting a bullish outlook.
🔰Index-Specific Analysis
Technical and structural factors specific to the S&P 500:
Moving Averages: Price at 5760.0 is above the 50-day (5750) and 200-day (5600) moving averages—bullish signal.
Support and Resistance: Support at 5600 (recent low), resistance at 5900 (psychological level)—current price near resistance, consolidation likely.
Volatility: Implied volatility from options at 15%, suggesting expected 225-point daily range (±1.5%)—neutral, room for moves.
Market Breadth: 70% of stocks above 200-day MA, advance-decline ratio at 1.5—broad participation, bullish.
Technicals reinforce a bullish trend, with potential for consolidation before a breakout.
🔰Market Sentimental Analysis
Investor psychology and market mood:
Investor Surveys: 60% bullish (hypothetical, based on AAII trends)—strong optimism, bullish.
Social Media: Positive (e.g., market analyst predicting new highs)—bullish sentiment.
Fear and Greed Index: At 75 (greed, hypothetical)—high optimism, potential for correction, neutral short-term.
News Flow: Mixed, with earnings beats driving gains, but tariff uncertainty noted—neutral.
Sentiment is overwhelmingly bullish, though greed levels suggest caution for short-term pullbacks.
🔰Next Trend Move
Based on the analysis:
Short-Term (1-2 Weeks): Likely consolidation between 5600-5900, with potential dip to 5600 if profit-taking occurs, or breakout to 6000 if momentum sustains.
Medium-Term (1-3 Months): Break above 5900 to new highs (e.g., 6100) if Fed cuts materialize and earnings beat expectations.
Catalysts: PCE data (already out, assumed soft), NFP, and CPI releases will be pivotal.
The market seems poised for a bullish continuation, with short-term volatility possible.
🔰Overall Summary Outlook
The S&P 500 at 5760.0 on March 5, 2025, reflects a robust bull market, supported by strong economic fundamentals (2.5% GDP, 10% earnings growth), a dovish Fed (rates at 3.00-3.25%, expected cuts), and broad market participation (70% above 200-day MA). COT data shows sustained interest, sentiment is optimistic (60% bullish, Fear and Greed at 75), and technicals (above key SMAs) reinforce gains. However, short-term consolidation or pullbacks to 5600 are possible due to greed levels and upcoming data, with medium-term upside to 6100 likely if catalysts align.
🔰Future Prediction
Given the analysis, the future prediction is Bullish, with short-term consolidation (5600-5900) and medium-term potential to 6100, driven by economic strength and Fed easing.
📌Keep in mind that these factors can change rapidly, and it's essential to stay up-to-date with market developments and adjust your analysis accordingly.
⚠️Trading Alert : News Releases and Position Management 📰 🗞️ 🚫🚏
As a reminder, news releases can have a significant impact on market prices and volatility. To minimize potential losses and protect your running positions,
we recommend the following:
Avoid taking new trades during news releases
Use trailing stop-loss orders to protect your running positions and lock in profits
💖Supporting our robbery plan 💥Hit the Boost Button💥 will enable us to effortlessly make and steal money 💰💵. Boost the strength of our robbery team. Every day in this market make money with ease by using the Thief Trading Style.🏆💪🤝❤️🎉🚀
I'll see you soon with another heist plan, so stay tuned 🤑🐱👤🤗🤩

"SPX500USD" Indices Market Bearish Heist Plan🌟Hi! Hola! Ola! Bonjour! Hallo!🌟
Dear Money Makers & Robbers, 🤑 💰🐱👤🐱🏍
Based on 🔥Thief Trading style technical and fundamental analysis🔥, here is our master plan to heist the "SPX500USD" Indices Market. Please adhere to the strategy I've outlined in the chart, which emphasizes short entry. Our aim is the high-risk Green Zone. Risky level, oversold market, consolidation, trend reversal, trap at the level where traders and bullish thieves are getting stronger. 🏆💸Book Profits Be wealthy and safe trade.💪🏆🎉
Entry 📈 : "The heist is on! Sell below (5930) then make your move - Bearish profits await!"
however I advise placing Sell Stop Orders below the breakout MA or Place Sell limit orders within a 15 or 30 minute timeframe. Entry from the most recent or closest low or high level should be in retest. I Highly recommended you to put alert in your chart.
Stop Loss 🛑: Thief SL placed at 6025 (swing Trade Basis) Using the 4H period, the recent / swing high or low level.
SL is based on your risk of the trade, lot size and how many multiple orders you have to take.
Target 🎯:
Primary Target - 5875 (or) Escape Before the Target
Secondary Target - 5750 (or) Escape Before the Target
🧲Scalpers, take note 👀 : only scalp on the Short side. If you have a lot of money, you can go straight away; if not, you can join swing traders and carry out the robbery plan. Use trailing SL to safeguard your money 💰.
📰🗞️Fundamental, Macro, COT, Sentimental Outlook:
"SPX500USD" Indices Market is currently experiencing a Bearish trend., driven by several key factors.
👉Fundamental Analysis
Earnings Growth: The SPX500 earnings growth rate is expected to slow down in 2025, driven by economic uncertainty and trade tensions.
Valuation: The SPX500 forward P/E ratio is around 17.5, slightly below the historical average.
Dividend Yield: The SPX500 dividend yield is around 2.0%, relatively attractive compared to other asset classes.
👉Macro Economics
GDP Growth: The US GDP growth rate is expected to slow down in 2025, driven by economic uncertainty and trade tensions.
Inflation: The US inflation rate is expected to remain around 2.0% in 2025, slightly above the Federal Reserve's target.
Interest Rates: The Federal Reserve is expected to keep interest rates relatively stable in 2025, with a possible rate cut in the second half of the year.
👉COT Data
Commitment of Traders: The COT data shows that large speculators are net short SPX500, indicating a bearish sentiment.
Open Interest: The open interest in SPX500 futures is decreasing, indicating a declining interest in the market.
👉Market Sentimental Analysis
Bearish Sentiment: The market sentiment is currently bearish, with many investors expecting the SPX500 to continue its downward trend.
Risk Aversion: The market is experiencing high risk aversion, with investors seeking safe-haven assets such as bonds and gold.
👉Positioning
Short Positions: Many investors are holding short positions in SPX500, expecting the index to continue its downward trend.
Long Positions: Some investors are holding long positions in SPX500, expecting a potential bounce or reversal.
👉Next Trend Move
Bearish Trend: The current trend is bearish, with the SPX500 expected to continue its downward trend driven by economic uncertainty and trade tensions.
Support Levels: The next support levels are seen at 5700 and 5600.
👉Overall Summary Outlook
Bearish Outlook: The overall outlook for SPX500 is bearish, driven by economic uncertainty, trade tensions, and slowing earnings growth.
Volatility: The market is expected to remain volatile, with investors closely watching economic data, earnings reports, and geopolitical developments.
👉Real-Time Market Feed
SPX500 Price: 5990.0
24-Hour Change: -1.2%
24-Hour High: 6050.0
24-Hour Low: 5950.0
Trading Volume: 2.2 billion
👉Prediction Next Target
T1: 5875 (short-term target)
T2: 5750 (medium-term target)
T3: 5650 (long-term target)
📌Keep in mind that these factors can change rapidly, and it's essential to stay up-to-date with market developments and adjust your analysis accordingly.
⚠️Trading Alert : News Releases and Position Management 📰 🗞️ 🚫🚏
As a reminder, news releases can have a significant impact on market prices and volatility. To minimize potential losses and protect your running positions,
we recommend the following:
Avoid taking new trades during news releases
Use trailing stop-loss orders to protect your running positions and lock in profits
💖Supporting our robbery plan 💥Hit the Boost Button💥 will enable us to effortlessly make and steal money 💰💵. Boost the strength of our robbery team. Every day in this market make money with ease by using the Thief Trading Style.🏆💪🤝❤️🎉🚀
I'll see you soon with another heist plan, so stay tuned 🤑🐱👤🤗🤩

US500/SPX500 "Standard & Poor" Indices Market Bullish Heist Plan🌟Hi! Hola! Ola! Bonjour! Hallo!🌟
Dear Money Makers & Robbers, 🤑 💰
Based on 🔥Thief Trading style technical and fundamental analysis🔥, here is our master plan to heist the "US500 / SPX500" Indices market. Please adhere to the strategy I've outlined in the chart, which emphasizes long entry. Our aim is the high-risk Red Zone. Risky level, overbought market, consolidation, trend reversal, trap at the level where traders and bearish robbers are stronger. Be wealthy and safe trade.💪🏆🎉
Entry 📈 : You can enter a Bull trade after the breakout of MA level 5960 (OR) Entry in Pullback 5820
Stop Loss 🛑: Using the 2H period, the recent / nearest low or high level.
Goal 🎯: 6000.00 (or) escape Before the Target
Scalpers, take note 👀 : only scalp on the Long side. If you have a lot of money, you can go straight away; if not, you can join swing traders and carry out the robbery plan. Use trailing SL to safeguard your money 💰.
Warning⚠️ : Our heist strategy is incompatible with Fundamental Analysis news 📰 🗞️. We'll wreck our plan by smashing the Stop Loss 🚫🚏. Avoid entering the market right after the news release.
Fundamental Outlook 📰🗞️
Expected Trend: The US500/S&P500 index is expected to move in a bullish trend.
Drivers of the Trend: The bullish trend is driven by:
Strong US economic growth
Low interest rates
A potential rebound in corporate earnings
Current Price: The current price of the S&P 500 is around 5802.
Client Sentiment: 51% of client accounts are holding long positions on this market.
Top Risers: Some of the top risers in the US500 index include stocks with percentage changes of:
27.55%
5.8%
32.96%
Top Fallers: Some of the top fallers in the US500 index include stocks with percentage changes of:
-26.21%
-17.09%
-49.06%
Dow Jones Index: The Dow Jones index has been holding support, despite rising yields putting pressure on global indices.
Earnings Growth: The S&P 500 is expected to report its strongest earnings growth since Q4 2021, with an 11.9% increase.
Market Sentiment:
Bullish Sentiment: 60% of traders and investors are bullish on the US500/S&P500, expecting the market to continue its upward trend.
Bearish Sentiment: 30% of traders and investors are bearish on the US500/S&P500, expecting the market to pull back or reverse its trend.
Neutral Sentiment: 10% of traders and investors are neutral on the US500/S&P500, waiting for more information or confirmation before making a trade.
Please note that this is a general analysis and not personalized investment advice. It's essential to consider your own risk tolerance and market analysis before making any investment decisions.
Take advantage of the target and get away 🎯 Swing Traders Please reserve the half amount of money and watch for the next dynamic level or order block breakout. Once it is resolved, we can go on to the next new target in our heist plan.
Keep in mind that these factors can change rapidly, and it's essential to stay up-to-date with market developments and adjust your analysis accordingly.
💖Supporting our robbery plan will enable us to effortlessly make and steal money 💰💵 Tell your friends, Colleagues and family to follow, like, and share. Boost the strength of our robbery team. Every day in this market make money with ease by using the Thief Trading Style.🏆💪🤝❤️🎉🚀
I'll see you soon with another heist plan, so stay tuned 🫂

SPX500 Potential Long!SPX500 is trading in an
Uptrend and indice is now
Making a pullback to
Retest a horizontal support
Of 5645.80 so after the retest
We will be expecting
A local bullish rebound !

spx500 buy setuphello good people this is my institutional tactics setup
1:6 Risk reward ratio
if you like my ideas follow hit the like button comment and show some love ❤️
wish you good luck and good trading
help me get funded

SPX500 Bullish Breakout!SPX500 was trading in a
Bullish flag pattern and now
We are seeing a bullish breakout
So we are bullish biased
Now and we will be expecting
A further move up !

SPX500 IndexPair : SPX500 Index
Description :
Rejecting from Resistance Level with Strong Divergence in RSI. Bullish Channel as an Corrective Pattern in Long Time Frame with the Rejection from Upper Trend Line. Completed " 12345 " Impulsive Waves

SPX500 IndexPair : SPX500 Index
Description :
Bullish Channel as an Corrective Pattern in Long Time Frame. It has completed " 12345 " Impulsive Waves at Daily Resistance Level creating Double Top Pattern as Corrective Pattern in Short Time Frame. We have Strong Divergence and CHoCH

SPX500 Bearish Bias!SPX500 went up and hit
A horizontal resistance of 4770
From where we are seeing
A bearish reaction so I think
That we will see a move down !

NASDAQ100his could be a break to the upside of 12127.00
If this goes up, it could break the next price of 13000.00
My crazy prediction is the price hitting 13721.8.
Let me see how it goes. SKILLING:NASDAQ

S&P500 | Spx500like i had said in the last Analysis will see Spx500 Go Bullish and reach 3920 probably by next week

SPX500 likely to all!Hey tradomaniacs,
technically we have tested a good spot to sell.
This week is NFP week and we get the ISM-Index in a few minutes, so be cautious with fake-moves toiday / during the week.
Orderflow has not shown any confirmation yet, just a strong increase in volume and an instant sell-off with the US-Opening.
Still waiting for a trigger!
What do you think?


SPX Short TradingAmongst Poor market sentiment we have seen a Fall in the SPX Futures market.
A small Rally has rebounded us towards Former resistance.
After support becomes Resistance you turn SHORT. This is how successful Trading works.
The higher up your short position, the more risk averse you tend to be.
This is why the positions available are Labelled as such, if you are trading ALL day you can take lighter entries earlier.
If you are trading swings you can wait for a further move.
Trade light and trade safe as always!

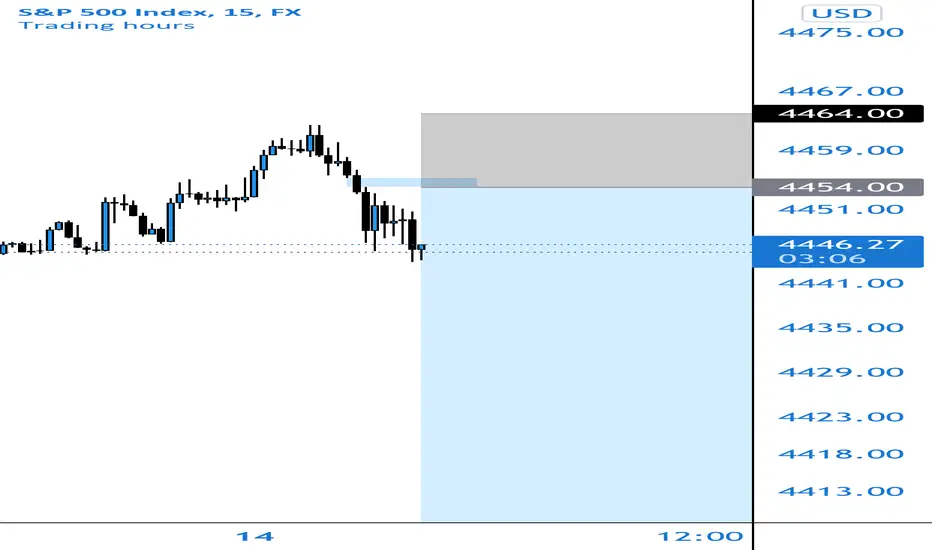
Spx500 Short SignalJust set a sell limit right here on spx500. Had a nice bullish run but didn’t break the high or low. Also the weekly will likely still close bearish so I expect price to take out those lows. Have a nice 15m shift leaving some imbalance to fill and have my stop above the swing High. Use proper risk management and fingers crossed we get triggered in after this nice bearish 4h closes!
SPX500 Entries + ExitsSome big support/break plays for this pair this week!
The 1on1 video is currently out, if you would like it in order to understand how to play my analysis FULLY, please let me know privately.
All likes/comments and feedback are very much appreciated!
How to play my chart:
Buy at support, sell at resistance. When you open this chart you'll see a green entry and a red entry. When the candlestick hits the green entry, you place a buy. If however that support buy doesn't go into profit and goes negative -35 or -60 pips (depending if it was a fast break/or if the break landed on a minute 15 zone), if it breaks you would then exit your buy and immediately enter the sell. You would then ride that sell down to green TP1, or you could then repeat and play the buy/break there.
The same exact thing goes for resistance sell/break plays!

Just went long SPX500 SPX500 it’s trending to the upside on the higher timeframes, looks like price is making a double bottom on the 15min for a higher low on the 1H and a possible continuation to new highs💯
