SPx500 4H (Pivot Price: 4493)SPx500
stabilizing above 4493 will support rising to touch 4542 then 4561 then 4579
stabilizing under 4493 will support falling to touch 4503 and then 4483
Pivot Price: 4493
Resistance prices: 4542 & 4561& 4579
Support prices: 4503 & 4483 & 4465
timeframe: 4H
US SPX 500

S&P 500 ForecastS&P 500 moved towards the 3980 level as traders prepared for tomorrow’s CPI data meanwhile, the tech heavy NASDAQ Composite was up by 0.4%.
Today’s rebound is led by energy stocks. WTI oil managed to get above the $73 level as traders focused on the Keystone pipeline outage.
From a big picture point of view, S&P 500 continues to consolidate in the range between the support at 3915 and the resistance at 3975. RSI is in the moderate territory, so there is plenty of room to gain additional momentum after the CPI data and the Fed decision. If the CPI report shows that inflation is slowing down, the current consolidation will serve as a good base for an upside move. However, it should be noted that traders may remain somewhat cautious ahead of the Fed decision.A move below the 50 EMA, which is located near the 3915 level, may be interpreted as a sign of an upcoming sell-off. S&P 500 received strong support near this level, so traders may rush out of their long positions if this support level is broken
we still in down trend and we should break the yellow line and back 4100 level
The Fed is still playing catch up to tame rising prices after its protracted gross mischaracterisation last year of inflation as ‘transitory’ and its initially timid steps to withdraw monetary stimulus,
The world’s most powerful central bank is now confronted with two unpleasant choices next year, crush growth and jobs to get to its 2% target or publicly validate a higher inflation target and risk a new round of destabilized inflationary expectations. I think Rather than fall to 2-3% by the end of next year, U.S. core PCE inflation will probably prove rather sticky at around 4% or above.

SPY will going hit new high on July 2024Thick dotted line 📌 expecting break red line 📌 hit high and correction
Later new high 💰
Any rejection at red trend 📉 line will reach yellow 🟡 box 📍
Return new high and high

SPx500 4H (Pivot Price: 4493)SPx500
stabilizing above 4493 will support rising to touch 4542 then 4561 then 4579
stabilizing under 4493 will support falling to touch 4503 and then 4483
Pivot Price: 4493
Resistance prices: 4542 & 4561& 4579
Support prices: 4503 & 4483 & 4465
time frame: 4H

SPX500USD Is Going Up! Long!
Take a look at our analysis for SPX500USD.
Time Frame: 4h
Current Trend: Bullish
Sentiment: Oversold (based on 7-period RSI)
Forecast: Bullish
The market is approaching a key horizontal level 4525.0.
Considering the today's price action, probabilities will be high to see a movement to 4580.3.
P.S
The term oversold refers to a condition where an asset has traded lower in price and has the potential for a price bounce.
Overbought refers to market scenarios where the instrument is traded considerably higher than its fair value. Overvaluation is caused by market sentiments when there is positive news.
Like and subscribe and comment my ideas if you enjoy them!

SPx500 4H (Pivot Price: 4493)SPx500
stabilizing above 4493 will support rising to touch 4518 then 4542 then 4561
stabilizing under 4493 will support falling to touch 4472 and then 4452
Pivot Price: 4493
Resistance prices: 4518 & 4542 & 4561
Support prices: 4472 & 4452 & 4432
time frame: 4H

SXP500 Index 30/08 MovePair : SPX500 Index
Description :
Bullish Channel in Long Time Frame and Rejecting from the Upper Trend Line Completing its " 3rd " Impulsive Wave. We have Break of Structure and Making its Retracement in Corrective Waves " ABC " . Possible Rejection from Fibonacci Level 61.80% or Previous Resistance

SPx500 4H (Pivot Price: 4437)
SPx500
stabilizing above 4437 will support rising to touch 4452 then 4474 then 4500
stabilizing under 4437 will support falling to touch 4432 and then 4400
Pivot Price: 4437
Resistance prices: 4452 & 4474 & 4500
Support prices: 4432 & 4400 & 4378
timeframe: 4H

SP500 AnalysisWe got the rejection we were looking for at 4440. We took our first profits at 4420.
Now we are looking for a pullback UP and then enter again with a final target zone of 44.10 or so.

SPX500USD Is Very Bullish! Long!
Please, check our technical outlook for SPX500USD.
Time Frame: 1D
Current Trend: Bullish
Sentiment: Oversold (based on 7-period RSI)
Forecast: Bullish
The market is testing a major horizontal structure 4408.7.
Taking into consideration the structure & trend analysis, I believe that the market will reach 4514.5 level soon.
P.S
The term oversold refers to a condition where an asset has traded lower in price and has the potential for a price bounce.
Overbought refers to market scenarios where the instrument is traded considerably higher than its fair value. Overvaluation is caused by market sentiments when there is positive news.
Like and subscribe and comment my ideas if you enjoy them!

SPX500USD SellDaily chart is showing head and shoulder pattern. Uptrend line is already broken. The price is rejected by support turn resistance level. There are a lot of sell orders at that level.
The Fed still have intent to increase interest rate at the end of the year 2023 should the inflation continue to stay above 2% target. As US Interest rate increase, the USD demand will be high and thus attract a lot of buying pressure for USD. DXY is correlated with other USD pairs. When DXY is going up and other USD pairs will be going down.

SPX to new highs SPX loves cups and handles.
All the highlighted Cup & Handles on daily have played out beautifully so far, they all have been to the upside so far, but now we are making one to the downside with targets towards 4150. Then how do we reach new highs?
If we zoom out to monthly TF things become clearer. As long as we stay above 0.5 or close above it on monthly, we have a chance to make new highs in a year or so.
I have highlighted several upside targets based on where we bounce from on monthly.

SPX did everything as per the plan, Where to now?I posted this chart just last week as part of my Major short setup going back weeks. Link to previous post in the description, please go through that setup to get the context.
This is going to be a short post, since everything is going as per the plan we just have to wait and watch, Price back to where I expect either a break below or bounce to continue higher.
So as per the plan If it's going to bounce now, I have highlighted two 30 mins demand zones. where I expect a bounce. Those two zones are also confluent with 0.786 and 0.886 fibs of the retracements.
Apart from this chart it pretty is self-explanatory.
Boost this post and leave me comment for any questions on this I'd be happy to explain.

SPX500USD: Will Start Falling! Here is Why:
Balance of buyers and sellers on the SPX500USD pair, that is best felt when all the timeframes are analyzed properly is shifting in favor of the sellers, therefore is it only natural that we go short on the pair.
❤️ Please, support our work with like & comment! ❤️

SPx500 4H (Pivot Price: 4457)SPx500
stabilizing above 4457 will support rising to touch 4480 then 4500 then 4525
stabilizing under 4457 will support falling to touch 4434 and then 4413
Pivot Price: 4457
Resistance prices: 4480 & 4500 & 4525
Support prices: 4434 & 4413 & 4393
timeframe: 4H

SPX500USD Seeking a Bearish movement
US500 in a Clear movement upon the DIALY bias looks to be bearish with 45% win rate using your lower time frame entry check list if spotted right in the NEWYORK KILL ZONE.

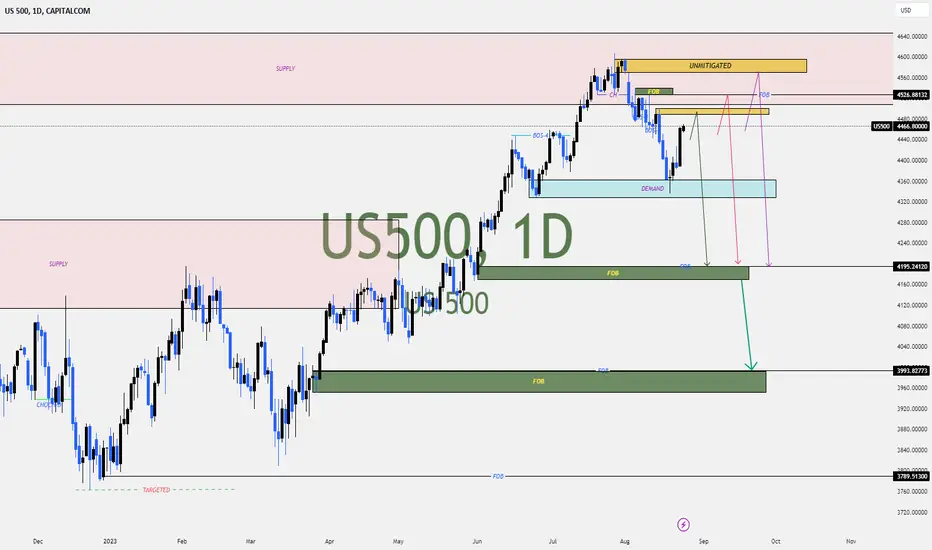
US 500On the weekly timeframe we have a change of character (CHOCH). Presently we are completing a bullish correction before resumption of the main bearish trend targeting the downside. On the daily time frame, we have a sell limit placed at the 4526 levels and take profit at 3993 price handle.
$NVDA -Potential Downside (21Aug/2023)- Welcoming NYSE opening this Week with an opened Short position on NASDAQ:NVDA taken last week due to a Broadening Wedge pattern being formed and Lower Highs Market Structure.
May be forced to Trail SL according to how markets will open
from the positive last Friday's Rally .
TRADE SAFE
*** Note that this is not Financial Advice !
Please do your own research and consult your own Financial Advisor
before partaking on any Trading Activity based Solely on this Idea.

S&P 500 H4 | Bearish reaction off 23.6% Fibo?Price is approaching our sell entry at 4401.43, which is a pullback resistance level, and at the 23.6% fibo retracement. Our stop loss is at 4449.30, which is placed slightly above the 38.2% fibo retracement and it is also a pullback resistance level. Take profit is at 4341.27, which is a multi-swing low support level.
Please be advised that the information presented on TradingView is provided to FXCM (‘Company’, ‘we’) by a third-party provider (‘Name of third party provider). Please be reminded that you are solely responsible for the trading decisions on your account. There is a very high degree of risk involved in trading. Any information and/or content is intended entirely for research, educational and informational purposes only and does not constitute investment or consultation advice or investment strategy. The information is not tailored to the investment needs of any specific person and therefore does not involve a consideration of any of the investment objectives, financial situation or needs of any viewer that may receive it. Kindly also note that past performance is not a reliable indicator of future results. Actual results may differ materially from those anticipated in forward-looking or past performance statements. We assume no liability as to the accuracy or completeness of any of the information and/or content provided herein and the Company cannot be held responsible for any omission, mistake nor for any loss or damage including without limitation to any loss of profit which may arise from reliance on any information supplied by Name of third party provider.
The speaker(s) is neither an employee, agent nor representative of FXCM and is therefore acting independently. The opinions given are their own, constitute general market commentary, and do not constitute the opinion or advice of FXCM or any form of personal or investment advice. FXCM neither endorses nor guarantees offerings of third party speakers, nor is FXCM responsible for the content, veracity or opinions of third-party speakers, presenters or participants.
High Risk Investment Warning
Trading Forex/CFDs on margin carries a high level of risk and may not be suitable for all investors. Leverage can work against you.
Forex Capital Markets Limited (www.fxcm.com):
CFDs are complex instruments and come with a high risk of losing money rapidly due to leverage. 70% of retail investor accounts lose money when trading CFDs with this provider. You should consider whether you understand how CFDs work and whether you can afford to take the high risk of losing your money.
Stratos Europe Ltd, previously FXCM EU Ltd (www.fxcm.com):
CFDs are complex instruments and come with a high risk of losing money rapidly due to leverage. 74% of retail investor accounts lose money when trading CFDs with this provider. You should consider whether you understand how CFDs work and whether you can afford to take the high risk of losing your money.
FXCM Australia Pty. Limited (www.fxcm.com): **
Trading FX/CFDs carries significant risks. FXCM AU (AFSL 309763), please read the Financial Services Guide, Product Disclosure Statement, Target Market Determination and Terms of Business at www.fxcm.com
FXCM Markets LLC (www.fxcm.com):
Losses can exceed deposits.

S&P ⇨long-term predictionhello guys...
as you can see the head of the pattern touched the flip area, this strategy is fascinating for setup!
and then formed a head and shoulders pattern and broke up the neckline very well,
so the target of this pattern is $4630
after that it is more probable if the price retraces to the QML and the neckline, let's see what happens.
______________________________
always do your research.
If you have any questions, you can write them in the comments below, and I will answer them.
And please don't forget to support this idea with your likes and comment

DXY 103.881-105.664: Section where resistance is requiredHello?
Traders, welcome.
If you "Follow", you can always get new information quickly.
Please also click "Boost".
Have a good day.
-------------------------------------
(DXY chart)
With the DXY rising above 103.025, the investment market appears to be slowing down.
On the 1W chart, the 103.881 point corresponds to the resistance section, and on the 1M chart, the 105.664 point corresponds to the resistance section.
Therefore, the key is whether it can fall with resistance in the 103.881-105.664 area.
------------------------------------------
(SPX500USD chart)
It shows a decline below the 4419.18, the HA-High indicator point on the 1M chart.
Accordingly, the key is whether it can rise with support around 4371.6.
If not, you need to make sure it is supported around 4255.2.
-----------------------------------------------
(NAS100USD chart)
The key is whether you can rise with support around 14710.6-15090.3.
If not, you need to make sure it is supported around 13418.8.
-------------------------------------------------- -------------------------------------------
** All descriptions are for reference only and do not guarantee profit or loss in investment.
** The trading volume indicator is displayed as a candle body based on 10EMA.
Display method (in order of boldest)
More than 3x 10EMA trading volume > 2.5x > 2.0x > 1.25x > trading volume below 10EMA
** Even if you know other people's know-how, it takes a considerable period of time to make it your own.
** This is a chart created with my know-how.
---------------------------------

S&P500 - BEARISH MOVE 📉Hi Traders👋🏻
On The Daily Time Frame, S&p500 Price Reached A Support Level (4463.68 - 4447.89)
Currently, This Key Level is Broken📉
The Support Line is Broken🔥
So, I Expect a Bearish Move📉
i'm waiting for a retest...
-----------
TARGET: 4408.00🎯
___________
if you agreed with this IDEA, please leave a LIKE, SUBSCRIBE or COMMENT!

Update SPX500 👴📣Update SPX500
I'm doing some tests with a new indicator.
In the case of this asset, we may be at a local top at 5056 and a bottom close to 2691, let's follow, I'm testing the new indicator that I developed within the global markets index and I've been getting many positive results.
Follow me and share with a friend to encourage me to make the bookmark available to you in the future.
