SPX500 | Bearish Below 6010 Amid Rising Geopolitical TensionsSPX500 | OVERVIEW
The index remains under bearish pressure due to escalating geopolitical tensions, particularly the ongoing conflict.
As long as these conditions persist, the market is likely to maintain a downward bias.
Technical Outlook:
As long as the price trades below the 5990–6010 pivot zone, the bearish trend is expected to continue toward 5938.
A confirmed stability below 5938 may lead to further downside toward 5902 and 5858.
A bullish reversal is only likely if hostilities cease or negotiations begin between the conflicting parties.
Pivot Zone: 5990 – 6010
Support Lines: 5938, 5902, 5858
Resistance Lines: 6041, 6098, 6143
previous idea:
US SPX 500

S&P 500 Breaks UptrendS&P 500 Breaks Uptrend
Only yesterday we questioned the sustainability of the stock market’s upward trend amid alarming news from the Middle East and the evacuation of the US embassy in Iraq — and today, the S&P 500 chart (US SPX 500 mini on FXOpen) shows a break below the lower boundary of the ascending trend channel.
According to media reports:
→ Steve Witkoff, US President Donald Trump’s special envoy to the Middle East, was expected to meet Iran’s Foreign Minister in Oman on Sunday.
→ Friday the 13th became the date when Israel launched strikes on Iran’s nuclear facilities, dramatically altering the outlook for a potential US-Iran nuclear agreement.
→ Secretary of State Marco Rubio stated that the US was not involved in the operation, while Israel’s state broadcaster reported that Washington had been informed ahead of the strikes.
Technical Analysis of the S&P 500 Chart
Yesterday morning, we noted that the Q-line, which divides the lower half of the channel into two quarters, had shifted from acting as support to becoming resistance. This was confirmed during the US trading session (as indicated by the arrow).
Selling pressure intensified, and the psychologically important 6,000 level — which showed signs of support earlier in June — now appears to be acting as resistance. It is in this area that the E-Mini S&P 500 (US SPX 500 mini on FXOpen) broke below the lower boundary of its uptrend channel.
In addition to ongoing discussions about potential Fed rate cuts this summer, geopolitical risk assessments are now also in focus. It remains unclear how Washington will respond if Iran retaliates.
Meanwhile, Israel’s Defence Minister has declared a state of emergency, warning of an imminent missile and drone attack — further fuelling fears of a possible escalation.
This article represents the opinion of the Companies operating under the FXOpen brand only. It is not to be construed as an offer, solicitation, or recommendation with respect to products and services provided by the Companies operating under the FXOpen brand, nor is it to be considered financial advice.

S&P 500 Breaks Out — Trump, Tariffs & Bullish Island PatternDonald Trump has mentioned the US stock market in every meeting he has held in the past few days, which has caused the US stock market indices , including the S&P500 Index ( SP:SPX ), to rise:
"Better go out and buy stocks now".
President Donald Trump told a crowd in Saudi Arabia on Tuesday that the markets are just getting started. “It’s going to get a lot higher,” he said, right as the S&P 500 posted its first gain since late February.
But one of the main reasons for the increase in the S&P 500 Index and US stocks is The United States has dropped its tariffs on Chinese goods to 30% , down from a brutal 145% , while China is slashing its own duties on US imports to just 10% , temporarily, for the next 90 days .
-------------------------------------------------
Now let's take a look at the S&P 500 Index chart on the daily time frame .
S&P500 Index managed to break the Resistance zone($5,737_$5,506) and 21_SMA(Weekly) by Breakaway Gap .
In terms of Classic Technical Analysis , the S&P500 Index has managed to form a Bullish Long Island Pattern , and this pattern is one of the continuing patterns and will be a sign of the continuation of the S&P500 Index's upward trend .
In terms of Elliott Wave theory , it seems that the S&P500 index has completed the corrective wave and is in new impulsive waves , which could cause a new All-Time High(ATH) to form.
I expect the S&P500 index to increase by at least +5% as it approaches the Uptrend line , and we will see the possibility of a new ATH .
Please respect each other's ideas and express them politely if you agree or disagree.
S&P 500 Index Analyze (SPX500USD), Daily time frame.
Be sure to follow the updated ideas.
Do not forget to put a Stop loss for your positions (For every position you want to open).
Please follow your strategy and updates; this is just my Idea, and I will gladly see your ideas in this post.
Please do not forget the ✅' like '✅ button 🙏😊 & Share it with your friends; thanks, and Trade safe.

S&P 500 Maintains Uptrend — But for How Long?S&P 500 Maintains Uptrend — But for How Long?
As the chart of the S&P 500 (US SPX 500 mini on FXOpen) shows, price movements in June continue to form an upward trend (highlighted in blue).
The bullish momentum is being supported by:
→ News of a potential trade agreement between the United States and China;
→ The latest inflation report. Data released yesterday showed that the Consumer Price Index (CPI) slowed from 0.2% to 0.1% month-on-month.
President Donald Trump described the inflation figures as “excellent” and said that the Federal Reserve should cut interest rates by a full percentage point. In his view, this would stimulate the economy — and serve as another bullish driver.
However, as illustrated by the red arrow, the index pulled back yesterday from its highest level in three and a half months, falling towards the lower boundary of the channel. This decline was triggered by concerning developments in the Middle East. According to media reports, the US is preparing a partial evacuation of its embassy in Iraq, following statements by a senior Iranian official that Tehran may strike US bases in the region if nuclear talks with Washington fail.
Technical Analysis of the S&P 500 Chart
Currently, the price remains near the lower boundary of the ascending channel, reinforced by the psychologically significant 6,000-point level.
However, note that line Q — which divides the lower half of the channel into two quarters — has flipped from support to resistance (as indicated by black arrows). This suggests increasing bearish pressure, and there is a possibility that sellers may soon attempt to push the price below the channel support.
Be prepared for potential spikes in volatility on the E-Mini S&P 500 (US SPX 500 mini on FXOpen) chart as markets await the release of the Producer Price Index (PPI) at 15:30 GMT+3 today.
This article represents the opinion of the Companies operating under the FXOpen brand only. It is not to be construed as an offer, solicitation, or recommendation with respect to products and services provided by the Companies operating under the FXOpen brand, nor is it to be considered financial advice.


S&P 500 in EUR - SHORT- in 15 days timeline
- broke the trendline that comes from 2020 to the downside
- retested and could not go above
- may try again and if fails again, then 25% correction likely

SPX500 – Consolidation Between 5966–5990, Breakout to Set DirectSPX500 | Technical View
The price is currently consolidating between 5966 and 5990.
A 1H or 4H candle close below 5966 would confirm bearish momentum, with downside targets at 5938 and 5905.
However, as long as price trades above 5966, the outlook remains bullish, targeting 5990.
A 1H close above 5990 may extend the move toward 6010 and 6030.
Resistance: 5990, 6010, 6030
Support: 5938, 5905, 5858

Falling towards pullback support?S&P500 is falling towards the support level which is a pullback support that aligns with the 38.2% Fibonacci retracement and could bounce from this level to our take profit.
Entry: 5,780.17
Why we like it:
There is a pullback support level that lines up with the 38.2% Fibonacci retracement.
Stop loss: 5,689.40
Why we like it:
There is a pullback support level that is slightly below the 50% Fibonacci retracement.
Take profit: 5,973.58
Why we like it:
There is a pullback resistance level.
Enjoying your TradingView experience? Review us!
Please be advised that the information presented on TradingView is provided to Vantage (‘Vantage Global Limited’, ‘we’) by a third-party provider (‘Everest Fortune Group’). Please be reminded that you are solely responsible for the trading decisions on your account. There is a very high degree of risk involved in trading. Any information and/or content is intended entirely for research, educational and informational purposes only and does not constitute investment or consultation advice or investment strategy. The information is not tailored to the investment needs of any specific person and therefore does not involve a consideration of any of the investment objectives, financial situation or needs of any viewer that may receive it. Kindly also note that past performance is not a reliable indicator of future results. Actual results may differ materially from those anticipated in forward-looking or past performance statements. We assume no liability as to the accuracy or completeness of any of the information and/or content provided herein and the Company cannot be held responsible for any omission, mistake nor for any loss or damage including without limitation to any loss of profit which may arise from reliance on any information supplied by Everest Fortune Group.

Bullish continuation?S&P500 has bounced off the support level which is a pullback support that aligns with the 23.6% Fibonacci retracement and could potentially rise from this level to our take profit.
Entry: 5,784.04
Why we like it:
There is a pullback support level that lines up with the 23.6% Fibonacci retracement.
Stop loss: 5,689.40
Why we lik eit:
There is a pullback support level that is slightly above the 38.2% Fibonacci retracement.
Take profit: 6,003.35
Why we like it:
There is a pullback resistance level.
Enjoying your TradingView experience? Review us!
Please be advised that the information presented on TradingView is provided to Vantage (‘Vantage Global Limited’, ‘we’) by a third-party provider (‘Everest Fortune Group’). Please be reminded that you are solely responsible for the trading decisions on your account. There is a very high degree of risk involved in trading. Any information and/or content is intended entirely for research, educational and informational purposes only and does not constitute investment or consultation advice or investment strategy. The information is not tailored to the investment needs of any specific person and therefore does not involve a consideration of any of the investment objectives, financial situation or needs of any viewer that may receive it. Kindly also note that past performance is not a reliable indicator of future results. Actual results may differ materially from those anticipated in forward-looking or past performance statements. We assume no liability as to the accuracy or completeness of any of the information and/or content provided herein and the Company cannot be held responsible for any omission, mistake nor for any loss or damage including without limitation to any loss of profit which may arise from reliance on any information supplied by Everest Fortune Group.

ES1! "E-Mini S&P500" Index Market Bullish Robbery Plan🌟Hi! Hola! Ola! Bonjour! Hallo! Marhaba!🌟
Dear Money Makers & Robbers, 🤑 💰💸✈️
Based on 🔥Thief Trading style technical and fundamental analysis🔥, here is our master plan to heist the ES1! "E-Mini S&P500" Index Market. Please adhere to the strategy I've outlined in the chart, which emphasizes long entry. Our aim is to escape near the high-risk Red Zone Level. Risky level, overbought market, consolidation, trend reversal, trap at the level where traders and bearish robbers are stronger. 🏆💸"Take profit and treat yourself, traders. You deserve it!💪🏆🎉
Entry 📈 : "The heist is on! Wait for the MA line breakout (5830.00) then make your move - Bullish profits await!"
however I advise to Place Buy stop orders above the Moving average (or) Place buy limit orders within a 15 or 30 minute timeframe most recent or swing, low or high level for Pullback entries.
📌I strongly advise you to set an "alert (Alarm)" on your chart so you can see when the breakout entry occurs.
Stop Loss 🛑: "🔊 Yo, listen up! 🗣️ If you're lookin' to get in on a buy stop order, don't even think about settin' that stop loss till after the breakout 🚀. You feel me? Now, if you're smart, you'll place that stop loss where I told you to 📍, but if you're a rebel, you can put it wherever you like 🤪 - just don't say I didn't warn you ⚠️. You're playin' with fire 🔥, and it's your risk, not mine 👊."
📍 Thief SL placed at the recent/swing low level Using the 4H timeframe (5600.00) Day/Swing trade basis.
📍 SL is based on your risk of the trade, lot size and how many multiple orders you have to take.
🏴☠️Target 🎯: 6100.00 (or) Escape Before the Target.
🧲Scalpers, take note 👀 : only scalp on the Long side. If you have a lot of money, you can go straight away; if not, you can join swing traders and carry out the robbery plan. Use trailing SL to safeguard your money 💰.
💰💵💸ES1! "E-Mini S&P500" Index Market Heist (Swing Trade Plan) is currently experiencing a neutral trend there is high chance for bullishness,., driven by several key factors. .☝☝☝
⚠️Trading Alert : News Releases and Position Management 📰 🗞️ 🚫🚏
As a reminder, news releases can have a significant impact on market prices and volatility. To minimize potential losses and protect your running positions,
we recommend the following:
Avoid taking new trades during news releases
Use trailing stop-loss orders to protect your running positions and lock in profits
💖Supporting our robbery plan 💥Hit the Boost Button💥 will enable us to effortlessly make and steal money 💰💵. Boost the strength of our robbery team. Every day in this market make money with ease by using the Thief Trading Style.🏆💪🤝❤️🎉🚀
I'll see you soon with another heist plan, so stay tuned 🤑🐱👤🤗🤩

Bullish continuation?S&P500 (US500) is falling towards the pivot which is a pullback support and could bounce to the 1st resistance which aligns with the 138.2% Fibonacci extension.
Pivot: 5,782.52
1st Support: 5,692.37
1st Resistance: 6,138.06
Risk Warning:
Trading Forex and CFDs carries a high level of risk to your capital and you should only trade with money you can afford to lose. Trading Forex and CFDs may not be suitable for all investors, so please ensure that you fully understand the risks involved and seek independent advice if necessary.
Disclaimer:
The above opinions given constitute general market commentary, and do not constitute the opinion or advice of IC Markets or any form of personal or investment advice.
Any opinions, news, research, analyses, prices, other information, or links to third-party sites contained on this website are provided on an "as-is" basis, are intended only to be informative, is not an advice nor a recommendation, nor research, or a record of our trading prices, or an offer of, or solicitation for a transaction in any financial instrument and thus should not be treated as such. The information provided does not involve any specific investment objectives, financial situation and needs of any specific person who may receive it. Please be aware, that past performance is not a reliable indicator of future performance and/or results. Past Performance or Forward-looking scenarios based upon the reasonable beliefs of the third-party provider are not a guarantee of future performance. Actual results may differ materially from those anticipated in forward-looking or past performance statements. IC Markets makes no representation or warranty and assumes no liability as to the accuracy or completeness of the information provided, nor any loss arising from any investment based on a recommendation, forecast or any information supplied by any third-party.

Spx500usdThere u go by decimals, almost there,
Here you go, it might be in bull today, I just hope so
Keep Ur own trades safe guy and DYOR
Do always Your Own Reseach

Spx500usd up? 1min chart at 23h London time?As it is , all I hope is that spx 500usd starts here at that blue line, after all, if it starts at the blue line the stock as might be up again, I'm not into the fundamentals by this time, I'm just making some Elliot and indicators-some mine, others don't, and trend analysis
Hope u guys all in profit
After all we all looking for the same
Keep Ur trades safe
And Do Always Your Own Research
DAYOR
Keep it safe
This my my graph at 1min candles, returned to 15min chart
Keep it safe.
And keep cool.

S&P 500 1W forecast until mid June 2025It's in reversal now. Uptrend has finished and downtrend is starting. A fall downto 5105 is on the table. It may last until the middle of June 2025.
This view is also supported by my VIX forecast.
Weekly updates of 1D chart are available through social media links in my profile.

PZZA'S Divers on the weekly chart still on going @ 22 weeks !Since the IPO we have had many weekly divers as such on the chart, as of
this week we stand at 22 weeks Our MAX weekly divers was 56 Zoon in
and go back to see data on the chart !!

ES1! (S&P500 Mini Futures) - Support Trendline Price Test -DailyES1! (S&P500 Mini Futures) price is currently testing a support trendline around $5900.
If several daily Price candles close below $5865 this month, a pullback in the price can occur (rising wedge pattern).
Volume has been decreasing in May 2025, compared to March and April.
Finance and Technology corporate earnings season has passed. The U.S. government 90-day tariff pause is set to expire in early July (pending trade deal negotiations with other countries).
Tariff and trade deal news, breaking news, corporate earnings, government law changes, consumer sentiment, inflation data, the FOMC, and presidential announcements can all affect the prices of stocks and ETFs.

SPY (S&P500 ETF) - Testing Key Resistance Levels - Weekly ChartSPY (S&P500 ETF) is currently attempting an uptrend rally, bouncing up from the April 7th 2025 support level ($488) and weekly support trendline.
The current resistance price level is $569 above, and the support price level below is $555.
SPY price needs to remain and close above $522 in May 2025 to maintain the current uptrend rally.
Resistance price targets above: $569, $578, $600, $610.
Support price targets below: $555, $542, $533, $512.
Tariff and trade deal news, corporate earnings, government law changes, and consumer sentiment will continue to affect the stock price action of SPY.
Support price levels need to hold for an uptrend to continue in 2025.

STOCKS | MARKET WATCH | Why Long-Term Investing Still Wins🤯 The start of 2025 was a bit of a rollercoaster for stocks.
Global markets got seriously rattled in the first few months by some sudden jitters. When President Trump announced those aggressive tariffs, it caused significant concern among investors, sending stock markets tumbling and prompting a flight to safety. Like Reuters said, April was "epic" for crazy market swings – the VIX fear index shot up to levels we hadn't seen since 2020 and 2008, and then just as quickly dropped back down. Markets went wild.
But then, by late April, the panic kind of ... disappeared. Once President Trump paused the implementation of the most severe tariffs, stocks bounced back pretty sharply. The S&P 500 recovered most of what it lost. After that nasty drop, it ended April only about 5% lower than it started the year. The Nasdaq, with all its tech stocks, pretty much ended the month where it began. So, after all that drama, major US stock markets weren't far from their all-time highs, showing how fast that "fear" can vanish.
📊 How key indexes did
S&P 500 (USA): 📉 Dipped in early April but bounced back late. Ended April around -5% for the year, after almost hitting a bear market.
Nasdaq Composite (USA): 📉 Similar story. Tanked on the tariff scare, then rallied when things calmed down, ending April pretty much flat for the year.
MSCI World (Global developed markets): 🤷♂️ Had its ups and downs along with the US markets. By the end of April, it was pretty much flat for the year – no big moves for the overall world index.
MSCI Emerging Markets: 📉 Didn't do as well as developed markets. Asian stocks, especially, took a hit early April because of trade war worries, so this index lagged, even though it recovered a bit by the end of the month.
FTSE/JSE All-Share (South Africa): 🇿🇦 The odd one out! The JSE jumped about +5% in the first three months of 2025, mainly thanks to mining stocks. It even hit a record high in March. The April craziness shook it up too, but because it did so well earlier, it was still slightly up for the year by late April.
Takeaway? Global stocks were jumpy, but they mostly recovered. By late April, most major indexes were close to where they started the year. South Africa's market was the exception, having a good first quarter that helped it weather the April storm.
⏳ Staying invested beats trying to be a stock Wizard
All this back and forth can make investors nervous. You start thinking, "Should I just sell now before it drops even more?" But history usually says that's the wrong move. Just sticking with it usually works out better than trying to guess the market's next move. BlackRock's iShares recently pointed out that "waiting for the 'right time' to invest might mean missing out on the best days," while staying invested lets you benefit from that "compounding" thing and get through the short-term bumps. Simply put, if you sit on the sidelines during big swings, you often miss the big rebound days. One study even showed that if you missed just the five best market days over 20 years, you'd end up with way less money than someone who just stayed in the market.
The legendary investor Charlie Munger put it simply: "The first rule of compounding: never interrupt it unnecessarily." Trying to jump in and out of the market around all the volatility is super tough – the biggest up days often follow right after the biggest down days. On the other hand, patient investors who just ride out the noise tend to grab more of those long-term gains. After all, with compounding, those small gains build on each other over time.
💰 The awesome power of compounding over time
Compounding basically means the sooner you invest and the longer you stay invested, the more your returns build on each other like a snowball rolling downhill. For example, the total return JSE All-Share index was up almost 23% over the last year. That kind of gain shows how just staying invested during good times can really grow your wealth. If you'd panicked and pulled out, you would have missed most of that growth. Over longer periods, like 5 to 10 years, the JSE has almost always gone up. The big lesson is that it's about "time in the market," not trying to "time the market," that really makes your returns grow and smooths out those bumps along the way.
🌍 What's driving the markets and the economy
There were a few big things happening that explain why the markets moved the way they did.
🇺🇸 US GDP Slowdown: The US economy actually shrank a bit in the first quarter of 2025. A lot of people blamed this on a big surge in imports as businesses bought stuff ahead of those potential President Trump tariffs. Even though this news spooked the stock market briefly in late April, underlying consumer spending was still looking pretty decent.
📈 US Company Profits: On the bright side, US companies reported some pretty strong profits. Analysts were expecting good growth in earnings for the S&P 500 in the first quarter, even with the economic slowdown. And it turned out even better – a lot of companies beat expectations, and overall earnings were up quite a bit from last year. This helped keep stock prices from falling too much during the pullbacks.
🇪🇺 European Spending Boost: In Europe, governments are starting to spend more. Germany, for example, proposed a huge fund for infrastructure and energy. The EU is also loosening its spending rules and increasing defense budgets. Some experts think this could actually boost Europe's economic growth a bit each year, which would mean better profits for European companies. Some even think European companies might see faster profit growth than US companies in the next few years because of this spending.
🇨🇳 Asia and Trade Wars: Asia was the weak spot. China's economy showed some signs of trouble, with a survey suggesting its manufacturing activity might have shrunk in April after a couple of months of growth. This seemed to be a direct result of the US tariffs. Asian stock markets took a hit on the tariff news, which dragged down the overall emerging markets index. Basically, tariffs and trade tensions hurt growth in Asia and its markets, which then affected returns in emerging markets globally.
✅ The bottom line
Early 2025 reminded us that markets can freak out quickly – but they can often bounce back just as fast. The swings felt scary, but history tells us that just sticking with your investments usually pays off. Major stock markets are pretty much where they were a few months ago, while economies and company earnings are still moving forward. For long-term investors, that wild week in April just reinforced an old lesson: stay invested and let compounding do its thing. As some experts say, "get invested and stay invested" because the most volatile times often have the biggest market gains. By sticking to your plan, you avoid missing those big up days when the "fear" fades and markets recover.
_________________________
SP:SPX
Sources: Recent market reports and data including the April SATRIX 2025 market newsletter “Once Again, Volatility Blinked and Fear Lost., nasdaq.com, reuters.com, ishares.com, insight.factset.com, reuters.com, iol.co.za

S&P 500 Bearish Reversal Setup: Short Entry Below Key ResistanceEntry Point: Around 5,678.79
Stop Loss: Around 5,833.61 (above recent resistance zone)
Target Point: Around 4,831.37 (indicating a bearish target)
2. Technical Patterns:
The price hit a resistance zone (highlighted in purple) and reversed—this is often a bearish signal.
The trendline break (marked with the orange dot and blue arrow down) suggests a potential trend reversal.
The moving averages (likely 50 EMA and 200 EMA) indicate the price is still above the support zone but weakening.
3. Risk/Reward Ratio:
Risk (Stop Loss – Entry): ~154.82 points
Reward (Entry – Target): ~847.42 points
Risk/Reward Ratio: Approximately 1:5.5, which is favorable for shorting.
4. Trade Sentiment:
Bearish bias based on the breakdown from the resistance zone and confirmation from chart patterns.
If the price fails to hold above 5,682.87, a short trade may be validated with the target at 4,831.37.

"US500/SPX500" Index Market Money Heist Plan (Day / Swing Trade)🌟Hi! Hola! Ola! Bonjour! Hallo! Marhaba!🌟
Dear Money Makers & Robbers, 🤑💰✈️
Based on 🔥Thief Trading style technical and fundamental analysis🔥, here is our master plan to heist the "US500/SPX500" Index Market. Please adhere to the strategy I've outlined in the chart, which emphasizes short entry. Our aim is the high-risk Pink MA Zone. Risky level, oversold market, consolidation, trend reversal, trap at the level where traders and bullish robbers are stronger. 🏆💸"Take profit and treat yourself, traders. You deserve it!💪🏆🎉
Entry 📈 : "The vault is wide open! Swipe the Bearish loot at any price - the heist is on!
however I advise to Place sell limit orders within a 15 or 30 minute timeframe most nearest or swing, low or high level for Pullback Entries.
Stop Loss 🛑:
📌Thief SL placed at the nearest/swing High or Low level Using the 1D timeframe (5500) Day/Swing trade basis.
📌SL is based on your risk of the trade, lot size and how many multiple orders you have to take.
Target 🎯: 4750 (or) Escape Before the Target
💰💵💸"US500/SPX500" Index Market Heist Plan (Swing/Day Trade) is currently experiencing a Bearish trend.., driven by several key factors.👇👇👇
📰🗞️Get & Read the Fundamental, Macro, COT Report, Geopolitical and News Analysis, Sentimental Outlook, Intermarket Analysis, Index-Specific Analysis, Future trend targets with Overall outlook score... go ahead to check 👉👉👉🔗🔗
⚠️Trading Alert : News Releases and Position Management 📰 🗞️ 🚫🚏
As a reminder, news releases can have a significant impact on market prices and volatility. To minimize potential losses and protect your running positions,
we recommend the following:
Avoid taking new trades during news releases
Use trailing stop-loss orders to protect your running positions and lock in profits
💖Supporting our robbery plan 💥Hit the Boost Button💥 will enable us to effortlessly make and steal money 💰💵. Boost the strength of our robbery team. Every day in this market make money with ease by using the Thief Trading Style.🏆💪🤝❤️🎉🚀
I'll see you soon with another heist plan, so stay tuned 🤑🐱👤🤗🤩

Ideal TGTS =Covid's low @ $28.55/ 2012 Major Trend line @$36.92Two major targets here for PZZA as illustrated on the chart all else absolute !
Major trend line starting from 2012's low and the second one is Covid's low!
Both are legitimate technical reversal points !!!

S&P 500 records 9 days of gains, longest streak in 20 years🚨S&P 500 records 9th consecutive day of gains, the longest winning streak in over 20 years..
🚨
MartyBoots here , I have been trading for 17 years and sharing my thoughts on ETH here.
SP:SPX
Watch video for more details

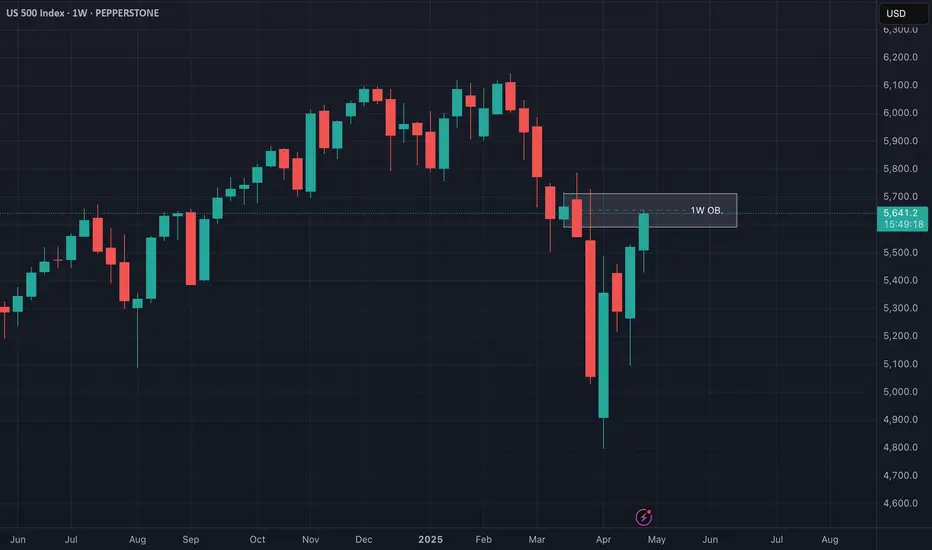
US500 at Critical Resistance - Weekly Chart Breakdown📊 US500 Weekly Chart Analysis
Taking a close look at the US500 on the weekly timeframe, we can see price has now traded directly into a bearish weekly order block 🧱 — a key distribution zone where smart money activity often emerges. At this level, the market is trading at a premium 💰 and appears to be overextended 📈.
⚠️ From a risk management standpoint, I’d advise extreme caution — the current conditions could set the stage for a sharp retracement, especially as we approach week’s end. This level aligns with areas where institutional players may look to offload risk or reverse exposure.
🔁 A potential pullback from here would not be surprising, given the elevated context and technical structure.
📚 This breakdown is for educational purposes only and should not be considered financial advice.