S&P 500 - IMPORTANT BREAKOUT 📈Hello Traders👋🏻
On The Daily Time Frame The S&P 500 Price Broke The Resistance Level (4150.54-4196.30)✔
Currently, The Resistance Level Becomes New Support Level📈
So, I Expect a Bullish Move📈
-----------
TARGET: 4274🎯
___________
if you agreed with this IDEA, please leave a LIKE, SUBSCRIBE or COMMENT!
US SPX 500

SPX500 New Week Possible MovePair : SPX500 Index
Description :
Bullish Channel in Short Time Frame and Long Time Frame as an Corrective Pattern
Break of Structure
RSI - Divergence
SMC - CHOCH
Completed " 12345 " Impulsive Waves
Fibonacci Level - 38.20%
Winning or losing a trade depends on your state of mindHello?
Traders, welcome.
If you "Follow", you can always get new information quickly.
Please also click "Boost".
Have a good day.
-------------------------------------
(DXY chart)
The 102.034-105.873 section is a volatility section, and depending on which direction you deviate from this section, the movement of the investment market is expected to change.
Therefore, if it falls below 102.034, the investment market is expected to revitalize.
Otherwise, if it rises above 105.873, the investment market is likely to enter a recession.
Where do you think DXY is heading right now?
My thoughts are that I don't know the direction yet, but I think it's right.
I believe that investment and trading are determined to fail even before investing or trading according to one's psychological state.
The moment you invest or trade with a nervous mind or excitement, you will suffer from more psychological conflicts, so there is a high possibility that you will not get a big return or the transaction will fail in the end.
So, if your mind is currently in a state of nervousness, anxiety, excitement, etc., you should stop trading and observe the situation.
----------------------------------------------
(SPX500USD chart)
Looking at the 1D chart, it shows a rise to the resistance area of 4255.2-4310.8.
Therefore, the key is whether or not you can ascend with support in this section.
Looking at the 1M chart, the HA-High indicator on the 1M chart is long at 4419.8.
Therefore, it is necessary to check whether it is supported in the 4310.8-4588.6 section.
"So, what are you going to do?" you may ask.
You yourself already know the answer.
As I said in the description of the DXY chart, you have already made your own conclusions.
However, it is only a state in which it has not been decided whether to proceed with the current transaction or to wait according to the decision.
why? I would like you to think about whether you wrote down the 4255.2-4310.8 section as a resistance section.
The biggest reason I said it was a resistance zone is because I think that if it rises above this zone, it is highly likely to surge.
The reason why it is likely to surge is because it touched this section in August 2022, the previous high, and showed a decline.
Therefore, if it rises above this range, it is highly likely that you will proceed with the purchase without checking whether it is supported.
(1D chart)
(1W chart)
(1M chart)
Therefore, when looking at charts, you should look at the 1M chart first, then the 1W chart, then the 1D chart, not the 1D chart and then the 1M chart.
That way, you will be able to hold the overall picture of the chart in your mind, which will help you prevent your psychology from being shaken by small waves.
However, most of them don't do that, and by looking at the time frame chart they are trading first, their psychological state is agitated by small fluctuations even before making a trading strategy, so there is a high possibility of making a trading strategy in the wrong direction.
So, regardless of your investment style, that is, the investment period, you are shaken by small fluctuations, so you are sensitive to the current movement even though it is a mid- to long-term investment.
In the case of day tradng or short-term trading, there is no need to see a big trend.
If you plan to conduct day trading or short-term trading, but create a trading strategy based on the big trend, there is a possibility that you may not be able to stop loss when you should stop or sell when you need to split.
This is the cause of fatal mistakes when conducting day trading or short-term trading.
Therefore, you should create a trading strategy based on your own investment style, i.e. a time frame chart that fits your investment period.
-------------------------------------------------- ------------------
(NAS100USD chart)
It is approaching the 14710.6-15090.3 area, an important support and resistance zone.
Therefore, the key is whether you can ascend to this section and be supported.
Looking at the 1M chart, you can see why the 14710.6-15090.3 area is an important support and resistance zone.
As you approach what I'm talking about as this important segment, those waiting to trade are likely to be in a very excited state.
Because, once it rises above this important range, you start to think that you can get a bigger return by buying it at a lower price because you think it's likely to show a big uptrend.
Therefore, there may be cases in which you proceed to buy before you can confirm whether you are supported or resisted by rising to the important zone, that is, the support and resistance zone.
It is tedious to check whether you are supported or resisted, and since psychological agitation occurs hundreds of times a day, your psychological burden will increase enormously.
This increase in psychological burden makes it impossible to wait until it rises, which is the main cause of not obtaining large profits or increasing losses.
Therefore, you must check whether you are supported or resisted by entering the important section where you must check the support and resistance section.
Even if you buy at a higher price, if your psychological state is stable, you can get a bigger profit when you see a big rise.
-------------------------------------------------- -------------------------------------------
** All descriptions are for reference only and do not guarantee profit or loss in investment.
** Even if you know other people's know-how, it takes a considerable period of time to make it your own.
** This is a chart created with my know-how.
---------------------------------

SPX500USD Is Going Down! Sell!
Take a look at our analysis for SPX500USD.
Time Frame: 1D
Current Trend: Bearish
Sentiment: Overbought (based on 7-period RSI)
Forecast: Bearish
The market is approaching a significant resistance area 4282.7.
The above observations make me that the market will inevitably achieve 4181.5 level.
P.S
The term oversold refers to a condition where an asset has traded lower in price and has the potential for a price bounce.
Overbought refers to market scenarios where the instrument is traded considerably higher than its fair value. Overvaluation is caused by market sentiments when there is positive news.
Like and subscribe and comment my ideas if you enjoy them!

Ignore the noise follow the data.There is so much fear in the market right now, in the past I presented a few bullish analysis showing that we may have bottomed and a bullish megaphone pattern. In this idea, I am presenting data that goes back all the way to 1964 which tells us that the trend is up.
looking at the 6month chart we can see that from 1964-1974 we had a side ways action (lost decade). Once we broke that the market went on a meteoric rise before we got rejected at the 4.618 Fibonacci but ended up rallying to the 23.1618. We then had another sideways actions from 1999 to 2009 (another lost decade) before we got rejected at the 4.618 again while the candles are very similar. Its fascinating how history can repeat it self.
So to summarize from 1964-1974 we had a 23.1618 that led to the 1999-2009 lost decade. Since 2009 we are in another extension and like the last extension we are being stopped at the 4.618 extension. While there are so many narratives out there, the data does not lie and seems to point that we are only repeating history. Will we continue to the 23.1618? I believe we will.
Note: the 1964-1974 and 1999-2009 where both bullish megaphone pattern.
Please like this post if you find this research helpful as it take a lot of time to put together.
Please do your DD as this is not a financial advice.

ES/SPX500 Drop offLooking for a drop off to occur in the market soon.
Seasonality wise speaking June tends to be negative. Thus, I would like to see a drop in the next couple of weeks.
There is the August high which looks tempting as a DOL and there is a FVG left back in April 2022. I will watch price when we engage in both of those levels and will see how price reacts, if correct price action is seen for the bears to take over, I will short.
The targets are also outlined, and once reached, will re-evaluate the scenario to see if we get further downside.

Unemployment in the U.S. and 13 states to watch out forWith the unemployment data being scheduled for release today, we would like to focus on this topic. Previously, we stated that historically, each 1% rise in unemployment within the United States was accompanied by a recession. Therefore, today, we want to highlight a few interesting trends in unemployment with regard to specific states rather than a whole country. Below, we list 13 states that stood out to us and which might be worth to be paying attention to (in the remaining 37 states, unemployment was either still declining or not showing any significant growth in the past year, although that does not mean that they are less worthy of watching out for).
Unemployment trends in particular states:
- District of Columbia - up from 3.9% in August 2022 to 5% in April 2023 (+1.1% increase).
- Oregon - This state saw unemployment rise from 3.5% in March 2022 to 4.8% in October 2022. Then the unemployment rate stayed unchanged until February 2023, when it started to tick down. In April 2023, the unemployment in Oregon stood at 4%.
- Kentucky - Unemployment in Kentucky rose from 3.3% in December 2022 to 4.6% in February 2023. Then, it quickly declined in the following two months, printing 3.2% in April 2023. Though, we would like to emphasize that changes in the unemployment rate in Kentucky are historically volatile, at least based on the FRED’s data.
- Wyoming - The unemployment rate was 3.2% in April 2022 and rose to 3.9% in October 2022. Then similarly, like in Kentucky, it stayed unchanged until February 2023. After that, the rate started to decline, reaching 3.5% in April 2023.
- New Jersey - In New Jersey, the unemployment rate stood at 2.8% in September 2022. In February 2023, this figure rose to 4.1% and then started to decline. In April 2023, unemployment was down to 3%.
- Virginia - The unemployment in Virginia was 2.5% in June 2022. In November 2022, it rose to 3.2%. Since then, the unemployment rate in the state remained between 3.1% and 3.2%.
- Kansas - In Kansas, unemployment rose from 2.4% in April 2022 to 3% in November 2022. After that, it continued to print 2.9% in the next five months.
- Minnesota - The unemployment in Minnesota rose from 2.3% in April 2022 to 3% in November 2023. In April 2022, it came in at 2.8%.
- Iowa - At the start of the second quarter of 2022, Iowa's unemployment rate was 2.3%. In September 2022, it reached 3.1%; later, in December 2022, it started declining. Unemployment in Iowa reached 2.7% at the start of the second quarter of 2023.
- Missouri - In June 2022, the unemployment rate in Missouri was trending at 2.1%. Then, in October 2022, it reached 2.7%, where it held until February 2023. In April 2023, this figure came in at 2.5%.
- Vermont - In Vermont, unemployment rose by 0.9% between April 2022 and October 2022. However, after that, it started to fall, hitting 2.4% in April 2023.
- New Hampshire - In April 2022, the unemployment rate in New Hampshire equaled 2.1%. In October 2022, it was already at 2.9%. However, it started to fall in January 2023 and erased the whole rise in April 2023.
- Nebraska - In April 2022, unemployment stood at 2% in Nebraska. After that, it started to rise, reaching 2.7% in December 2022. Despite this uptick, unemployment quickly fell to 2% by the end of April 2023.
Please feel free to express your ideas and thoughts in the comment section.
DISCLAIMER: This analysis is not intended to encourage any buying or selling of any particular securities. Furthermore, it should not be a basis for taking any trade action by an individual investor. Therefore, your own due diligence is highly advised before entering a trade.

US500 to find support at next Fibonacci retracement?US500 - Intraday - We look to Buy at 4155 (stop at 4135)
Levels close to the 50% pullback level of 4170 found buyers.
A Fibonacci confluence area is located at 4164.
Bespoke support is located at 4150.
There is scope for mild selling at the open but losses should be limited.
Although the anticipated move higher is corrective, it does offer ample risk/reward today.
Our profit targets will be 4205 and 4215
Resistance: 4220 / 4230 / 4235
Support: 4168 / 4164 / 4120
Risk Disclaimer
The trade ideas beyond this page are for informational purposes only and do not constitute investment advice or a solicitation to trade. This information is provided by Signal Centre, a third-party unaffiliated with OANDA, and is intended for general circulation only. OANDA does not guarantee the accuracy of this information and assumes no responsibilities for the information provided by the third party. The information does not take into account the specific investment objectives, financial situation, or particular needs of any particular person. You should take into account your specific investment objectives, financial situation, and particular needs before making a commitment to trade, including seeking advice from an independent financial adviser regarding the suitability of the investment, under a separate engagement, as you deem fit.
You accept that you assume all risks in independently viewing the contents and selecting a chosen strategy.
Where the research is distributed in Singapore to a person who is not an Accredited Investor, Expert Investor or an Institutional Investor, Oanda Asia Pacific Pte Ltd (“OAP“) accepts legal responsibility for the contents of the report to such persons only to the extent required by law. Singapore customers should contact OAP at 6579 8289 for matters arising from, or in connection with, the information/research distributed.

ESM 2023 LONG + ANALYSISFor ES :
we have OB in weekly TF (4189.50) so we want to see it like a support, and we have relative equal highs in (4247.75) we want to see it a target for the week
In the daily TF we have a balance price range (BPR) from (4186.50-4175.75) , and we've drop to 50% of the daily range (4178.25) .
note: weekly and daily we have a bullish bias
In the H4 market has dropped to BISI (4181.75-4162.75) , and also in H1 has dropped to FVG (4182.00-4173.75).
note: H4, H1, also bullish.
Now my first target is 50% of the range 4208.00 then:
4214.25
4218.50
4232.00

💥 S&P 500 INDEX SPX 1D-TIMEFRAME💥 S&P 500 INDEX SPX 1D-TIMEFRAME ANALYSIS
💗Hello ladies and gentlemen
This is my new idea for 💥💥 S&P 500 INDEX SPX
I hope my idea is clear
Support me by like and share thank you
Stay Safe💯💲💲💲
Good luck💰😍

💥SPX 4H-TIMEFRAME ANALYSIS💥 S&P 500 INDEX SPX 4H-TIMEFRAME ANALYSIS
💗Hello ladies and gentlemen
This is my new idea for 💥S&P 500 INDEX
I hope my idea is clear
Support me by like and share thank you
Stay Safe💯💲💲💲
Good luck💰😍

SPX500USD: Short Trading Opportunity
SPX500USD
- Classic bearish setup
- Our team expects bearish continuation
SUGGESTED TRADE:
Swing Trade
Sell SPX500USD
Entry Level - 4212.9
Stop Loss - 4232.0
Take Profit - 4184.1
Our Risk - 1%
❤️ Please, support our work with like & comment! ❤️

SPX500USD Will Move Higher! Buy!
Here is our detailed technical review for SPX500USD.
Time Frame: 9h
Current Trend: Bullish
Sentiment: Oversold (based on 7-period RSI)
Forecast: Bullish
The market is approaching a key horizontal level 4229.3.
Considering the today's price action, probabilities will be high to see a movement to 4282.5.
P.S
We determine oversold/overbought condition with RSI indicator.
When it drops below 30 - the market is considered to be oversold.
When it bounces above 70 - the market is considered to be overbought.
Like and subscribe and comment my ideas if you enjoy them!

A Breakthrough with Fuzzy Spaces and Random Matrix TheoriesIn the field of financial markets, the accurate prediction of price movements has always been a coveted goal. Traditional methods relied on statistical analysis, technical indicators and mathematical distribution models. However, Blackrock's top-secret follow-on research project Alladin has recently made a breakthrough by harnessing the power of Fuzzy Scalar Field Theories (FSFT) and Relaxed Matrix Models (RMM) in conjunction with artificial intelligence. This groundbreaking approach aims to revolutionize the prediction of price movements by incorporating the principles of Fuzzy Spaces and Random Matrix Theory.
In a groundbreaking development that has been shrouded in secrecy, a clandestine group of financial experts claims to have unlocked the secrets of price action prediction using a cutting-edge approach involving Fuzzy Scalar Field Theories and Relaxed Matrix Models. This breakthrough method has reportedly been experimented with and validated, providing remarkable results in forecasting financial market movements. It has been reported that multi-million dollar profits have actually been made in the financial markets.
Drawing inspiration from the enigmatic realms of theoretical physics, the team behind this revolutionary discovery has leveraged the principles of scalar field theories on fuzzy spaces. By analyzing the increments in financial prices and modeling price variations through these innovative theories, they have attained a previously unimaginable level of accuracy in price action forecasting.
To understand the foundation of this approach, it is important to recall the fundamental concepts of random matrix theory and the construction of fuzzy spaces. These theories serve as the backbone for the formulation of scalar field theories on fuzzy spaces, which are at the core of this groundbreaking methodology. By summarizing the key findings related to scalar fields on fuzzy spaces, the researchers have laid the groundwork for their extraordinary breakthrough.
Furthermore, the team has introduced multi-trace matrix models that play a crucial role in providing an analytical description of scalar field theories on fuzzy spaces. These models have exhibited a remarkable capacity to capture the intricate phase structure of f4 theory on the fuzzy sphere. This means that the approach not only offers theoretical insights but also aligns with empirical observations, further bolstering its credibility.
While the specifics of this secretive research group remain undisclosed, whispers of its involvement with BlackRock's Alladin follow-on research project have begun to circulate. The combination of these powerful financial minds with the knowledge gained from Fuzzy Scalar Field Theories and Relaxed Matrix Models could potentially revolutionize the world of trading as we know it.
Additionally, there are murmurs of a connection to the legendary Medallion Fund, managed by Renaissance Technologies and founded by the enigmatic Jim Simons. The Medallion Fund's consistent success has long been a subject of fascination in the financial world, and it is believed that Simons himself might have delved into similar esoteric methodologies for generating astounding returns.
While the true extent of the breakthrough remains veiled in secrecy, the implications are profound. If the experimental validation of using Fuzzy Scalar Field Theories for price action forecasting holds true, it could redefine the field of trading and investment strategies. The ability to forecast market movements with greater accuracy and precision would grant traders and investors a significant advantage in capitalizing on financial opportunities.
As the mystique surrounding this revolutionary discovery continues to capture the imagination of financial professionals, the implications for the future of trading and investment strategies remain uncertain. The true potential of Fuzzy Scalar Field Theories and Relaxed Matrix Models may be unfolding behind closed doors, where the highest level of secrecy guards these groundbreaking findings.

SPX clear breakout targets 4400-4500Hello, everyone.
My previous idea a week ago had a bearish outlook on SPX.
However things have changed, as we now have a clearly defined outbreak in the RSI.
The target range now is 4400-4500.
Depending on how the market opens on Tuesday. I may open long position.
Good luck everyone.
Stay safe, stay liquid.

The meaning of DXY raised to the boundary section is...Hello?
Traders, welcome.
If you "Follow", you can always get new information quickly.
Please also click "Boost".
Have a good day.
-------------------------------------
(DXY chart)
The investment market is showing a correction as DXY rises above 103.494.
The 102.034-103.494 and 104.738-105.873 sections marked on the 1D chart are boundary sections, and it is expected that the investment market will also move in the direction of departure from this section.
When DXY rises, it means that the investment market is likely to gradually enter a downturn.
The term investment market here refers to a market other than a business that generates profits through actual production. (Stocks, cryptocurrency, real estate, etc.)
------------------------------------------
(SPX500USD chart)
The key is whether it can continue its upward trend along the upward trend line drawn on the 1M chart.
Therefore, it is necessary to check whether it can rise above 4310.8.
If not, you should check if it is supported or resisted around the 4104.9-4137.1 mark on the 1D chart.
-------------------------------------------------- -
(NAS100USD chart)
The rise above the HA-Low indicator on the 1M chart suggests that we are entering a long-term buying season.
The first sell zone for this flow is around 14710.6.
Since it broke above the 12896.2-13418.8, the volume profile of the 1W chart, an uptrend is expected around 14117.5.
If it fails to move up, you should check for support around the 13231.6-13480.9 area marked on the 1D chart.
-------------------------------------------------- -------------------------------------------
** All descriptions are for reference only and do not guarantee profit or loss in investment.
** Even if you know other people's know-how, it takes a considerable period of time to make it your own.
** This is a chart created with my know-how.
---------------------------------

Spx 🌊Salutations,
At this present moment, I find it challenging to elucidate the precise reasoning as to why the S&P 500 was poised to recede back to the melancholy depths of the pandemic lows.
Nevertheless, I can confidently postulate the resurgence of a risk-on environment in the aftermath.
ideally as we approach the yuletide chill of Christmas Eve at the conclusion of this present year,
I cast my net at $2,100 as the absolute nadir of this grizzly mark-down-phase.
---
Upon a successful breach of this strategic area,
I am further prophesizing a subsequent phoenix-like rise,
elevating us to a commanding $7,777 threshold as we stride valiantly into the year 2030 through a vortex of an ending diagonal.
---
2024 - $2,111
2030 - $7,777
2035 - $12,222
☿

ES1! - SPX - Could be Bullish Flip!CME_MINI:ES1!
CME_MINI:ES1! has broken resistance as Wall Street continues to monitor the situation surrounding the debt ceiling with hopes of a deal being reached.
This breakout needs to hold via a retest or Bullish pullback for Stocks upside.
If it's a fake out, look for potential shorts via LTF e.g. 4h
CRYPTOCAP:BTC is like a tech stock and when it's coupled to the ES1! it moves with.
Always having Plan A and Plan B scenarios so we can react once the markets provide an opportunity to execute our edge.
If you liked this idea or if you have your own opinion about it, write in the comments.
The information and publications are not meant to be, and do not constitute, financial, investment, trading, or other types of advice or recommendations.

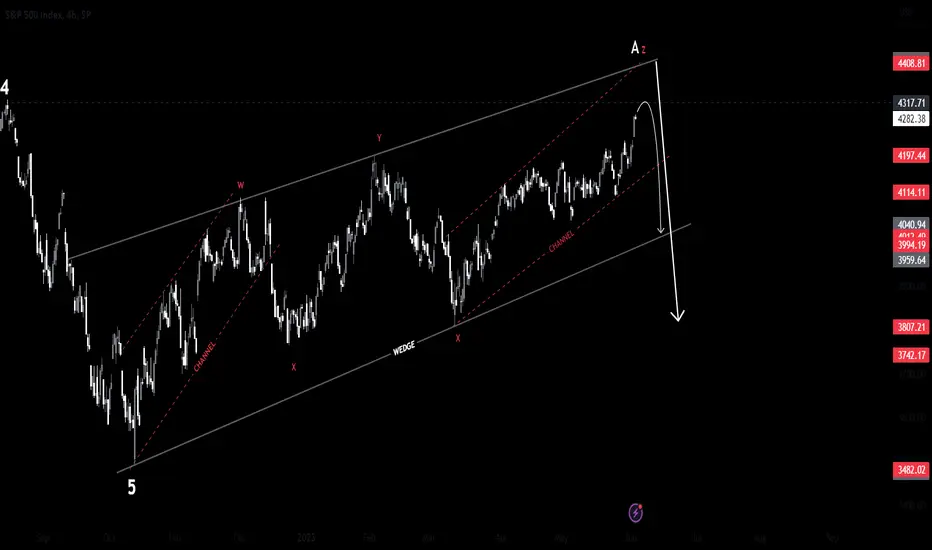
SPX500 Index Next MovePair : S&P 500 Index
Description :
Impulse Correction
Completed " 12345 " Impulsive and " abc " Corrective Wave
Divergence
Break of Structure
Falling Wedge
Consolidation
Bullish Channel in Long Time Frame as an Correction

Big Short On SPX500 According to the US30 analysis, the price of spx500 can also have a down trend in the long term

S&p500 Golden Swing Opportunity We are in a very crucial zone in terms of time and price on Sp500 right now and people who make the right decisions will make money.
But to make the right decisions you must look at the data and filter out all the noise and be patient.
I have presented my case for incoming selloff a few times before and now it's all coming together. I have provided the links to my previous posts below, please go over them to get the full picture.
I am building shorts in 4185 to 4230 Area and there are several reasons for that.
Technical Reasons:
1. On the chart I have a large parallel channel. Currently the price is hovering
near the top edge of the channel. This itself is a reason to look for shorts here.
2. Chart also has an indicator which shows 9 count sell signals as per TD sequential
method. Notice what happened last time when the price was near the top of the channel.
We got two consecutive nine count sell signals and as soon as price hit the top of the
channel multi month sell off began. We have something remarkably similar going on right
now.
3. Last time when we were near the top of the channel, we had bear divs on RSI and Money
flow, we have them now as well.
4. We have harmonics ratios providing heavy resistance from 4214 region and upwards.
5. Another thing to notice is 4300 is 61.8 retracement level of the move from the top, That's
another reason to build shorts here, one should not wait for 4300 to be hit to build short, as
its absolute top and may not get hit due to other factors I mentioned above.
If we begin the selloff in the coming weeks, we are looking at a possible 30% drop from current levels, in the next 3 to 4 months. I have provided these targets and measures based on past price action from top of the channel to the bottom, this of course is not going to be 100% accurate can change based on future market moving events.
We also have below confluences for targets motioned in the chart above: June 14th We have Fed event, and SPX has been moving in the highlighted disjoint channel for a while so if we intersect 14th June with the channel we get the max upside and downside targets.
Fundamental reasons:
1. The Fed's actions to raise interest rates are likely to slow the economy, which will lead to a recession. The Fed has said repeatedly they will continue to raise rates to bring down inflation to the target goal of 2% which is not yet achieved so no rate pauses as institutions and new media like people to believe.
2. Debt Ceiling battle: With no resolution in sight, the uncertainties surrounding this event could be the trigger to start the selloff although I am not discounting the possibility of a manipulative rally to 4300 which is a fantastic opportunity to build shorts.
2.1 If there is no resolution on this topic and US defaults everyone knows what will happen
, so, until that is resolved all the contrarian traders should be extremely cautious.
If you like my content, then please boost, and share this post. I have over 6 years of trading and investing experience and have learned a lot in this time. I like to share what I have learned. If you would like to learn from my experience then follow me on trading view to get notified on my trade, market projections and several upcoming technical analysis and in-depth tutorials on technical Indicators. You can also leave a comment and let me know if you want me to look at any specific asset or want to learn about any specific topic in the world of Technical Analysis. I Will do my best to create a post for it.
Keep learning and Happy trading All.

The S&P 500 Death BedIn this analysis, we explore the potential consequences of a US debt ceiling default on the S&P 500, one of the most widely followed stock market indices. We believe that if the debt ceiling issue remains unresolved, we could witness a significant downside in the S&P 500, comparable to the crisis experienced in the US economy in 2008. Our analysis suggests a selling zone between 4,154.77 and 4,290.49, with an initial target of 3,090.41 and a final target of 2,034.79.
1. The US Debt Ceiling Crisis:
The US debt ceiling refers to the limit on the amount of debt the US government can incur. Failure to raise the debt ceiling can lead to a default, causing significant disruptions in financial markets and a potential decline in investor confidence.
2. Historical Parallels:
Drawing parallels to the 2008 financial crisis, which triggered a major downturn in the US economy, we anticipate a similar scenario if the debt ceiling issue remains unresolved. Such a crisis could have a substantial impact on the S&P 500, potentially leading to a significant downside movement.
3. Selling Zone and Potential Targets:
Our analysis identifies a selling zone between 4,154.77 and 4,290.49. This range represents a critical area of resistance and selling pressure for the S&P 500. Traders should pay close attention to price action within this zone as it could provide valuable insights into market sentiment.
Regarding potential targets, we project an initial target of 3,090.41. This level represents a significant decline from current market levels and aligns with historical support levels. Our final target is set at 2,034.79, signifying a more substantial downturn in the event of an extended debt ceiling crisis.
4. Impact of Debt Ceiling Default:
A debt ceiling default scenario could result in a loss of investor confidence, increased market volatility, and a potential flight to safe-haven assets. These factors, coupled with concerns about the US economy, could significantly impact the S&P 500 and contribute to a potential deathbed scenario.
While it is important to note that this analysis is based on the assumption of a debt ceiling default, traders and investors should remain vigilant about the potential risks associated with such a scenario. The S&P 500 death bed analysis suggests a selling zone between 4,154.77 and 4,290.49, with initial and final targets at 3,090.41 and 2,034.79, respectively. Traders are advised to exercise caution, implement appropriate risk management strategies, and closely monitor market developments to navigate potential challenges and capitalize on opportunities.
Disclaimer: This analysis is for informational purposes only and should not be considered financial advice. Trading involves risks, and traders should conduct their research and analysis before making any investment decisions.

S&P 500 Futures Record Modest Gains, Reaching Highest Since Aug.S&P 500 Futures are displaying slight upward movements, reaching their highest levels since August. Market participants are closely monitoring two key factors: the upcoming speech by Federal Reserve Chairman Jerome Powell and the ongoing negotiations surrounding the US debt ceiling. Traders are particularly focused on these developments as US President Joe Biden is reported to have a decision deadline to avert a default by Sunday.
Amidst this backdrop, our analysis indicates the potential for a bullish impulse in the short-term timeframe.
