SPX500USD Will Go Up From Support! Long!
Take a look at our analysis for SPX500USD.
Time Frame: 8h
Current Trend: Bullish
Sentiment: Oversold (based on 7-period RSI)
Forecast: Bullish
The market is approaching a significant support area 4170.8.
The above observations make me that the market will inevitably achieve 4234.1 level.
P.S
We determine overbought condition with RSI indicator.
When it drops below 30 - the market is considered to be oversold.
When it bounces above 70 - the market is considered to be overbought.
Like and subscribe and comment my ideas if you enjoy them!
US SPX 500

Why is it so difficult to accept? $SPXThere is not much to say here.
Classic Elliot chart porn identifying the end of intermediate bear corrective wave and the beginning of new bear expansion wave.

S&P500 - Bearish MACD cross!Upon examination, it is evident that each instance of a bearish MACD cross above the zero line has resulted in a subsequent downward movement. Moreover, S&P is exhibiting a head and shoulders (H&S) pattern while facing significant resistance. The prevailing market sentiment leans towards a bearish outlook, suggesting the possibility of a downward trend in the near future.

4-27-23 [spx]gm gm,
quick update to the local trajectory on the spx500.
after invalidating the 5th leg up locally (via my last post),
it becomes abundantly clear to me, that all of these moves - are in fact 3 wave moves.
being this corrective by nature, i can now conclude my entire theory by saying this is in fact a massive B wave,
and spx will undergo a significant break down once wave b has been completed (quite possible sub-covid-low).
---
no downside targets at this time,
but i got you whenever i see it.
---
>keep in mind, these posts are very general, and you should consistently be doing your own dd, and analysis on the ever-changing market structures.
✌

4-25-23 [spx]good afternoon anon,
are you feeling bearish all of a sudden?
it's okay, that's natural.
---
spx looks to be in a local 4th wave right now -
4073.75 is the hard invalidation on this local wave.
if it is breached, the upside move is invalidated and bears take full control over the next 2 weeks.
---
>if the bulls are succesful in this local setup,
>i am estimating a move up to 4250 into this friday where i believe pce comes in hot,
>and sends the market tumbling down into the dungeons.
---
nfa, do your own research and dd.

Significance of the 12896.2-13231.6 sectionHello?
Traders, welcome.
If you "Follow", you can always get new information quickly.
Please also click "Boost".
Have a good day.
-------------------------------------
(NAS100USD chart)
Looking at the 1W chart, the 4th week showed sideways movement in the range of 12896.2-13418.8.
The key is whether this week, the fifth week, can continue sideways.
If not, you need to make sure it is supported on the 12716.0-12896.2 range, which is the 1st segment indicated on the 1D chart.
Looking at the 1M chart, the HA-Low indicator is formed at 13480.9.
Therefore, it needs to rise above 13480.9 to continue the uptrend on a long-term basis.
Looking at the 1W chart, the HA-High indicator is formed at 12497.5.
Therefore, it can be seen that it is maintaining an upward trend from a mid- to long-term perspective.
Looking at the 1D chart, the HA-High indicator is formed at 12946.5.
So, if it finds support around 12946.5, it is expected to rise above 13231.6.
If you fall below the HA-High indicator and receive resistance, you should basically think of falling around the HA-Low indicator and think about countermeasures.
----------------------------------------------
(SPX500USD chart)
The key is whether it can be supported around 4116.0-4123.5 and rise above 4169.6.
If not, you need to make sure it is supported around 4045.2.
Looking at the 1W chart, point 4116.0 is the section where the volume profile section is formed.
Therefore, being supported in the 4116.0-4169.6 section means that you can create a new wave.
However, it means that the resistance is strong, so it is good to check the upward breakout.
----------------------------------------------
(DXY chart)
- It broke out of the rising channel of the 1M chart.
- The key is whether it can fall along the 1W chart's downtrend channel.
- The key is whether it can fall below 101.494 on the 1D chart.
In order for the investment market to be active, I think it should show sideways in the 98.244-101.494 section.
-------------------------------------------------- -------------------------------------------
** All descriptions are for reference only and do not guarantee profit or loss in investment.
** Even if you know other people's know-how, it takes a considerable period of time to make it your own.
** This is a chart created with my know-how.
---------------------------------

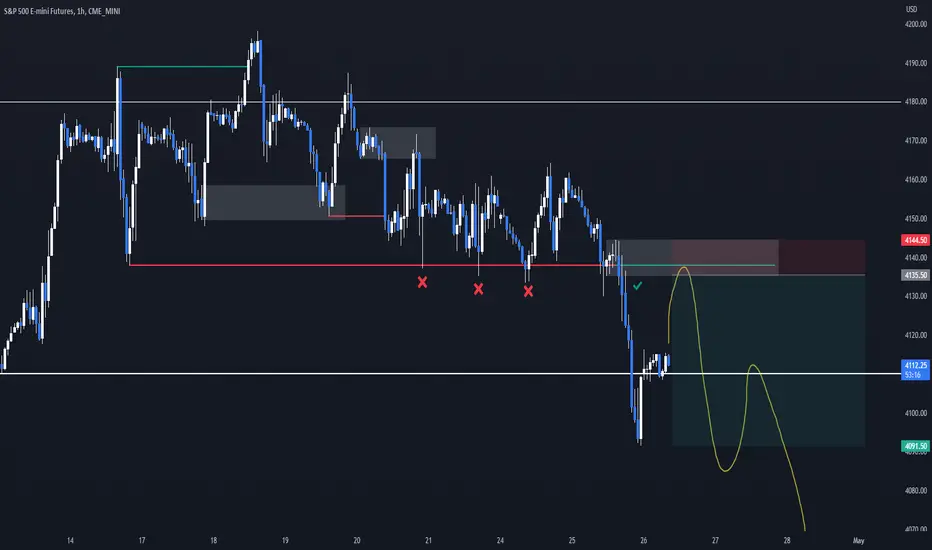
S&P500 short limit at 4135.5Intraday trading idea with 4.8R on the table.
Supply and demand pockets followed with impulsive inefficient moves have been reliable on ES.
Closest pocket of supply that broke higher timeframe market structure is around tested Support-turn-Resistance line.
I am expecting the price to retrace to the 4135-4145 area and then continue downwards.
Entry: 4135.5
Stop: Top of the supply zone 4144.5
Target: 4091.5
4.89R trade
Looser Stop loss at 4150 still gives 3R trade. Depending on the market conditions, but I will most likely play this as soft and hard stop loss, adding into position after confirmation of the validity of the setup.
Setup is invalid if we just continue downwards - and break the low of 4091.5.
PX500 - goes to test the global trend line!Hello trader Today I have prepared a new idea for you. Like and subscribe to the channel there is a lot of useful information✅
Technical - the stock market may test the global trend line, at the moment it acts as support for the SPX500. Usually such tests are met with squeezes and after that the price returns again to test the support, can we bounce back to the 4150 points zone again, technically everything looks like this, let's see where this correction will lead.
Fundamentally - there are rumors that the correction in the stock market began due to the problems of one of the FIRST REPUBLIC BANK banks, which may go bankrupt soon, the bank's shares have already fallen by -40%, another bank in the Fed's piggy bank, the printing press is probably already refueling with ink))

SPX - ABC. Allowing Bank Capitulations? 25/02/23We could be setting up for a classic deep ABC pattern here. Since my last post of a WXY count, it seems that we instead finished a 5 count as previously shown:
Since previous low, price has formed a convincing ABC correction to where we sit now. No move down is technically confirmed just yet but there's certainly an increasing probability day by day that this count can come to fruition.
Let us not forget what happened in 2008:
There's also the hot topic of inflation rebounding. Did the FED ease off the pedal too quickly? Maybe. Just Maybe.
This is not financial advice and always DYOR .

CHOCH!1. Is seems like a CHoCH has already happened! And it will go lower from here!
If that happened, and we didn’t catch entry! Wait for ritracements or BOS
2. Or might visit the Hight before going lower! Which I would love it will happen next week!

415 calls will print go out 1+ month if you got the coinbasing inside a multi layered inverse head and shoulders pattern, a retest of 415 will give breakout to the 4hr cup/handle pattern

SPX is overvalued and risk while DAX outperformsThe SPX or the S&P 500 appears to be overvalued according to this critical red line in the Fibonacci levels, Fibonacci. With potentially deteriorating market conditions, many have left the stock markets globally to park their money .in safer assets like money markets. Most investors are getting better performance because of higher interest rates than taking risks in the stock market. I have lost all confidence in trading in the stock market currently due to higher volatile pricing action. Is there a significant calamity on the way? There are better-producing stock markets internationally out there, including Germany.

Whether the investment market is active or not is a DXY chart...Hello?
Traders, welcome.
If you "Follow", you can always get new information quickly.
Please also click "Boost".
Have a good day.
** Analysis of the BTC chart publishes new ideas once a week.
** However, we publish new ideas when volatility occurs or when we show signs of diverging from our expectations.
** Excluding the above situation, BTC analysis is listed as a daily update.
-------------------------------------
(NAS100USD chart)
The key is whether it can rise above the volume profile section of 12896.2-13231.6.
(1D chart)
Therefore, it is necessary to check whether it can rise to the 13231.6-13480.9 section and be supported.
-----------------------------------------------
(SPX500USD chart)
The key is whether it can rise above the volume profile section of 4116.0-4169.6 and continue its rise along the rising channel.
(1D chart)
-------------------------------------------
(DXY chart)
Looking at the 1M chart, it shows a breakout from the uptrend channel.
Accordingly, the key is whether it will form a new trend.
In my opinion, for the investment market to pick up steam, DXY needs to show sideways decline below 101.494.
-------------------------------------------------- -------------------------------------------
** All descriptions are for reference only and do not guarantee profit or loss in investment.
** Even if you know other people's know-how, it takes a considerable period of time to make it your own.
** This is a chart created with my know-how.
---------------------------------

4-19-23 [spy]good afternoon,
been playing around with many variations of this count over these last few days, and i really like this one.
we call these "sharp double zig-zags" in my world, and they are designed for the sole purpose of squeezing out all the bears out of the bear market.
i have theorized for awhile that the spx would end up going back near ath before the next major leg down - and this is precisely how i think that happens.
-
Wave B target = HKEX:464
✌

Bearish Harmonic pattern in SPXSPX price chart has printed a bearish harmonic pattern along with a bearish divergence on RSI which indicates trend may reverse from bullish to bearish if the support level of 4060 is broken.

SPX500 Next Possible MovePair : S & P 500 Index
Description :
Bullish Channel as an Corrective Pattern in Long Time Frame and Rejection from the Upper Trend Line
Break of Structure
Completed " 1234 " Impulsive / " AB " Corrective Wave
Divergence
Impulse Correction Impulse
Rising Wedge as an Corrective Pattern in Short Time Frame

SPX 500 Futures: Analyzing Price Movements and Predicting TrendsAs a trader, keeping an eye on market trends and understanding how to interpret them is crucial to making informed decisions. In this article, I'll explore the price movements of the S&P 500 (SPX) futures since the beginning of February 2023. Whether you're a beginner or an intermediate trader, this analysis will provide insights into the market's behavior and hopefully help you make better decisions for your portfolio.
The Roller Coaster Ride: February to March 2023
At the beginning of February 2023, the ES futures hit a high near 4200, marking the start of a steep decline. The descent was impulsive, and prices dropped to almost 3800, stopping short by about 30 points. There are two ways to interpret the downward movement: either as a 5-wave structure or a 3-wave structure. The choppiness and overlap of the moves make it difficult to determine the exact structure, but one thing is clear: a significant bottom was reached around March 13, 2023, the same date as the bottom in 2020 .
The Rebound and the Big Question
Since that bottom, the ES futures have rebounded, practically returning to their starting point at 4200. Now, we face a critical question: what happens next? From a trading standpoint, it appears that we're in a rising wedge , forming an ending diagonal with multiple 3-wave structures. If the lower trendline is breached, the market could be on its way to testing 4000, or even lower . However, if the upper trendline is broken and the market surpasses 4200, a slow grind up to 4300-4500 is possible, although I'd give it a 20% chance at this point.
Key Trendlines and Moving Averages
Beneath the current market level, two significant trendlines exist . The first, originating from the October lows, sits around 3925 , while the second, from the COVID-19 lows, hovers around 3775 . Interestingly, the latter trendline coincides with the 200-week simple moving average .
Making Bets: Bull or Bear?
Regardless of whether you're bullish or bearish, it's evident that the market is in a compressing wedge , which will eventually break in one direction or the other. The decision you need to make is whether to place your bets now or wait for a break to occur. It's worth noting that while the market has risen significantly, it could fall just as quickly. Conversely, after a challenging 2022 for investors, the market could continue to rise. The key to longer-term upside potential lies in the VIX, which needs to stay below 20 for the slow grind rise .
By examining the recent history of the SPX 500 futures and their current position within a compressing wedge, you can better prepare for potential shifts in the market. Whether you choose to place your bets now or wait for a break, staying informed and adaptable is crucial to successful trading.

Stocks: Early optimism fades but trend still positiveWall Street opened higher after futures rose in the first half of Tuesday’s session, finding good support from firmer Chinese and European equity markets, and positive risk appetite across the financial markets with the likes of Bitcoin and AUD/USD also higher. But at the time of writing, the major indices had all turned negative on the day, most likely due to profit-taking ahead even more earnings. Therefore, the bullish S&P 500 forecast is still valid until the charts tell us otherwise.
Chinese data fuels rally in risk assets
Mixed bank earnings reports
Netflix kicks off tech earnings
Strong Chinese GDP underpins miners, luxury names
Earlier in the day, stronger-than-expected Chinese GDP and consumer spending data had helped to fuel a rally in European luxury names, while miners were leading the charge in London. Investors were also digesting US earnings, as Goldman Sachs and Bank of American produced contrasting results with the former dropping more than 3% and the latter rising 2.8% in premarket. These come after strong results from JP Morgan, Citi and Wells Fargo on Friday, soothing investor concerns surrounding banks’ profitability.
US housing data highlights impact of higher rates
Meanwhile, the latest US housing market data hinted to a drop in future construction, underscoring the impact of high interest rates. Housing starts for March were 1.42 million annualised units compared to 1.40 million expected and 1.43m last. Housing permits fell to 1.41m from 1.55m previously, disappointing expectations of 1.45m. So, not great numbers – especially the near-9% decline in permits, which is a leading indicator of future housing construction.
Despite the housing market slowdown, the labour market is still holding its own rather well, an inflation is falling somewhat rapidly now. All told, the US is still likely heading for an economic slowdown, but it may be less severe than expected. Which is why investors’ have pared their Fed rate-cut predictions from extreme levels, and why we have seen US equity markets perform rather well in recent weeks.
Focus turns to Netflix and other big techs
Investors’ focus will turn to technology sector earnings, with Netflix set to report its results after the close tonight and Tesla the day after. Microsoft, Alphabet, Amazon, and Meta are scheduled to post their numbers next week, followed by Apple in early May. These results will have an impact on our S&P 500 forecast, as well as the other major indices.
S&P 500 Technical Analysis
While the current shape of the candle looks bearish, the day is still young, and dip-buyers might step back in to save the day. Regardless of how the market closes today, the S&P 500 forecast remains bullish until we see a break down in the market structure of higher highs and higher lows.
The most recent low comes in around 4082, which is now the line in the sand as far the short-term outlook is concerned. For as long as the S&P holds above this level, the path of least resistance would remain to the upside.
The bulls will want to defend the shaded blue area that was being tested at the time of writing. Previously resistance, it needs to serve as support to keep the short-term bullish momentum intact. If support holds here, then the next stop could be above 4195, the high that was hit back in February.
-- Written by Fawad Razaqzada, Market Analyst
Follow Fawad on Twitter @Trader_F_R


SPX500USD Is Going Up! Buy!
Here is our detailed technical review for SPX500USD.
Time Frame: 6h
Current Trend: Bullish
Sentiment: Oversold (based on 7-period RSI)
Forecast: Bullish
The market is approaching a key horizontal level 4138.3.
Considering the today's price action, probabilities will be high to see a movement to 4216.4.
P.S
Please, note that an overbought condition can last for a long time, and therefore being overbought doesn't mean a price rally will come soon, or at all.
Like and subscribe and comment my ideas if you enjoy them!

S&P 500: Roaring Twenties 2.0 Bullish Harmonic FractalIn the lead up to the 1920s, the US Federal Reserve significantly increased its balance sheet by almost nine times, starting from 700 Million Dollars in December 1916 to 6.6 Billion Dollars by January 1920. This move was presumably to fund the US's entry into the First World War, which led to an increased demand for US government debt globally and loose lending conditions domestically, and low rates thereby encouraging a round of inflation in the US. However, after the war ended, the Fed stopped increasing the balance sheet, and between 1920 and 1922, they began to reduce it from the already elevated $6.6 billion to $4.8 billion, almost a 30% cut in just two years.
This action successfully controlled inflation but did not eliminate it completely, yet the dollar gained significant buying power, resulting in a somewhat disinflationary period. As a response to this, the Fed maintained the balance sheet within a tight range around $4.8 billion for a decade, neither raising nor lowering it much but the federal reserve did continue to significantly lower the interest rates; During this time, equities rallied.
While the 1920s were a period of economic growth and prosperity, there were warning signs of overheating towards the end of the decade. Investors were becoming overly speculative, leading to a surge in stock and real estate prices, while lending standards declined and consumer spending continued to rise rapidly.
To counteract these inflationary pressures, the Federal Reserve implemented policies to tighten credit conditions; They doubled interest rates and also raised reserve requirements for banks, which reduced the amount of money available for lending.
In essence this would kickstart The Great Depression which could have instead been a Simple Recession if only the fed had acted sooner as it wasn't their intention to crush the market but rather they just wanted to cool the market down a bit to contain inflation.
Years deep into the Great depression, the Federal Reserve realized they had gone too far. So, to fix this, they would begin to raise the balance sheet again while also cutting rates drastically in an effort to relieve pressure from the economy and promote new opportunities for economic growth, which then led to a new expansionary cycle.
With that all being said, it would appear that the Fed is doing now what it was doing back then. Over the last decade, they raised the balance sheet by 900% and lowered interest rates by over 95%. Only over the last year, they have begun to reduce the balance sheet by about 10% while raising rates by over 1500%. If we are to go off of the Harmonic Fractals on the chart, then we are likely nearing a point in time where the Fed will begin to loosen rate policy and bring the balance sheet back to all-time highs. This would align with the S&P reaching a 2.618 - 4.00 Retraces as the Fed attempts to keep policy as loose as possible in the hopes that inflation won't come back to bite them. But once we reach harmonic targets, we will likely see inflation return in a great way, which would then force the Fed to induce another Great Depression in the next several years rather they want to or not.
Technical Argument: ABCD BAMM, after breaking a long accumulation range and entering a long term expansionary cycle, we are now in the later phases of said cycle while showing heavy amounts of MACD Hidden Bullish Divergence and harmonically have room to go up significantly higher before it ultimately reaches D and comes to an end.

ES1! SPX500USD 2023 APR 17 WEEKCME_MINI:ES1!
ES1! SPX500USD 2023 APR 17 WEEK
Friday's bar closed below 4175 and showed a rejection
of higher prices.
Scenario Planning:
1) Rejection short at 4175
2) Market rotation continues = trade at boundary (80pt range)
of range (grey box)
3) Rotation breakout long at support of 4175
Volume Analysis:
Weekly: Ave vol up bar close off high = minor weakness
Daily: High vol narrow spread S>D bar = weakness
Price reaction levels:
Short = Test and Reject | Long = Test and Accept
4303 4175 4096
3928 3788
Remember to like and follow if you find this useful.
Have a profitable trading week.

SPX to find support at trend line?US500 - Intraday - We look to Buy at 4096 (stop at 4066)
Posted a Bullish Outside candle on the Daily chart.
There is no sign that this bullish momentum is faltering but the pair has stalled close to a previous swing high of 4153.
The bias remains mildly bullish but there is scope for a move in either direction at the open.
Trading within a Bullish Channel formation.
Further upside is expected although we prefer to set longs at our bespoke support levels at 4091, resulting in improved risk/reward.
Our profit targets will be 4166 and 4186
Resistance: 4155 / 4196 / 4230
Support: 4091 / 4047 / 4018
Risk Disclaimer
The trade ideas beyond this page are for informational purposes only and do not constitute investment advice or a solicitation to trade. This information is provided by Signal Centre, a third-party unaffiliated with OANDA, and is intended for general circulation only. OANDA does not guarantee the accuracy of this information and assumes no responsibilities for the information provided by the third party. The information does not take into account the specific investment objectives, financial situation, or particular needs of any particular person. You should take into account your specific investment objectives, financial situation, and particular needs before making a commitment to trade, including seeking advice from an independent financial adviser regarding the suitability of the investment, under a separate engagement, as you deem fit.
You accept that you assume all risks in independently viewing the contents and selecting a chosen strategy.
Where the research is distributed in Singapore to a person who is not an Accredited Investor, Expert Investor or an Institutional Investor, Oanda Asia Pacific Pte Ltd (“OAP“) accepts legal responsibility for the contents of the report to such persons only to the extent required by law. Singapore customers should contact OAP at 6579 8289 for matters arising from, or in connection with, the information/research distributed.
