Bearish drop?S&P500 is reacting off the resistance level which is an overlap resistance and could drop from this level to our take profit.
Entry: 5,510.94
Why we like it:
There is an overlap resistance level.
Stop loss: 5,665.52
Why we like it:
There is a pullback resistance.
Take profit: 5,324.97
Why we like it:
There is an overlap support level that lines up with the 50% Fibonacci retracement.
Enjoying your TradingView experience? Review us!
Please be advised that the information presented on TradingView is provided to Vantage (‘Vantage Global Limited’, ‘we’) by a third-party provider (‘Everest Fortune Group’). Please be reminded that you are solely responsible for the trading decisions on your account. There is a very high degree of risk involved in trading. Any information and/or content is intended entirely for research, educational and informational purposes only and does not constitute investment or consultation advice or investment strategy. The information is not tailored to the investment needs of any specific person and therefore does not involve a consideration of any of the investment objectives, financial situation or needs of any viewer that may receive it. Kindly also note that past performance is not a reliable indicator of future results. Actual results may differ materially from those anticipated in forward-looking or past performance statements. We assume no liability as to the accuracy or completeness of any of the information and/or content provided herein and the Company cannot be held responsible for any omission, mistake nor for any loss or damage including without limitation to any loss of profit which may arise from reliance on any information supplied by Everest Fortune Group.
US SPX 500

S&P 500 Rally Exhausted? Watch This Level for the Next Drop!The S&P 500 Index( SP:SPX ) has finally touched the Resistance zone($5,680-$5,500) as I expected in my previous post .
The S&P 500 Index is moving near the Resistance zone($5,680-$5,500) , the Resistance line, and Yearly Pivot Point .
Also, we can see the Regular Divergence(RD-) between Consecutive Peaks .
In terms of Elliott Wave theory , it seems that the S&P 500 Index is completing the Zigzag Correction(ABC/5-3-5) , and if the uptrend line breaks , we can confirm the end of the Zigzag correction .
When the S&P 500 Index started to rise on April 22 , Bitcoin also started to rise at the same time , so a decline in the S&P 500 Index can cause Bitcoin ( BINANCE:BTCUSDT ) to decline .
I expect the S&P 500 Index to drop to at least $5,313 AFTER breaking the uptrend line .
Note: If the S&P 500 Index touches $5,712, we can expect more pumps.
Please respect each other's ideas and express them politely if you agree or disagree.
S&P 500 Index Analyze (SPX500USD),2-hour time frame.
Be sure to follow the updated ideas.
Do not forget to put a Stop loss for your positions (For every position you want to open).
Please follow your strategy and updates; this is just my Idea, and I will gladly see your ideas in this post.
Please do not forget the ✅' like '✅ button 🙏😊 & Share it with your friends; thanks, and Trade safe.

Could The Stock Market Crash? - WARNING 🚨MartyBoots here , I have been trading for 17 years and sharing my thoughts on SPX .🚨
🚨 SP:SPX Could It Crash?🚨
Lets look into it deeper, very interesting chart but also a dangerous one. Need to see buyers soon or this is could be worse than people expect. 5-10% drop minimum and extreme bear could drop 40% total🚨
Watch video for more details

S&P 500 | SPX500USD: Bulls Find Support — But Is It Enough?SPX500USD 12H TECHNICAL ANALYSIS 🔍
OVERALL TREND
📈 UPTREND (Tentative) — Market structure appears to be attempting a reversal from a recent pivot low. However, the macro trend remains under pressure unless price clears the key resistance range above 5,950.
📉RESISTANCE
🔴 6,152.5000 — PIVOT HIGH | Dynamic Resistance Level
🔴 6,086.2943 — SELL ORDER II
🔴 5,952.1652 — SELL ORDER I
📊ENTRIES & TARGETS
🎯 5,884.4400 — EXIT BUY | TP 4
🎯 5,640.5683 — BUY ORDER | TP 3
🎯 5,482.3500 — BUY ORDER | TP 2 | Mid-Pivot
🎯 5,254.5432 — BUY ORDER | TP 1
📈SUPPORT
🟢 5,021.6218 — BUY ORDER
🟢 4,879.2150 — BUY ORDER II
🟢 4,812.2000 — PIVOT LOW | Dynamic Support Level
📊OSCILLATOR SUMMARY
🧭 RSI (14): 51.98 — Neutral
📉 MACD Level: -41.34 — Buy Bias Forming
🚀 Momentum (10): -36.21 — Positive Divergence Developing
📊 ADX (14): 21.08 — Early Trend Formation
📉 Awesome Oscillator: -87.21 — Bearish but Flattening
🧮MOVING AVERAGE SUMMARY
✅ 10/20/30 EMA & SMA — All Showing Buy Signals
❌ 50/100/200 EMA & SMA — Still Bearish, Suggesting Long-Term Pressure
📊 VWMA (20): 5,289.90 — Bullish Price Reaction Above VWMA
📏 Ichimoku Base Line: 5,158.19 — Neutral, Needs Further Validation
🤓STRUCTURAL NOTES
Current price is battling between 5,300–5,400 resistance range — a break and close above 5,482 could trigger further upside
Significant bullish reversal candle formed near the last pivot low at 4,812
Volume profile suggests re-accumulation; price attempting to reclaim 5,300 structure
Momentum indicators show signs of shifting bullish, but not yet in strong confirmation territory
TRADE OUTLOOK 🔎
📈 Bullish bias above 5,254 with targets at 5,482 / 5,640 / 5,884
📉 Bearish pressure reactivates if price rejects 5,482 and closes below 5,021
👀 Monitor ADX for trend confirmation — under 25 = caution; above 25 = trend validation
🧪STRATEGY RECOMMENDATION
CONSERVATIVE APPROACH (Reversal Play):
— Entry: 5,254.54
— Targets: 5,482.35 / 5,640.56 / 5,884.44
— SL: Below 5,021.62
HIGH-RISK SCALP (Resistance Fade):
— Sell Order near 5,952.16 or 6,086.29
— Targets: 5,640 / 5,482
— SL: Above 6,152.50
“Discipline | Consistency | PAY-tience™”

S&P 500 Pullback Nearing End? Hammer + Elliott Wave Say Rebound!The S&P 500 Index ( FOREXCOM:SPX500 ) is one of the most important indexes in the financial market these days , with the cryptocurrency market and especially Bitcoin ( BINANCE:BTCUSDT ) having a strong correlation with this index .
After Donald Trump suspended tariffs on 90 countries (except China) , the S&P 500 Index started to rise and seems to have managed to break through the Resistance zone($5,284-$5,094) and is pulling back to this zone .
One of the signs of a reversa l of the S&P 500 Index can be the formation of the Hammer Candlestick Pattern , which announces the end of the pullback .
In terms of Elliott Wave theory , it seems that the S&P 500 Index is completing a corrective wave that could be in the form of a main wave 4 ( it is correcting both in time and price ).
I expect the S&P 500 Index to resume its upward trend in the coming hours, if nothing special is released , and to reach the Resistance zone($5,680-$5,500) and Yearly Pivot Point . If this happens, today's Bitcoin analysis could also be correct .
Note: In the worst case, if the S&P 500 Index touches $5,050, we should expect a further decline in the S&P 500 Index and Bitcoin.
Do you think the S&P 500 Index will return to an upward trend, or is this increase temporary?
Please respect each other's ideas and express them politely if you agree or disagree.
S&P 500 Index Analyze (SPX500USD),1-hour time frame.
Be sure to follow the updated ideas.
Do not forget to put a Stop loss for your positions (For every position you want to open).
Please follow your strategy and updates; this is just my Idea, and I will gladly see your ideas in this post.
Please do not forget the ✅' like '✅ button 🙏😊 & Share it with your friends; thanks, and Trade safe.

"SPX500/US500" Index Market Money Heist Plan (Day / Scalping)🌟Hi! Hola! Ola! Bonjour! Hallo! Marhaba!🌟
Dear Money Makers & Robbers, 🤑 💰💸✈️
Based on 🔥Thief Trading style technical and fundamental analysis🔥, here is our master plan to heist the "SPX500/US500" Index Market. Please adhere to the strategy I've outlined in the chart, which emphasizes long entry. Our aim is to escape near the high-risk Blue MA Zone. Risky level, overbought market, consolidation, trend reversal, trap at the level where traders and bearish robbers are stronger. 🏆💸"Take profit and treat yourself, traders. You deserve it!💪🏆🎉
Entry 📈 : "The heist is on! Wait for the MA breakout (5400) then make your move - Bullish profits await!"
however I advise to Place Buy stop orders above the Moving average (or) Place buy limit orders within a 15 or 30 minute timeframe most recent or swing, low or high level for Pullback entries.
📌I strongly advise you to set an "alert (Alarm)" on your chart so you can see when the breakout entry occurs.
Stop Loss 🛑: "🔊 Yo, listen up! 🗣️ If you're lookin' to get in on a buy stop order, don't even think about settin' that stop loss till after the breakout 🚀. You feel me? Now, if you're smart, you'll place that stop loss where I told you to 📍, but if you're a rebel, you can put it wherever you like 🤪 - just don't say I didn't warn you ⚠️. You're playin' with fire 🔥, and it's your risk, not mine 👊."
📍 Thief SL placed at the recent/swing low level Using the 1H timeframe (5100) Day trade basis.
📍 SL is based on your risk of the trade, lot size and how many multiple orders you have to take.
🏴☠️Target 🎯: 5800 (or) Escape Before the Target
🧲Scalpers, take note 👀 : only scalp on the Long side. If you have a lot of money, you can go straight away; if not, you can join swing traders and carry out the robbery plan. Use trailing SL to safeguard your money 💰.
💰💵💸"SPX500/US500" Index Market Heist Plan (Scalping/Day) is currently experiencing a bullishness,., driven by several key factors. 👇👇👇
📰🗞️Get & Read the Fundamental, Macro, COT Report, Geopolitical and News Analysis, Sentimental Outlook, Intermarket Analysis, Index-Specific Analysis, Positioning and future trend targets & Overall outlook score... go ahead to check 👉👉👉🔗🔗
⚠️Trading Alert : News Releases and Position Management 📰 🗞️ 🚫🚏
As a reminder, news releases can have a significant impact on market prices and volatility. To minimize potential losses and protect your running positions,
we recommend the following:
Avoid taking new trades during news releases
Use trailing stop-loss orders to protect your running positions and lock in profits
💖Supporting our robbery plan 💥Hit the Boost Button💥 will enable us to effortlessly make and steal money 💰💵. Boost the strength of our robbery team. Every day in this market make money with ease by using the Thief Trading Style.🏆💪🤝❤️🎉🚀
I'll see you soon with another heist plan, so stay tuned 🤑🐱👤🤗🤩

$S&P500 macro analysis , market approaching correction °•° $SPXHi 👋🏻 check out my previous analysis ⏰ on SP:SPX macro bullish analysis ⏰
As provided it went up up 🚀 completed my target's 🎯 💯💪🏻 ✅ ✔️
Click on it 👆🏻 just check out each and every time updates ☝🏻 ☺️
•••••••••••••••••••••••••••••••••••••••••••••••••••••••••••••••••••••••••••••••••••••••••
NOW I was completely 🐻 BEARISH on the market with in upcoming months SP:SPX
📌 Expecting liquidation pump $6500 - $6700
Invalid 🛑 when complete month close above $6700
¹support - $5500 ( 🎯 ¹ )
²support - $5130 ( 🎯 ² )
🎯 3 ... Will be updated based on market conditions by that time ☺️
📍 A wise 🦉 man said - always having patience " is " always gaining only /-
NASDAQ:TSLA ( i accumulate slowly until it cross above $400 )
rest of stocks i will follow index ☝🏻 i will invest based on market conditions ..... ✔️

S&P 500 Index Under Pressure – Another -10% Drop Incoming?Today, I want to analyze the S&P 500 Index ( FOREXCOM:SPX500 ) for you. This index is one of the most important indices in the US stock market , which has been determining the direction of parallel financial markets such as crypto and especially Bitcoin ( BINANCE:BTCUSDT ) for the past few days, so an analysis of this index can be important for us.
The S&P 500 Index started to fall after Donald Trump imposed new tariffs on countries around the world, which was like a coronavirus .
The question is whether this fall is temporary or will continue . To answer this question, we need to consider many parameters, but if we look at the sds chart from a technical analysis chart , we can expect a further decline .
The S&P 500 Index is moving near the Resistance zone($5,284-$5,095) and is completing a pullback . It also lost its important Uptrend lines last week, which is not good news for the S&P 500 Index and US stocks .
From an Elliott wave theory , the S&P 500 IndexS&P looks like it has completed the main wave 4 , and we should expect the next decline(-10%) .
I expect the S&P 500 Index to attack the Heavy Support zone($4,820-$4,530) at least once more. The area where we can expect the S&P 500 Index to pull back is the Potential Reversal Zone(PRZ) .
What do you think? Will the S&P 500 Index continue its downward trend, or was this decline temporary?
Note: If the S&P 500 Index touches $5,408, we can expect further Pumps.
Note: There is a possibility of a Bear Trap near the Heavy Support zone($4,820-$4,530) and PRZ.
Please respect each other's ideas and express them politely if you agree or disagree.
S&P 500 Index Analyze (SPX500USD),4-hour time frame.
Be sure to follow the updated ideas.
Do not forget to put a Stop loss for your positions (For every position you want to open).
Please follow your strategy and updates; this is just my Idea, and I will gladly see your ideas in this post.
Please do not forget the ✅' like '✅ button 🙏😊 & Share it with your friends; thanks, and Trade safe.

[S&P500] 2008-Style Collapse in MotionI believe we are witnessing the early stages of a 2008-style crash, though this one will unfold more swiftly and catch many by surprise. The crash will likely test the COVID-era lows, and once the panic subsides, a recovery toward new highs will follow.
FUNDAMENTAL REASONS
After the COVID-crash recovery, the market became significantly overbought, and a pullback was inevitable—such is the nature of markets. Trump’s tariffs have provided a convenient excuse for profit-taking. While the tariffs didn’t directly cause the crash, they served as a much-needed catalyst. What might have been a typical bull market pullback, however, could escalate into full-blown panic.
Why? Index funds.
For the past decade, there has been near-religious advocacy for investing solely in low-cost index funds. This extraordinary delusion has overtaken investors’ collective consciousness—the belief that no one can beat the S&P 500, nor should they try. The most rational choice, then, becomes focusing on your career or business and parking your money in index funds. After all, if the game can’t be beaten, why bother playing? This logic resonates with rational index fund buyers—many of whom lack market experience and have never been tested in the trenches of a downturn. They assume they’re in it for the long haul, unbothered by pullbacks, confident they can hold through volatility. It’s a sound and logical stance.
But will they hold? It’s easy to stay committed when the market is rising. When losses mount, however, the limbic system overrides rational thought, thrusting you into survival mode. You begin calculating how many years of work you’ve “lost,” lamenting that you could have bought a house if you’d sold at the peak, or watching your children’s college fund evaporate. Sleepless nights follow, compounded by a barrage of negative news. Eventually, exhaustion sets in, and in a desperate bid to salvage what remains, you hit the sell button.
With so many unsophisticated investors—who have never endured a true market panic—holding portfolios dominated by index funds, a negative feedback loop emerges. The further the market falls, the more people question their strategy and sell. This cycle intensifies until the panic is overdone, weak hands are shaken out, and the market stabilizes. It’s a tale as old as markets themselves, though today’s index fund evangelists have yet to experience it firsthand.
TECHNICAL REASONS
On the monthly chart, a clear and potent triple RSI divergence stands out. This indicates the market is severely overbought and has been struggling to make new highs.
While technical analysis rarely delivers definitive signals and can often be ambiguous, a triple RSI divergence on a monthly chart is as strong as it gets. Monthly charts of high-market-cap indices are immune to manipulation and short-term noise—it would take an infinite amount of capital to artificially “draw” such a pattern.
The 2021-2022 pullback was an Elliott Wave impulsive wave down (a Leading Diagonal). In Elliott Wave Theory, impulsive waves mark either the final leg of a correction or the first wave of a new trend. A Leading Diagonal almost always signals the latter—meaning another impulsive wave in the same direction is likely to follow.
The 2022-2025 bull market, meanwhile, has proven to be an ABC corrective wave up within the broader trend. This suggests the bull run wasn’t a continuation of the prior uptrend but rather an extended correction that pushed to new highs.
Thus, the leading diagonal down foreshadows another impulsive wave lower, and the corrective wave up confirms this trajectory. Since March 2025, the market has entered free-fall mode—precisely what one would expect following an upward corrective wave.
This sets the stage for a high-probability Elliott Wave Expanding Flat pattern. What’s unfolding now is an impulsive wave down that should, at minimum, retest the 2022 low. If panic takes hold, however, the decline won’t find a floor until it hits a major support level—namely, the 200-month moving average (MA200 Monthly), which sits precisely at the COVID bottom. Should that occur, the magnitude of the drop would rival the 2008 crash.

Could the price bounce from here?S&P500 is falling towards the support level which is an overlap support that lines up with the 61.8% Fibonacci retracement and could bounce from this level to our take profit.
Entry: 4,963.98
Why we like it:
There is an overlap support level that lines up with the 61.8% Fibonacci retracement.
Stop loss: 4,800.67
Why we like it:
There is a pullback support level.
Take profit: 5,158.53
Why we like it:
There is a pullback resistance level.
Enjoying your TradingView experience? Review us!
Please be advised that the information presented on TradingView is provided to Vantage (‘Vantage Global Limited’, ‘we’) by a third-party provider (‘Everest Fortune Group’). Please be reminded that you are solely responsible for the trading decisions on your account. There is a very high degree of risk involved in trading. Any information and/or content is intended entirely for research, educational and informational purposes only and does not constitute investment or consultation advice or investment strategy. The information is not tailored to the investment needs of any specific person and therefore does not involve a consideration of any of the investment objectives, financial situation or needs of any viewer that may receive it. Kindly also note that past performance is not a reliable indicator of future results. Actual results may differ materially from those anticipated in forward-looking or past performance statements. We assume no liability as to the accuracy or completeness of any of the information and/or content provided herein and the Company cannot be held responsible for any omission, mistake nor for any loss or damage including without limitation to any loss of profit which may arise from reliance on any information supplied by Everest Fortune Group.

Has SPX formed a bottom?SPX500USD - 24h expiry
Price action looks to be forming a bottom.
A Doji style candle has been posted from the base.
Setbacks should be limited to yesterday's low.
We look to buy dips.
Risk/Reward would be poor to call a buy from current levels.
We look to Buy at 4900.5 (stop at 4767.5)
Our profit targets will be 5295.5 and 5365.5
Resistance: 5219.6 / 5350.0 / 5500.0
Support: 5100.0 / 5000.0 / 4812.2
Risk Disclaimer
The trade ideas beyond this page are for informational purposes only and do not constitute investment advice or a solicitation to trade. This information is provided by Signal Centre, a third-party unaffiliated with OANDA, and is intended for general circulation only. OANDA does not guarantee the accuracy of this information and assumes no responsibilities for the information provided by the third party. The information does not take into account the specific investment objectives, financial situation, or particular needs of any particular person. You should take into account your specific investment objectives, financial situation, and particular needs before making a commitment to trade, including seeking advice from an independent financial adviser regarding the suitability of the investment, under a separate engagement, as you deem fit.
You accept that you assume all risks in independently viewing the contents and selecting a chosen strategy.
Where the research is distributed in Singapore to a person who is not an Accredited Investor, Expert Investor or an Institutional Investor, Oanda Asia Pacific Pte Ltd (“OAP“) accepts legal responsibility for the contents of the report to such persons only to the extent required by law. Singapore customers should contact OAP at 6579 8289 for matters arising from, or in connection with, the information/research distributed.

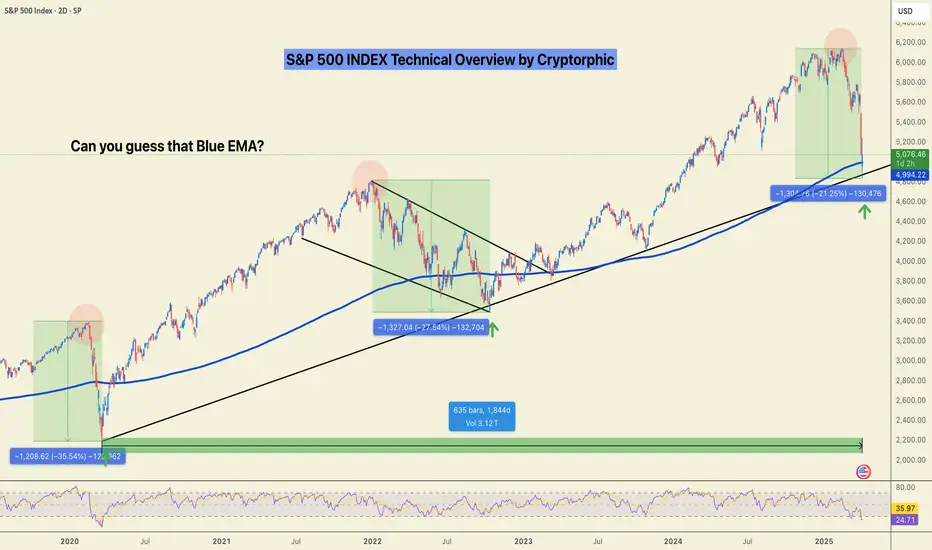
S&P 500: Valuation Correction or the Start of a Breakdown?Valuation Correction or the Start of a Breakdown?
Zoom out. Clear the noise.
We might still sweep the lows, but when viewed on the weekly timeframe, this current S&P 500 move looks more like a healthy valuation correction than a structural breakdown.
Let’s break it down by the numbers using fractal analysis:
🟩 March 2020 (COVID Crash):
▪️~35% drop
▪️V-shaped recovery
▪️Oversold RSI bounce
🟨 2022 Bear Market:
▪️~27% correction
▪️Multi-month wedge consolidation
▪️Eventually led to an upside breakout
🟦 Now (2025):
▪️~21% correction so far
▪️Retesting long-term trendline
▪️RSI in familiar oversold zone
📊 Fractal Math:
- From 35% to 27% = 22.86% decrease
- From 27% to 21% = 22.22% decrease
Both legs show a consistent ~22% drop in correction depth suggesting bearish momentum is weakening with each cycle. Currently bouncing off the1844 days of support.
Is this the bottom? Will there be relief?
🔁 If this pattern holds:
- We could see a short-term sweep or deviation under recent lows.
- But structure favours a potential recovery from this zone, unless the trendline breaks decisively.
📌 Watch levels closely. Timing matters.
🧠 What’s your take, is this another “buy the dip” moment?
Do hit the like button if you liked this update and share your views in the comment section.
NASDAQ, S&P 500 and CoinMarketCap movements, Bitcoin chart
Hello, traders.
If you "Follow", you can always get new information quickly.
Please click "Boost" as well.
Have a nice day today.
-------------------------------------
We need to check the movement after a new candle is created.
USDT, USDC should gap up to know that funds have flowed into the coin market.
On the other hand, if there is a gap down, I think funds have flowed out of the coin market.
Therefore, I think USDT or USDC are showing the size and flow of funds in the coin market.
-
(BTC.D 1M chart)
If BTC dominance is maintained above 62.47 or continues to rise, altcoins are likely to show a large decline.
Therefore, in order for an altcoin bull market to begin, it must fall below 55.01 and remain there or continue to decline.
-
(USDT.D 1M chart)
USDT is a fund that has a large influence on the coin market.
Therefore, if USDT dominance rises, it means that the coin market is likely to show an overall decline.
On the other hand, if it falls, it can be interpreted that the coin market is likely to show an overall rise.
In order for the coin market to start an upward trend, it must fall below 4.97 and remain there or continue to decline.
In particular, if the Fibonacci ratio rises above 0.618, the coin market is likely to plummet.
If it remains above the Fibonacci ratio of 0.618, it is likely to rise to around 7.14.
-------------------------------------------
(NAS100USD 12M chart)
It has currently entered the most important support and resistance zone.
-
(1W chart)
Therefore, the maximum decline point is expected to be around 14922.2.
In order to continue the uptrend, the price must be maintained above the M-Signal indicator on the 1M chart.
Therefore, the key is whether it can receive support near the most important support and resistance zone and rise above the M-Signal indicator on the 1M chart.
---------------------------------------------
(SPX500USD 1W chart)
The key is whether it can be supported around 4773.4-4846.1 and rise above the M-Signal indicator on the 1M chart.
If not, the maximum decline is expected to be around 3875.1-4116.0.
---------------------------------------------
(BTCUSDT 1M chart)
As I mentioned before, since the dotted trend line (1) is not acting as a clear trend line, there is a high possibility of volatility.
Therefore, when the StochRSI indicator creates a peak in the oversold zone and rises this time, there is a possibility that a trend will be formed as a trend line between lows is created.
However, the high-point trend line and the low-point trend line must be formed in the same direction.
In other words, since the current high-point trend line is creating an upward trend line, the low-point trend line that will be created this time must also create an upward trend line.
In that sense, the 69000-73199.86 section can be seen as an important support and resistance section.
If it falls below 69000, it is likely to touch the Fibonacci ratio section of 0.886 (56227.18) ~ 1 (61338.93), which was the previous high point section.
-
(1D chart)
On the last day of this volatility period, it fell below the upward trend line (2), showing a large decline.
Since it fell below the downward trend line, there is a possibility that it will continue to fall further.
At this time, the key is whether it can rise with support near 73499.86.
The next volatility period is around April 25 (April 24-26).
The point of interest is whether the price is maintained near 73499.86 or 89294.25 after the next volatility period.
-
The 73499.86 point is the HA-High indicator point on the 1M chart.
The M-Signal indicator on the 1M chart is rising to around 73499.86.
Therefore, if support is confirmed near the M-Signal indicator on the 1M chart, I think it is an aggressive buying period.
If it falls below the M-Signal indicator on the 1M chart, it is a buying period until it rises again and supports near the M-Signal indicator on the 1M chart.
The next time to buy is when it shows support near the Fibonacci ratio range of 0.886 (56227.18) ~ 1 (61338.93) that I mentioned in the 1M chart explanation.
-
Thank you for reading to the end.
I hope you have a successful trade.
--------------------------------------------------
- This is an explanation of the big picture.
I used TradingView's INDEX chart to check the entire range of BTC.
I rewrote the previous chart to update it while touching the Fibonacci ratio range of 1.902 (101875.70) ~ 2 (106275.10).
(Previous BTCUSD 12M chart)
Looking at the big picture, it seems to have been maintaining an upward trend following a pattern since 2015.
That is, it is a pattern that maintains a 3-year uptrend and faces a 1-year downtrend.
Accordingly, the uptrend is expected to continue until 2025.
-
(Current BTCUSD 12M chart)
Based on the currently written Fibonacci ratio, it is displayed up to 3.618 (178910.15).
It is expected that it will not fall again below the Fibonacci ratio of 0.618 (44234.54).
(BTCUSDT 12M chart)
Based on the BTCUSDT chart, I think it is around 42283.58.
-
I will explain it again with the BTCUSD chart.
The Fibonacci ratio ranges marked in the green boxes, 1.902 (101875.70) ~ 2 (106275.10) and 3 (151166.97) ~ 3.14 (157451.83), are expected to be important support and resistance ranges.
In other words, it seems likely that they will act as volume profile ranges.
Therefore, in order to break through these ranges upward, I think the point to watch is whether they can receive support and rise near the Fibonacci ratios of 1.618 (89126.41) and 2.618 (134018.28).
Therefore, the maximum rising range in 2025 is expected to be the 3 (151166.97) ~ 3.14 (157451.83) range.
In order to do that, we need to see if it is supported and rises near 2.618 (134018.28).
If it falls after the bull market in 2025, we don't know how far it will fall, but based on the previous decline, we expect it to fall by about -60% to -70%.
Therefore, if it starts to fall near the Fibonacci ratio 3.14 (157451.83), it seems likely that it will fall to around Fibonacci 0.618 (44234.54).
I will explain more details when the bear market starts.
------------------------------------------------------

"SPX500/US500" Index CFD Market Heist Plan (Swing/Day Trade)🌟Hi! Hola! Ola! Bonjour! Hallo! Marhaba!🌟
Dear Money Makers & Robbers, 🤑💰✈️
Based on 🔥Thief Trading style technical and fundamental analysis🔥, here is our master plan to heist the "SPX500 / US500" Index CFD Market. Please adhere to the strategy I've outlined in the chart, which emphasizes short entry. Our aim is the high-risk Green Zone. Risky level, oversold market, consolidation, trend reversal, trap at the level where traders and bullish robbers are stronger. 🏆💸Book Profits Be wealthy and safe trade.💪🏆🎉
Entry 📈 : "The vault is wide open! Swipe the Bearish loot at any price - the heist is on!
however I advise to Place sell limit orders within a 15 or 30 minute timeframe most recent or swing, low or high level.
Stop Loss 🛑: (5730) Thief SL placed at the nearest / swing high level Using the 8H timeframe swing / day trade basis.
SL is based on your risk of the trade, lot size and how many multiple orders you have to take.
Target 🎯: 5300 (or) Escape Before the Target
🧲Scalpers, take note 👀 : only scalp on the Short side. If you have a lot of money, you can go straight away; if not, you can join swing traders and carry out the robbery plan. Use trailing SL to safeguard your money 💰.
"SPX500 / US500" Index CFD Market Heist Plan (Swing/Day) is currently experiencing a bearishness,., driven by several key factors.
📰🗞️Get & Read the Fundamental, Macro Economics, COT Report, Geopolitical and News Analysis, Sentimental Outlook, Intermarket Analysis, Index-Specific Analysis, Positioning and future trend targets... go ahead to check 👉👉👉🔗
⚠️Trading Alert : News Releases and Position Management 📰 🗞️ 🚫🚏
As a reminder, news releases can have a significant impact on market prices and volatility. To minimize potential losses and protect your running positions,
we recommend the following:
Avoid taking new trades during news releases
Use trailing stop-loss orders to protect your running positions and lock in profits
💖Supporting our robbery plan 💥Hit the Boost Button💥 will enable us to effortlessly make and steal money 💰💵. Boost the strength of our robbery team. Every day in this market make money with ease by using the Thief Trading Style.🏆💪🤝❤️🎉🚀
I'll see you soon with another heist plan, so stay tuned 🤑🐱👤🤗🤩

S&P 500 Down 3% – Divergence AppearsThe S&P 500 (SPX) continues to show a strong bearish bias and is approaching the 5,300-point level in the short term. Selling pressure remains steady as post-“Liberation Day” uncertainty persists, with markets concerned that the recently announced tariffs could significantly impact the U.S. economic outlook. As a result, this could severely limit the performance of equity indices like the S&P 500.
Bearish Channel
Since February 20, the SPX index has maintained consistent downward momentum, establishing a new bearish channel in the short term. The index has now broken below the key 5,400-point support level. However, the speed of the recent declines may have created an imbalance in market forces, which could pave the way for a bullish correction in upcoming sessions.
Divergence in Indicators
MACD: Both the MACD line and the signal line have shown higher lows in recent trading sessions, which contrasts with the lower lows in the SPX price, indicating a bullish divergence.
RSI: The RSI is showing a similar pattern, with the line forming higher lows while price continues to make lower lows. Additionally, the RSI is now approaching the 30 level, which is typically considered the oversold zone.
These divergence and oversold signals suggest that bearish momentum has accelerated sharply, potentially signaling short-term exhaustion. As the balance between buyers and sellers begins to stabilize, this may be an early indication that upward corrections could occur in the next few sessions.
Key Levels:
5,780 points – Distant resistance: This level aligns with the 200-period moving average. A return to this zone could mark the start of a new bullish phase, posing a threat to the current bearish channel.
5,530 points – Near resistance: This area corresponds to neutral levels seen in recent weeks. It may become a target zone for potential corrective upward moves.
5,388 points – Key support zone: This level matches the lowest prices since September 2024 and is where the price is currently consolidating. If the index breaks decisively below this level, it could lead to a more extended bearish channel in the short term.
By Julian Pineda, CFA – Market Analyst

April 3rd Daily Trade Recap EOD accountability report: +$161.25
Sleep: 6 hour, Overall health: not good at all.
**Daily Trade Recap based on VX Algo System **
9:42 AM Market Structure flipped bullish on VX Algo X3!
10:30 AM Market Structure flipped bearish on VX Algo X3!
11:11 AM VXAlgo ES 10M Buy signal (double signal)
12:04 pm Market Structure flipped bullish on VX Algo X3!
1:31pm Market Structure flipped bearish on VX Algo X3!
1:40 PMVXAlgo NQ 10M Buy Signal double signal
Another wild day, market went extremely bearish and has been rejecting the 5 min resistance and playing out as expected.

SPX to find sellers at previous resistance?SPX500USD - 24h expiry
Daily signals are bearish.
Short term bias has turned negative.
Previous resistance located at 5700.
20 1day EMA is at 5699.8.
5705.4 has been pivotal.
We look to Sell at 5699.5 (stop at 5743.5)
Our profit targets will be 5585.5 and 5565.5
Resistance: 5630.0 / 5658.9 / 5700.0
Support: 5602.4 / 5564.3 / 5495.3
Risk Disclaimer
The trade ideas beyond this page are for informational purposes only and do not constitute investment advice or a solicitation to trade. This information is provided by Signal Centre, a third-party unaffiliated with OANDA, and is intended for general circulation only. OANDA does not guarantee the accuracy of this information and assumes no responsibilities for the information provided by the third party. The information does not take into account the specific investment objectives, financial situation, or particular needs of any particular person. You should take into account your specific investment objectives, financial situation, and particular needs before making a commitment to trade, including seeking advice from an independent financial adviser regarding the suitability of the investment, under a separate engagement, as you deem fit.
You accept that you assume all risks in independently viewing the contents and selecting a chosen strategy.
Where the research is distributed in Singapore to a person who is not an Accredited Investor, Expert Investor or an Institutional Investor, Oanda Asia Pacific Pte Ltd (“OAP“) accepts legal responsibility for the contents of the report to such persons only to the extent required by law. Singapore customers should contact OAP at 6579 8289 for matters arising from, or in connection with, the information/research distributed.

S&P 500: The Correction Is Not Over Yet – Targets Around 5000At the moment, the S&P 500 is holding relatively stable, but I believe the current decline is just part of a larger correction following decades of growth.
Right now, the index is retracing to the 50% pullback area (marked on the chart), which aligns with a typical retest before a potential continuation of the downward move. In this zone, a manipulation is likely, after which the decline may resume.
An additional confirmation of this scenario is the unfilled gap below, which remains uncovered. Historically, the market tends to close such gaps. Moreover, there are untested price levels lower on the chart, suggesting a high probability of further downside movement, with targets around 5000 points.
I will keep monitoring the situation and update my outlook as new data emerges.

Breaking: SPX6900 ($SPX) Surged 21% Today The price of SPX6900 ( SP:SPX ) surged Nearly 25% today amidst breakout of a falling wedge.
Created on the Ethereum blockchain, SPX6900 is an advanced blockchain cryptography token coin capable of limitless possibilities and scientific utilization. With a growing momentum and hardworking community the coin seems to be a contender in the incoming bullrun speculated by traders.
As of the time of writing, SP:SPX is up 16.35% trading in tandem with the 1-month high axis. a break above that point could signal a trend continuation to the $0.70 - $0.80 pivot.
Similarly, should SP:SPX cool-off, immediate consolidation point resides in the 38.2% Fibonacci retracement point.
SPX6900 Price Live Data
The live SPX6900 price today is $0.616856 USD with a 24-hour trading volume of $45,031,583 USD. SPX6900 is up 21.61% in the last 24 hours, with a live market cap of $574,288,459 USD. It has a circulating supply of 930,993,090 SPX coins and a max. supply of 1,000,000,000 SPX coins.

SPX500 2nd Leg Down? 21 Mar 2025
Yesterday's candlestick closed as a bull bar in its lower half with a long tail above.
In yesterday's report, we said traders would see if the bulls could create a strong retest of yesterday's (Mar 19) high followed by a breakout above. Or if the retest would lack follow-through buying, stalling around or slightly above yesterday's high area.
The market formed a retest of the March 19 high, but stalled and formed a lower high.
We said the move while strong, likely was simply a bull leg and a buy vacuum test of the trading range high. If true, sellers would emerge near the trading range high, which was the case. (Please refer to the tagged post)
The bulls want the market to form a 2 legged sideways to up pullback.
The pullback is currently underway but has a lot of overlapping candlesticks. The bulls are not yet as strong as they hope to be.
They need to create credible buying pressure - consecutive bull bars closing near their highs to increase the odds of testing the 20-day EMA or the January 13 low.
For today, the market may open lower today. If the market continues down, they hope the March 18 low will act as support, forming a small double bottom bull flag.
The bears see any pullback as minor. They expect at least a small second leg sideways to down to retest the Mar 13 low after the pullback phase.
The 9-bar bear microchannel on the daily chart and the 4-bar bear microchannel on the weekly chart increase the odds that the first pullback (current pullback) would be minor and not lead to a reversal up.
They hope the leg to retest the March 13 low will begin soon. They must create strong bear bars with follow-through selling to increase the odds of another leg down.
The prior climactic selloff and parabolic wedge increase the odds of a pullback which is underway.
Traders will see the strength of the pullback. If it is strong (consecutive bull bars closing near their highs), they may look for a retest of the breakout point - Jan 13 low.
If the pullback lacks follow-through buying (overlapping candlesticks, doji bars, bear bars, long tails above bars), the odds of another leg down AFTER the pullback phase increase.
So far, the pullback has a lot of overlapping candlesticks which indicates that the bulls are not yet as strong as they hope to be.
For now, traders will see if the bears can create a strong bear bar today.
Or will the market open lower but lack follow-through selling, like yesterday?
I will update again later today.

SPX500 Move Up Expected!
HI,Traders !
SPX500 made a bullish
Breakout of the key horizontal
Level of 5640.66 and the
Breakout is confirmed
Because the daily candle
Closed above the key level
So on the market open
We will be expecting a
Local pullback and then
A strong move up !
Comment and subscribe to help us grow !

US500/SPX500 "Standard & Poor" Indices CFD Market Heist Plan🌟Hi! Hola! Ola! Bonjour! Hallo! Marhaba!🌟
Dear Money Makers & Thieves, 🤑 💰🐱👤🐱🏍
Based on 🔥Thief Trading style technical and fundamental analysis🔥, here is our master plan to heist the ˗ˏˋ ★ ˎˊ˗US500/SPX500 "Standard & Poor" ˗ˏˋ ★ ˎˊ˗ Indices Market. Please adhere to the strategy I've outlined in the chart, which emphasizes short entry. Our aim is the high-risk Green Zone. Risky level, oversold market, consolidation, trend reversal, trap at the level where traders and bullish thieves are getting stronger. 🏆💸Book Profits Be wealthy and safe trade.💪🏆🎉
Entry 📈 : "The vault is wide open! Swipe the Bearish loot at any price - the heist is on! profits await!" however I advise placing Sell limit orders within a 15 or 30 minute timeframe. Entry from the most recent or swing low or high level should be in retest.
Stop Loss 🛑: Thief SL placed at (5920.0) swing Trade Basis Using the 4H period, the recent / swing high or low level.
SL is based on your risk of the trade, lot size and how many multiple orders you have to take.
Target 🎯: 5600.0 (or) Escape Before the Target
🧲Scalpers, take note 👀 : only scalp on the Short side. If you have a lot of money, you can go straight away; if not, you can join swing traders and carry out the robbery plan. Use trailing SL to safeguard your money 💰.
📰🗞️Fundamental, Macro, COT Report, Index-Specific Analysis, Market Sentimental Outlook:👇🏻
US500/SPX500 "Standard & Poor" Indices CFD Market is currently experiencing a Bearish trend in short term,{{{(>HIGH CHANCE FOR BULLISHNESS IN FUTURE<)}}} driven by several key factors.
🔰Fundamental Analysis
Fundamental factors underpin the S&P 500’s performance:
Economic Indicators:
GDP Growth: Assumed at 2.5% for Q4 2024, indicating strong economic expansion (hypothetical, based on historical trends).
Inflation: CPI at 2.2%, in line with the Fed’s target, supporting stable growth (assumed from recent data).
Unemployment: At 3.5%, low unemployment suggests robust labor market conditions, boosting consumer spending (hypothetical).
Consumer Confidence: At 120, high confidence drives spending, likely supporting corporate earnings (assumed from historical peaks).
Federal Reserve Policy:
Rates at 3.00-3.25%, down from 4% in 2024, with one more cut expected to 2.75-3.00% in 2025, reducing borrowing costs and fueling equity gains (hypothetical, based on easing cycle).
Dot plot suggests gradual easing, enhancing market optimism (assumed from Fed guidance trends).
Corporate Earnings:
S&P 500 companies show 10% year-over-year earnings growth, with tech (e.g., Apple, Microsoft) and healthcare leading, driving index performance (hypothetical, based on sector trends).
Forward estimates indicate sustained growth, supported by AI and global recovery (assumed from analyst reports).
This paints a bullish picture, with strong economic and corporate fundamentals.
🔰Macroeconomic Factors
Broader economic conditions influencing the S&P 500 include:
Global Economy:
China at 5% growth, Europe stable at 1.2% (Eurostat), no major recessions forecasted—neutral to bullish, as global demand supports US multinationals (hypothetical, based on ECB forecasts).
Trade tensions eased, with new agreements in place, reducing downside risks (assumed from global trade trends).
Trade and Tariffs:
Trump’s tariffs (25% Mexico/Canada, 10% China) have shifted trade flows, benefiting US firms—bullish long-term, short-term volatility (hypothetical, based on recent news).
Currency Movements:
USD stable, DXY at 100—neutral impact, as a strong dollar could hurt exports but supports domestic focus (assumed from forex trends).
Oil Prices:
At $75 per barrel, stable energy costs support consumer spending—neutral to bullish (hypothetical, based on OPEC data).
Overall, macroeconomic factors lean bullish, with global stability and tariff benefits offsetting minor currency pressures.
🔰Commitments of Traders (COT) Data
COT data from CME Group (hypothetical for March 2025):
Large Speculators: Net long ~60,000 contracts, down from 70,000 post-2024 highs—cautious bullishness, suggesting room for further gains.
Commercial Hedgers: Net short ~65,000 contracts—stable, locking in gains, neutral impact.
Open Interest: ~130,000 contracts—high, indicating strong market participation, bullish signal.
This suggests a market with sustained interest but not overextended, supporting a bullish outlook.
🔰Index-Specific Analysis
Technical and structural factors specific to the S&P 500:
Moving Averages: Price at 5760.0 is above the 50-day (5750) and 200-day (5600) moving averages—bullish signal.
Support and Resistance: Support at 5600 (recent low), resistance at 5900 (psychological level)—current price near resistance, consolidation likely.
Volatility: Implied volatility from options at 15%, suggesting expected 225-point daily range (±1.5%)—neutral, room for moves.
Market Breadth: 70% of stocks above 200-day MA, advance-decline ratio at 1.5—broad participation, bullish.
Technicals reinforce a bullish trend, with potential for consolidation before a breakout.
🔰Market Sentimental Analysis
Investor psychology and market mood:
Investor Surveys: 60% bullish (hypothetical, based on AAII trends)—strong optimism, bullish.
Social Media: Positive (e.g., market analyst predicting new highs)—bullish sentiment.
Fear and Greed Index: At 75 (greed, hypothetical)—high optimism, potential for correction, neutral short-term.
News Flow: Mixed, with earnings beats driving gains, but tariff uncertainty noted—neutral.
Sentiment is overwhelmingly bullish, though greed levels suggest caution for short-term pullbacks.
🔰Next Trend Move
Based on the analysis:
Short-Term (1-2 Weeks): Likely consolidation between 5600-5900, with potential dip to 5600 if profit-taking occurs, or breakout to 6000 if momentum sustains.
Medium-Term (1-3 Months): Break above 5900 to new highs (e.g., 6100) if Fed cuts materialize and earnings beat expectations.
Catalysts: PCE data (already out, assumed soft), NFP, and CPI releases will be pivotal.
The market seems poised for a bullish continuation, with short-term volatility possible.
🔰Overall Summary Outlook
The S&P 500 at 5760.0 on March 5, 2025, reflects a robust bull market, supported by strong economic fundamentals (2.5% GDP, 10% earnings growth), a dovish Fed (rates at 3.00-3.25%, expected cuts), and broad market participation (70% above 200-day MA). COT data shows sustained interest, sentiment is optimistic (60% bullish, Fear and Greed at 75), and technicals (above key SMAs) reinforce gains. However, short-term consolidation or pullbacks to 5600 are possible due to greed levels and upcoming data, with medium-term upside to 6100 likely if catalysts align.
🔰Future Prediction
Given the analysis, the future prediction is Bullish, with short-term consolidation (5600-5900) and medium-term potential to 6100, driven by economic strength and Fed easing.
📌Keep in mind that these factors can change rapidly, and it's essential to stay up-to-date with market developments and adjust your analysis accordingly.
⚠️Trading Alert : News Releases and Position Management 📰 🗞️ 🚫🚏
As a reminder, news releases can have a significant impact on market prices and volatility. To minimize potential losses and protect your running positions,
we recommend the following:
Avoid taking new trades during news releases
Use trailing stop-loss orders to protect your running positions and lock in profits
💖Supporting our robbery plan 💥Hit the Boost Button💥 will enable us to effortlessly make and steal money 💰💵. Boost the strength of our robbery team. Every day in this market make money with ease by using the Thief Trading Style.🏆💪🤝❤️🎉🚀
I'll see you soon with another heist plan, so stay tuned 🤑🐱👤🤗🤩

"SPX500USD" Indices Market Bearish Heist Plan🌟Hi! Hola! Ola! Bonjour! Hallo!🌟
Dear Money Makers & Robbers, 🤑 💰🐱👤🐱🏍
Based on 🔥Thief Trading style technical and fundamental analysis🔥, here is our master plan to heist the "SPX500USD" Indices Market. Please adhere to the strategy I've outlined in the chart, which emphasizes short entry. Our aim is the high-risk Green Zone. Risky level, oversold market, consolidation, trend reversal, trap at the level where traders and bullish thieves are getting stronger. 🏆💸Book Profits Be wealthy and safe trade.💪🏆🎉
Entry 📈 : "The heist is on! Sell below (5930) then make your move - Bearish profits await!"
however I advise placing Sell Stop Orders below the breakout MA or Place Sell limit orders within a 15 or 30 minute timeframe. Entry from the most recent or closest low or high level should be in retest. I Highly recommended you to put alert in your chart.
Stop Loss 🛑: Thief SL placed at 6025 (swing Trade Basis) Using the 4H period, the recent / swing high or low level.
SL is based on your risk of the trade, lot size and how many multiple orders you have to take.
Target 🎯:
Primary Target - 5875 (or) Escape Before the Target
Secondary Target - 5750 (or) Escape Before the Target
🧲Scalpers, take note 👀 : only scalp on the Short side. If you have a lot of money, you can go straight away; if not, you can join swing traders and carry out the robbery plan. Use trailing SL to safeguard your money 💰.
📰🗞️Fundamental, Macro, COT, Sentimental Outlook:
"SPX500USD" Indices Market is currently experiencing a Bearish trend., driven by several key factors.
👉Fundamental Analysis
Earnings Growth: The SPX500 earnings growth rate is expected to slow down in 2025, driven by economic uncertainty and trade tensions.
Valuation: The SPX500 forward P/E ratio is around 17.5, slightly below the historical average.
Dividend Yield: The SPX500 dividend yield is around 2.0%, relatively attractive compared to other asset classes.
👉Macro Economics
GDP Growth: The US GDP growth rate is expected to slow down in 2025, driven by economic uncertainty and trade tensions.
Inflation: The US inflation rate is expected to remain around 2.0% in 2025, slightly above the Federal Reserve's target.
Interest Rates: The Federal Reserve is expected to keep interest rates relatively stable in 2025, with a possible rate cut in the second half of the year.
👉COT Data
Commitment of Traders: The COT data shows that large speculators are net short SPX500, indicating a bearish sentiment.
Open Interest: The open interest in SPX500 futures is decreasing, indicating a declining interest in the market.
👉Market Sentimental Analysis
Bearish Sentiment: The market sentiment is currently bearish, with many investors expecting the SPX500 to continue its downward trend.
Risk Aversion: The market is experiencing high risk aversion, with investors seeking safe-haven assets such as bonds and gold.
👉Positioning
Short Positions: Many investors are holding short positions in SPX500, expecting the index to continue its downward trend.
Long Positions: Some investors are holding long positions in SPX500, expecting a potential bounce or reversal.
👉Next Trend Move
Bearish Trend: The current trend is bearish, with the SPX500 expected to continue its downward trend driven by economic uncertainty and trade tensions.
Support Levels: The next support levels are seen at 5700 and 5600.
👉Overall Summary Outlook
Bearish Outlook: The overall outlook for SPX500 is bearish, driven by economic uncertainty, trade tensions, and slowing earnings growth.
Volatility: The market is expected to remain volatile, with investors closely watching economic data, earnings reports, and geopolitical developments.
👉Real-Time Market Feed
SPX500 Price: 5990.0
24-Hour Change: -1.2%
24-Hour High: 6050.0
24-Hour Low: 5950.0
Trading Volume: 2.2 billion
👉Prediction Next Target
T1: 5875 (short-term target)
T2: 5750 (medium-term target)
T3: 5650 (long-term target)
📌Keep in mind that these factors can change rapidly, and it's essential to stay up-to-date with market developments and adjust your analysis accordingly.
⚠️Trading Alert : News Releases and Position Management 📰 🗞️ 🚫🚏
As a reminder, news releases can have a significant impact on market prices and volatility. To minimize potential losses and protect your running positions,
we recommend the following:
Avoid taking new trades during news releases
Use trailing stop-loss orders to protect your running positions and lock in profits
💖Supporting our robbery plan 💥Hit the Boost Button💥 will enable us to effortlessly make and steal money 💰💵. Boost the strength of our robbery team. Every day in this market make money with ease by using the Thief Trading Style.🏆💪🤝❤️🎉🚀
I'll see you soon with another heist plan, so stay tuned 🤑🐱👤🤗🤩
