S&P500 Index Analyze!!!First, I have to say that if you want to know about the road map of the S&P500 Index, please look at my previous post about S&P500 Index (It ran as I expected✅).👇
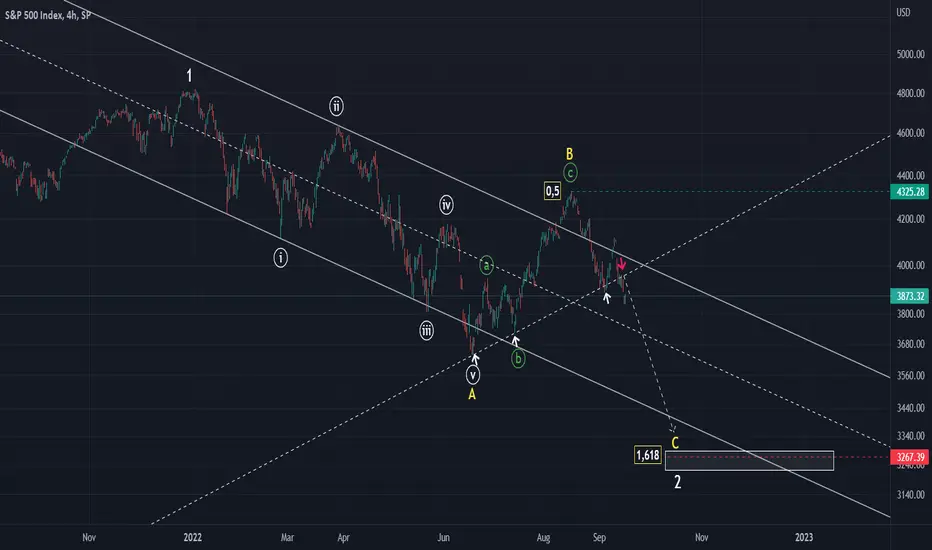
S&P500 Index is near the trend line, and I expect that it goes down and making the Expanding Leading Diagonal.
I showed you the end of wave 5 in my chart.
Also, we can see the Hidden Divergence (HD-) between MACD Indicator and price.👇
❗️Note❗️: If S&P500 Index breaks the trend line, my scenario will change.
S&P500 Index Analyze Daily Timeframe(Log Scale)
Do not forget to put Stop loss for your positions (For every position you want to open).
Please follow your strategy, this is just my idea, and I will be glad to see your ideas in this post.
Please do not forget the ✅' like '✅ button 🙏😊 & Share it with your friends; thanks, and Trade safe.
US SPX 500

SPX one more big bear channel visualizationA slightly lower into my 3802-17 level will be a perfect hit of the lower trend channel.
NQ already broke its on to the downside! Important to note
A right shoulder fake rally will be perfect before it really drops into Oct/Nov lows
Also dont be surprised if it breaks, then look for the retest of the broken trend channel from below
P.S. Dont forget to like (click star-ship button) my posts, so it gets pushed up on TV for others to see as well.
Thanks in advance!

SPX possible H&S pattern targets 3500 or soI have changed the color theme on my chart and removed everything I could to make it clear for those who are having troubles reading my charts.
Look what I just saw!
Let me introduce a possible pathway after tomorrows FOMC announcement.
On June 15th we have spike up and had a big range day. Then next day the price gaped down and made new lows.
I see kinda similar pathway were we either make a new low in am - 3802-17 and maybe 3795, then rally up to 3925-65SPX level to make a right shoulder. (I prefer 3955-65 in case we see low of 3800 in am)
Then the price can start moving fast and get below 3700 even by Friday, bottoming on the 27th in Tuesday turn around structure.
That low can be as deep as 3500! I have fibs supporting this possible move down from 3680 to 3500
So my plan for tomorrow, exit shorts (partly) in am and go long for a FOMC squeeze. Then short the close and hold into the 27th low.
Please do your own risk management as the price can be very volatile and will take both sides in stops (been there done that)
22nd is a reversal day of whatever day we get tomorrow and should bottom or top on the 27th. So if in fact we see selling after the FOMC, then I will be looking for a long at the end of the day instead of shorting the hole.
- 3802-17, 3752 and 3721 are the support levels to watch!
I will leave this right here.
Feel free to share this update with anyone.
P.S. (Sometimes Im getting interesting comments like my charts make people seizures (those people dont even follow me).
Just want to make it clear, that Im not here to make it pretty, Im not selling a anything to anyone or make money out of my posts. I do post my updates just to share with those who will appreciate that work and use it for their own homework. So please no need to even follow or see my charts if you cant read them, that means you're very new to the markets and need to do more study and learn simple stuff like moving averages, support/resistance lines as well as trendlines etc. All my charts are working progress, please respect that as well as my time)

SPX Daily MACD zoomed inThere is plenty of room for MACD to go lower and still stay in the channel.
current MACD is showing a hidden positive divergence, but again, the price can make new lows while MACD a higher low.

SPX to hit 3802-17I missed am short, now waiting for 3802-17 to go long.
Wont rule out a move down to 3750 tomorrow before FOMC
The way I see it is that we will bottom today tomorrow and rally back to 3880+ after the FOMC decision, then completely erase the move by Fri.
Should bottom on the 17th and rally up into EOM early Oct, then continue lower
Dont try to trade this, very choppy designed to take both sides. I got chopped with stops here, now entered with short and exit at my 3802-17SPX level
P.S. Dont forget to like (click star-ship button) my posts, so it gets pushed up on TV for others to see as well.
Thanks in advance!

SPX to retest broken trendline from the bottomMain resistance for the SPX is:
- 3942
- 3952-60
Support cluster is still the same:
- 3802-3817
- 3750-55
and much lower (check my last SPX update)
Im currently long ES and some SPY calls and will be adding to my swing short NQ position tomorrow and ideally on Wednesday.
- 3955 and 3975 are the 2 numbers where I will be adding to my short position.
In case of a super bullish case (like the one in NQ going to 12700), next resistance level to short is:
- 4025-35
So far Im looking for lower level, again please see my latest SPX update (link above)
And I think there is one big move down is coming up very soon.
Ideally we bottom on the 27-29th and rally hard into early Oct where we should see lower prices printed before this is over and another 11-14% rally starts
Have a good night
P.S. Dont forget to like (click star-ship button) my posts, so it gets pushed up on TV for others to see as well.
Thanks in advance!

S&P500 , SPX ANALYSIS , 1 DAYConsidering the news that will be released from the US Federal Reserve
and the weakening of risky assets
I think we will see the price drop to at least the previous floor, that is, to $3720.

SPX is riding the decending resisnace lineDidnt do much except covered ES short from last night entry.
3886 is a very important resistance level.
Looking at ES small timeframe chart, there is a possible IHS is developing, but so muted, it can fail, but I will go long at 73ES and 68ES (might extend to 58ES) with a stop for tomorrow's exit.
Still want some squeeze into tomorrow and fail there

SP500 direction for next days and weeks...Hello all,
I would like to do some comparison here. On the LEFT side you can see chart pattern on 3D timeframe during the 2008 mortgage crisis in US. What happened?
From TA perspective - we can see broadening descending wedge or channel where price was strongly rejected from white MA (green circle) - what happened next you can see on the chart = BEARISH SCENARIO.
Meaning FED will rapidly increase interest rates in near future or we will have another conflict or whatever like this. I hope just for increasing interest rates.
ON the RIGHT side you can see my price prediction - yellow line with the BULLISH SCENARIO
BUT we have there the same chart pattern like we had in 2008. Very similar or same... so what we can expect? For bullish scenario FED must start print money again (quantitative easing). BUT i dont think so they can do it right now - because it will cause a higher inflation again...
So just small recap of the chart on the RIGTH SIDE:
From TA perspective - we can see broadening descending wedge or channel where price was strongly rejected from white MA (green circle) - we need buz pressure to not collapse like in 2008 (ABCDE) on the right chart...
IF BEARISH SCENARIO comes out, we can see SP500 under 2500 - BUT this will be one of the biggest economic crisis ever... Do the FED really want it? I have some doubts here because Chinesse currency juan can be new number one currency if usd falls...
I think we will see the result in next months... personally I think that downside is more likely to happen...not sure if really under 2500 but most likely under 3500...
PEACE and have a great day
Svarog

S&P500 Sell SignalSP500 created a down trend. it broke out of the uptrend last month, it hasnt shown any signals of a buying trend.

SPX Weekend quick updateI was busy all weekend, this update will be quick.
Still seeing this as a bear market, well it is for the past 9 months wasnt it.
The main trend is still down!
Please note those purple lines are the unfilled gaps, will be gone each time the price will fill those, otherwise act as magnet to fill, depends on the trend
Looking at the price action, I can see 1-2, 1-2 development (Im not an EWT pro or do I want to be at this point) to the downside and much lower levels into Oct/Nov low.
Also think, that this bear market will merge into Q1 2023 and should bottom sometime in Apr/early May
As for this upcoming week of Sep 19th:
- Im looking for a day or 2 muted bounce and continue lower after the FOMC decision.
- If we see the opposite, a drift lower into the FOMC decision, then I would be looking for a long right before the announcement.
I think we will bottom this week on the 21st-22nd, or make a intraday low next week 27-29th.
Friday price action wasnt what I expected and limited to the downside by holding 3850 level.
I dont find that level important to hold and think its a low level of support at this point.
The most important thing on Friday was this - the price gaped down below my 3880-86 support level, which was much stronger then 3850 level.
So I think this can still get to 3802-17SPX early next week, ideally on Monday and then move up into a muted action to 3950-60SPX level and reverse lower from there.
Main weekly resistance is 4155-60 with 4015-25 in the middle.
Support levels:
- 3802-17
- 3750-55
- 3735-40
- 3720
- below last number nothing but air till 3636 and my ideal target of 3580, 3550-55 and 3500 even.
My main target for this move is at 3200-10SPX! And I think we will see lower into 2020 higher lows in 2023
Im looking to buy longs tomorrow in 3802-17 zone or just short 3950 zone.
No need in over trading this but the levels of importance!
Have a great weekend, do not over trade, this bear market will get both sides, wait for a good setup to take with higher R/R odds
P.S. Dont forget to like (click star-ship button) my posts, so it gets pushed up on TV for others to see as well.
Thanks in advance!

ES1! SPX500USD 2022 SEP 19 Week
ES1! SPX500USD 2022 SEP 19 Week
ES's long trap played out on Monday, later than the other 2 US indices,
before the shorts took over on Tue 13 Sep.
Friday's last 2 H3 up bars happened on very high volume. Keep stops
tight if long as there is likely selling into the up move.
Possible Scenarios are considered:
1) Temporary long opportunity if 3853-3902 is supported
2) Short if test and rejection of rotation area (circled on chart) /
rejection of 4051 / 3981
Weekly: High vol down bar close off high = demand coming in
Daily: Ave vol down bar close toward high = demand > supply
H3: Ultra high vol up demand bar followed by 2 very high vol up bars
= caution as there may be selling into the up bars
Price reaction levels:
Short = Test and Reject | Long = Test and Accept
4303 4175 4051
3981 3903-3853 3742
Remember to like and follow if you find this useful.
Have a profitable trading week.

SPXSPX is at the end of a cycle and assuming that the crisis will continue, it is in a C wave in my opinion. My estimated target price for wave C is as I have shown.
SPX500 Breakout Short!SPX500 was trading in an uptrend
Along the rising support
But now we are seeing a bearish breakout
Of the support confluence
Which is now a resistance cluster
From where a further move down
It to be expected After retesting an area 3908.77

Posted this on the 12th of Sep, playing out so well!!!I did post this warning on Sep 12th as well as emailed to those who are on my email list.
Check the MACD on that day and now! It created a hook and continued lower, bearish!
Some people noted and didnt get trapped on that day, it was daily high close
DO NOT GET TRAPPED Today!!!
Dont short this red whole!
Have to leave, will be back in few hours, again dont get trapped on the short side today!
P.S. Dont forget to like (click star-ship button) my posts, so it gets pushed up on TV for others to see as well.
Thanks in advance!

Watch for S1 to hold on closing level!S1 is right at first gap to fill 3831, can act as a very good support.
So again, its a day when I will be buying longs, question is from what price.
Ideally I buy at 3802-18 level, but might buy at higher price if I see that S1 holding into the close and no new lows.
Please note
Futs can always extend into AH's session
DO NOT GET TRAPPED Today!!!
Dont short this red whole today!
P.S. Dont forget to like (click star-ship button) my posts, so it gets pushed up on TV for others to see as well.
Thanks in advance!
