NQ Intra Day Bearish expectation Looking for that 4hr high too be respected thus creating SMT with ES, hopping on the 10am candle run
US SPX 500

SPX500USD Will Go Up! Long!
Please, check our technical outlook for SPX500USD.
Time Frame: 12h
Current Trend: Bullish
Sentiment: Oversold (based on 7-period RSI)
Forecast: Bullish
The market is testing a major horizontal structure 5,779.8.
Taking into consideration the structure & trend analysis, I believe that the market will reach 5,887.5 level soon.
P.S
Please, note that an oversold/overbought condition can last for a long time, and therefore being oversold/overbought doesn't mean a price rally will come soon, or at all.
Like and subscribe and comment my ideas if you enjoy them!

SPX500USD Will Move Lower! Sell!
Here is our detailed technical review for SPX500USD.
Time Frame: 12h
Current Trend: Bearish
Sentiment: Overbought (based on 7-period RSI)
Forecast: Bearish
The market is approaching a key horizontal level 5,735.3.
Considering the today's price action, probabilities will be high to see a movement to 5,643.6.
P.S
Overbought describes a period of time where there has been a significant and consistent upward move in price over a period of time without much pullback.
Like and subscribe and comment my ideas if you enjoy them!

SPX500 Will Fall!FOREXCOM:SPX500 is trading in a
Downtrend and the indice
Is making a pullback
From the horizontal resistance
Of 5771.33 from where
We will be expecting a
Further move down !

November Trading Competition Chart
Hello, traders.
If you "Follow", you can always get new information quickly.
Please click "Boost".
Have a nice day today.
-------------------------------------
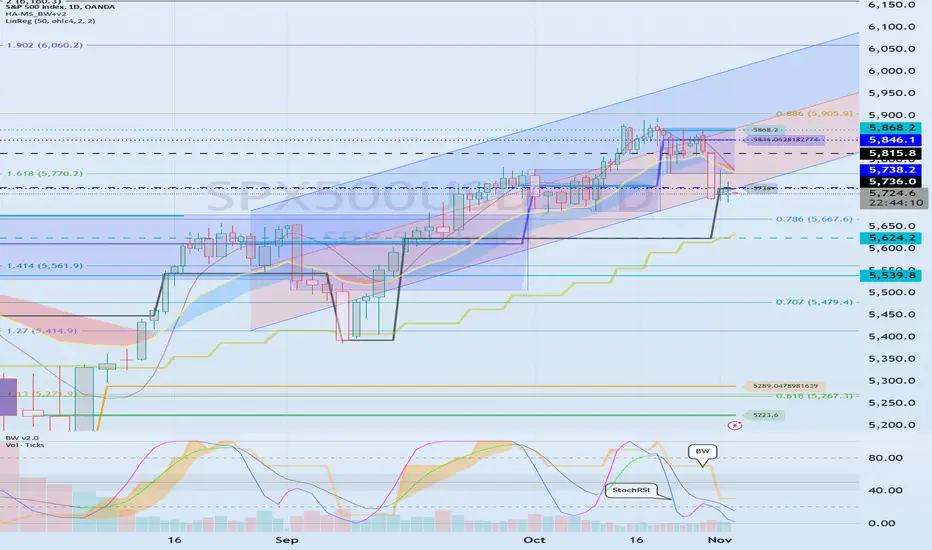
(SPX500USD 1D chart)
In order to maintain the uptrend, it must rise above 5738.2 and be maintained.
Since the StochRSI indicator is currently expected to create a double bottom, if the StochRSI indicator rises in the oversold zone, it is highly likely to create a large uptrend.
Accordingly, I think the 5738.2 point is a very important support and resistance point.
-
(XAUUSD 1D chart)
BW(100) indicator is created at 2748.960, and HA-High indicator is created at 2734.472.
Accordingly, the point of observation is whether it can receive support and rise around 2734.472-2748.960.
-
The fact that BW(100), HA-High indicators are created means that a high point section has been formed.
Therefore, if it receives resistance from BW(100), HA-High indicators and falls, you should basically think that the decline is likely to continue until it meets BW(0), HA-Low indicators and respond accordingly.
Therefore, whether there is support around 2734.472-2748.960 is important.
-
Since the StochRSI indicator appears to have entered the oversold zone, we need to check where it is located when it rises in the oversold zone and maintains the state of StochRSI > StochRSI EMA.
-
(XAGUSD 1D chart)
The chart can be seen as already in the process of decline.
However, since it is maintaining an upward channel, we need to keep in mind the possibility of creating a pull back pattern.
Accordingly, the area around 3188144 is expected to be an important support and resistance zone.
The HA-High indicator is created at the 32.99790 point, and the BW(100) indicator is created at the 34.86 point.
Accordingly, there is a possibility that it will be restricted from breaking through the 3299790-34.86 zone upward.
-
(EURUSD 1D chart)
I think the 1.08821 point is a very important section in the trend.
I think it is likely to have difficulty turning into an upward trend until it rises above the M-Signal indicator on the 1W chart.
Therefore, I think it would be advantageous to proceed with a trade after confirming support near 1.08821.
-
(WTICOUSD 1D chart)
The oil chart is in a reverse arrangement.
Accordingly, I think it would be advantageous to trade with a sell (SHORT) position.
It is currently rising above 71.6167 and rising above the M-Signal indicator on the 1D chart.
In order to maintain this rise, it needs to be maintained around 71.955.
-
HA-Low, HA-High indicators are indicators created to trade using the Heikin-Ashi chart.
The fact that the HA-Low indicator was created means that a low point range has been formed.
Therefore, if it is supported near HA-Low and rises, you should basically think of a response plan by thinking that it will continue to rise until it meets the HA-High indicator.
The HA-Low or HA-HIgh indicators are designed to display box ranges differently from other indicators.
Therefore, in order to escape the low point range formed by the HA-Low indicator, it must rise above the upper point of the HA-Low indicator box.
Therefore, it can be said that it has escaped the low point range if it rises and is maintained above the Fibonacci ratio of 0.618 (72.606).
-
StochRSI indicator is not a universal indicator,
but basically
- When the StochRSI indicator is above the 50 point, you should focus on finding a time to sell,
- When it is below the 50 point, you should focus on finding a time to buy.
From that perspective, I think the current rise is more likely to be a rebound rather than a rise.
-
(BTCUSD 1D chart)
The important support and resistance areas from the current price position are as follows:
- 71288.90-72322.91
- 68343.64-69795.79
- 65910.71
The three areas above are important support and resistance areas.
-
As explained on the oil chart, since the StochRSI indicator is below the 50 point, you should focus on finding a time to buy.
Therefore, if you are trading for the first time, you can trade depending on whether there is support near 68343.64.
However, since the current trend is an upward trend, if you trade with a sell (SHORT) position, you need to respond quickly and briefly.
-
(ETHUSD 1D chart)
ETH is currently moving sideways in the box section.
Therefore, the trend is expected to be determined depending on which direction it deviates from the 2272.88-2707.12 section.
Therefore, you should think about trading within the box section and create a response plan.
Then, when it deviates from the box section, you should switch to a trading strategy to eat the trend.
-
Have a good time.
Thank you.
--------------------------------------------------
SPX500USD Will Go Down! Sell!
Please, check our technical outlook for SPX500USD.
Time Frame: 12h
Current Trend: Bearish
Sentiment: Overbought (based on 7-period RSI)
Forecast: Bearish
The market is on a crucial zone of supply 5,736.0.
The above-mentioned technicals clearly indicate the dominance of sellers on the market. I recommend shorting the instrument, aiming at 5,643.6 level.
P.S
Overbought describes a period of time where there has been a significant and consistent upward move in price over a period of time without much pullback.
Like and subscribe and comment my ideas if you enjoy them!

SPX500 Potential Short!SPX500 made a strong
Move upwards and the indice
Will soon retest a horizontal
Resistance of 5859.42 from
Where we will be expecting
A local bearish pullback
And a move down !

-United States PCE (October/2024)$USCPCEPEPIMM 0.3%
(October/2024)
source: U.S. Bureau of Economic Analysis
-The US core PCE price index, the Federal Reserve’s preferred gauge to measure underlying inflation, rose by 0.3% from the previous month in September of 2024, the highest gain in five months, following an upwardly revised 0.2% increase in August, matching market forecasts. Service prices rose by 0.3%, while goods prices decreased 0.1%.
Year-on-Year, core PCE prices rose 2.7%, the same as in August, but above forecasts of 2.6%. source: U.S. Bureau of Economic Analysis

S&P 500TREND ; The S&P 500 index is currently in an uptrend (Bullish), characterized by higher highs and higher lows since mid-August.
PLAN :
• The support zone around 5,670 acted as a base for a recent upward move.
• The 5,870 level seems to be a key resistance area, and price is currently testing this level.
• If the price breaks above the 5,870 resistance level, my potential target will be around 5,989.15.
• Note that the blue arrow indicates the measured move from the support level at 5,750 up to the resistance at 5,870, which could imply the projected target if this breakout occurs.

$spx going to 11k over the next 3 to 4 yearsIm expecting the current bull to continue for another few years, with a deep correction in between now and the expected target of 11 k, by 2028/29...
From there I expect SP:SPX to enter a sideways bear market such as the ones of 68/75 and 2000/2009 in order to form the 4th base of the secular run since 1929 (shown the comments).
Bears always get it wrong, because of their self-delusions about the world and often also themselves!
It's bulls who - due to their prescience and foresight - actually get to foresee tops in the market.
Bears never catch a top, if they do it's either by coincidence, luck or something a four year old could have seen, like the covid top... anyway... we see so much madness in the ideas section, it's even fun!

SPX500USD Is Bullish! Buy!
Please, check our technical outlook for SPX500USD.
Time Frame: 8h
Current Trend: Bullish
Sentiment: Oversold (based on 7-period RSI)
Forecast: Bullish
The market is on a crucial zone of demand 5,836.4.
The oversold market condition in a combination with key structure gives us a relatively strong bullish signal with goal 5,891.1 level.
P.S
The term oversold refers to a condition where an asset has traded lower in price and has the potential for a price bounce.
Overbought refers to market scenarios where the instrument is traded considerably higher than its fair value. Overvaluation is caused by market sentiments when there is positive news.
Like and subscribe and comment my ideas if you enjoy them!

Bearish Technical and news XAUUSD For next week, XAU/USD (gold) is projected to remain in a consolidation phase around the $2730-$2760 range as it encounters both support from safe-haven demand and resistance from potential profit-taking. Market factors like Federal Reserve rate expectations and geopolitical tensions in the Middle East may sustain demand for gold, with bullish sentiment intact if these factors persist. On the technical side, key support sits near $2710, while resistance appears around $2780, suggesting some potential for upward movement if the dollar weakens or global uncertainties intensify.
Analysts also suggest paying attention to U.S. economic data releases next week, particularly any Federal Reserve statements, which could influence investor sentiment towards safe-haven assets like gold. If data suggests slowing economic momentum, gold might break higher; conversely, strong U.S. data could limit gains or prompt slight retracements in XAU/USD .

SPX500/US500 "Standard & Poor" Money Heist Plan on Bearish SideOla! Ola! My Dear Robbers / Money Makers & Losers, 🤑💰
This is our master plan to Heist SPX500/US500 "Standard & Poor" Market based on Thief Trading style Technical Analysis.. kindly please follow the plan I have mentioned in the chart focus on Short entry. Our target is Green Zone that is High risk Dangerous level, market is oversold / Consolidation / Trend Reversal / Trap at the level Bullish Robbers / Traders gain the strength. Be safe and be careful and Be rich 💰.
Entry : Can be taken Anywhere, What I suggest you to Place Sell Limit Orders in 15mins Timeframe Recent / Nearest Swing High
Stop Loss 🛑: Recent Swing High using 1h timeframe
Attention for Scalpers : If you've got a lot of money you can get out right away otherwise you can join with a swing trade robbers and continue the heist plan, Use Trailing SL to protect our money 💰.
Warning : Fundamental Analysis news 📰 🗞️ comes against our robbery plan. our plan will be ruined smash the Stop Loss. Don't Enter the market at the news update.
Loot and escape on the target 🎯 Swing Traders Plz Book the partial sum of money and wait for next breakout of dynamic level / Order block, Once it is cleared we can continue our heist plan to next new target.
Support our Robbery plan we can easily make money & take money 💰💵 Follow, Like & Share with your friends and Lovers. Make our Robbery Team Very Strong Join Ur hands with US. Loot Everything in this market everyday make money easily with Thief Trading Style.
Stay tuned with me and see you again with another Heist Plan..... 🫂

SPX to turnaround?US500 - 24h expiry
Broken out of the wedge to the downside.
The formation has a measured move target of 5773.
An overnight positive theme in Equities has led to a higher open this morning.
Expect trading to remain mixed and volatile.
The sequence for trading is lower lows and highs.
We look to Sell at 5847 (stop at 5865)
Our profit targets will be 5802 and 5792
Resistance: 5845 / 5847 / 5857
Support: 5815 / 5800 / 5785
Risk Disclaimer
The trade ideas beyond this page are for informational purposes only and do not constitute investment advice or a solicitation to trade. This information is provided by Signal Centre, a third-party unaffiliated with OANDA, and is intended for general circulation only. OANDA does not guarantee the accuracy of this information and assumes no responsibilities for the information provided by the third party. The information does not take into account the specific investment objectives, financial situation, or particular needs of any particular person. You should take into account your specific investment objectives, financial situation, and particular needs before making a commitment to trade, including seeking advice from an independent financial adviser regarding the suitability of the investment, under a separate engagement, as you deem fit.
You accept that you assume all risks in independently viewing the contents and selecting a chosen strategy.
Where the research is distributed in Singapore to a person who is not an Accredited Investor, Expert Investor or an Institutional Investor, Oanda Asia Pacific Pte Ltd (“OAP“) accepts legal responsibility for the contents of the report to such persons only to the extent required by law. Singapore customers should contact OAP at 6579 8289 for matters arising from, or in connection with, the information/research distributed.

SPX500 Will Go Down!SPX500 is going down
Now after the bearish
Breakout of the rising support
So after a potential local
Pullback we will be
Expecting a further move down

SPX500USD Will Grow! Long!
Please, check our technical outlook for SPX500USD.
Time Frame: 6h
Current Trend: Bullish
Sentiment: Oversold (based on 7-period RSI)
Forecast: Bullish
The market is on a crucial zone of demand 5,849.9.
The oversold market condition in a combination with key structure gives us a relatively strong bullish signal with goal 5,898.0 level.
P.S
The term oversold refers to a condition where an asset has traded lower in price and has the potential for a price bounce.
Overbought refers to market scenarios where the instrument is traded considerably higher than its fair value. Overvaluation is caused by market sentiments when there is positive news.
Like and subscribe and comment my ideas if you enjoy them!

SPX Grand Super Cycle- Possible Target $ 6000 to 7000There is no denial for a short-term pullback in the market, which will be healthy for the market.
Also lots of speculation/leverage in the current market
So the market maker may shake out the weak hands soon.
If we see SPX in the quarterly chart Wave 1 started in 1976 and ended in 2000 which was around 26 years.
Wave 2 was from 2001 to 2009. Total nine years for wave two corrections.
Wave 3 started in 2009 and correction in 2020 March was quick just two months correction (Most probable it should not be wave 4 correction). This can be a nest (each wave is built of smaller waves and, at the same time, each wave is a part of a bigger wave) and wave II of a second nest.
In my opinion, there would be two probable scenarios, the first one is SPX is still in wave three and it will go to 6000/7000 in this decades.
As if we go with SPX Grand Super Cycle then- possible targets can be 4700 to 5000 or more before a major crash (Wave 4 correction multi-years) happen and after the wave 4 correction wave 5 targets can be 6000 to 7000 or more
The second one is to complete wave 5 around 4600 to 5300 and 60-80 % crash to 1500 - 2000
So just remember a sharp correction/crash wouldn’t be the end of the world, it will be an opportunity to invest for the long term
Trend-based fib extension support the first scenario.
This is just my view please share your views in the comment section.
Thank you
Disclaimer
This idea does not constitute financial advice. It is for educational purposes only,

SP500 Secondary Trend. Bowl + handle. Resistance zone. 11 2023Logarithm. Large timeframe 1 week. On the chart a big bowl, you can say already with a handle, the price is testing the resistance of the previous market highs for the 3rd time (entering this zone). Breaking through it, this resistance will become a very strong support during the pumping (probability no more).
Simplifying the complex is the key to success.
Complicating the simple is a guarantee for your own confusion and mistakes on the plain.
It is based on knowledge and experience, which always leads to simplification of actions, not to complication !!!!
The SP500 index (500 companies of the global hegemon) is a reflection of the "health of the US economy" and, conventionally speaking, of all markets in the world. It is needed more as an indicator of the direction of other markets, including cryptocurrency (the market is maturing), than for trading as such.
The SP500 index (500 companies of the global hegemon) is a reflection of the "health of the US economy" and, conventionally speaking, of all markets in the world. It is needed more as an indicator of the direction of other markets, including cryptocurrency (the market is maturing), than for trading as such.
1️⃣ The increase in % rates will stop closer to the US presidential election, which is logical.
2️⃣ Before elections, the ruling party always shows the people the positive in its work for the people, even if there is none, i.e. injects money into the economy.
3️⃣ Handing out "free money" to potential voters before elections. Who will take it to the stock and cryptocurrency markets.
4️⃣ Changing the bear market cycle to a conventionally bullish one in 2024 and a bullish one in 2025.
5️⃣ Overcoming previous all-time highs, this is the third time we have tested this resistance of the SP500 index.
In other words, everything is as always. Before the elections, “everyone is good” and is pushing the economy up. USA together with the Fed. Only the so-called “black swan” can influence this, whether it is real (there are no such things) or staged, it doesn’t really matter. But, this is all a hypothetical probability, nothing more, which must always be kept in mind. Therefore, when the market rises, protect your profits with stop losses or hedge with correlated positions. As a rule, nothing happens, and if it does, the event itself is always inflated by the media and bloggers tens of times in importance, thereby creating the illusion of fear. Don't fall for such tricks, either.
The present, and especially the future, is not always a projection of a repetition of the past. It may be conditionally the same, but the details are radically different. This must always be remembered.
On linear, it looks like this:
The main trend of the index More than 100 years for clarity. Publication 11/22/2022
SP500 index. The whole trend. Anniversary 100 years
Vertical growth by +372% (madness, super pump)
Before the super collapse of the “Great Depression” Publication 11/22/2022
SP500 index. Pumping before the "Great Depression" Code 372-69
The game controls the people, not the people the game. The concept of a lot is always replaced by a little, a little more, until all their expectations “burst” from greed. This encourages some to become wiser, some, on the contrary, the closer the abyss, the cuter the devils.

S&P 500 (SPX) Hits All Targets! Bullish Rally CompletesThe S&P 500 Index has shown strong bullish momentum, with the long trade successfully reaching all profit targets.
Key Levels
Entry: 5719.98 – The long position was entered as the price broke above this level, confirming bullish sentiment.
Stop-Loss (SL): 5703.41 – Positioned below recent support to protect against potential downside risk.
Take Profit 1 (TP1): 5740.45 – The first target was hit, confirming the upward momentum.
Take Profit 2 (TP2): 5773.57 – The second target was achieved as the bullish trend continued.
Take Profit 3 (TP3): 5806.70 – The third target was reached, indicating continued strength in the market.
Take Profit 4 (TP4): 5827.17 – The final profit target was reached, marking a highly successful long trade.
Trend Analysis
The price is well above the Risological Dotted trendline, indicating a strong bullish trend. The steady upward movement suggests that the market sentiment is favorable for further gains, although all targets have been hit, marking the trade's conclusion.
The long trade on the S&P 500 Index successfully hit all profit targets, with the final target at 5827.17 signaling a strong rally. The upward momentum was supported by the Risological Dotted trendline, reflecting solid market conditions for bullish trades.

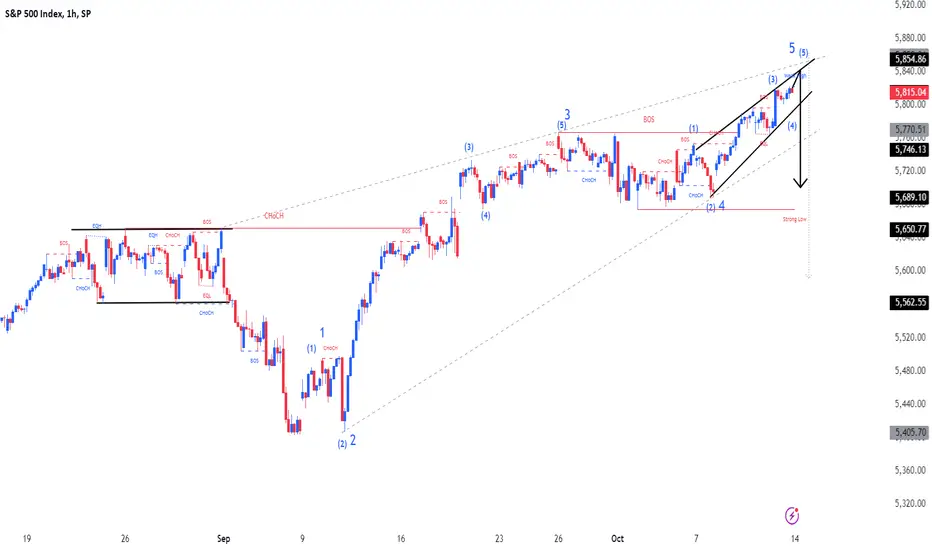
SPX500Pair : SPX500 Index
Description :
Completed " 12345 " Impulsive Waves
Break of Structure
RSI - Divergence
Rising Wedge as an Corrective Pattern in Short Time Frame and Long Time Frame
Demand Zone
Looking For Next Market Top AgainLooking for next top
Submillennium 1
Grand Supercycle 5 - green
Supercycle 1
Cycle 5 - orange
Primary 5 - blue
Intermediate 5 - pink
Minor 5 - yellow
Minute 5 - green
I will try to find the next top off simply modified wave theory.
First we need to set the baseline. I prefer the chart SPX500USD as it encompasses 23 hour trading during the week and can capture movement not always distinguishable in the SP:SPX chart.
My first step is always to identify the location of wave 3 (if it exists). I do this by using my Elliott Wave 3 Finder v2 in conjunction with my RSI triple confirm indicator and a simple RSI 9.
My wave 3 indicator will have a painted background at potential wave 3 locations, blue background for bearish reversals and pink for bullish reversals. My triple confirm RSI should signal in conjunction with the actual wave 3 point, red for bearish reversals and green for bullish reversals. My wave 3 indicator tends to spot wave 3 of 3 by displaying a gap between painted backgrounds. These indicators signal upon market close and are not considered finalized signals until the next bar begins.
My baseline is in the 2 month chart. I have worked through the historical SPX chart and believe we are in the fifth and final wave (Grand Supercycle 5) of a larger structure (Sub Millennium 1) that began in the 1800s. This specific wave 5 began at the market bottom in 2009, and we are only in the first (Supercycle 1) of five waves to the upside. I do not expect a catastrophic market top for many decades to come.
This chart picks up around 2004 to the current time. We are likely in Cycle wave 5 which began at the market low in October 2022. I have determined Cycle wave 3 to have ended at the peak at the beginning of 2022 based on the wave 3 indicator and RSI agreeing on a reversal point. In the moment, I would not have agreed the market topped in January 2022 as the indicators were still signaling. It is only on the preceding bar not producing a signal that an event is confirmed. Next I will determine common wave extensions off (Fibonacci levels) of Cycle wave 3's movement which began at the low in January 2016 at 1,806.25 and ended at 4,820.20 in January 2022. Wave 3 moved 3,013.95 points. Cycle wave 5 could move 123.6% to 138.2% of Wave 3's movement. These means a potential endpoint is between 5,531.49-5,971.53. This will be the orange outlined box in the following charts and the main chart above.
Next I will try to identify a current Primary wave 3 inside of Cycle wave 5. My indicators point to Primary wave 3 ending around the mid-July 2024 on the 2-day chart based on the gap in the wave 3 indicators. There is not an RSI 3 signal in the 2-day chart for Primary wave 3, but there was one for Minor wave 3 in Intermediate wave 3 in Primary wave 3 around February 12, 2024. We can attempt to confirm this by seeing where the end of Intermediate wave 5's movement extended too. If Intermediate wave 3 began January 5, 2024 and ended March 29, 2024, Intermediate wave 5 topped close to 161.8% of Intermediate wave 3's movement as seen below:
Based on this assumption, Primary wave 3 was likely over by mid-July 2024. The next Fibonacci wave extension levels for Cycle wave 5 could see this wave end between 108-123.6% of Primary wave 3's movement. This places a potential top between 5,806.48-6,052.34. This will be the light blue outlined box in the following charts and the main chart above.
We will next move inside of Primary wave 5 which possibly began at the low from the beginning of August 2024. In looking for Intermediate wave 3 inside of Primary wave 5, the indicators point to Minor wave 3 of Intermediate wave 3 occurring on September 19, 2024 and the Minute wave 3 inside of Minor wave 3 occurring on September 13. If we find the Intermediate wave 5 extension from this Intermediate wave 3, a potential top sits between 5,816.26-5,936.51. This will be the pink outlined box in the following charts and the main chart above.
Next we try to identify where we are in Intermediate wave 5. The 2-hour chart here indicates a possible Minor wave 3 occurring on October 9, 2024. A possible Minor wave 5 extension from here is a top between 5,825.38-5,868.50. This will be the yellow outlined box in the following charts and the main chart above.
We can attempt to go a final level deeper inside of Minor wave 5. We currently have Minute wave 3 indications based on the high from earlier today at 5826.90. If this is the end of Minute wave 3, Minute 5 could top between 5,834.16-5,857.61. This will be the yellow outlined box in the following charts and the main chart above. Based on a this wave set being over a small timeframe, this top could happen before next Tuesday. This is zone of interest for a near-term top.
This is purely theoretical, but Israel will likely strike at Iran soon. Iran has claimed they would respond quickly, but the prior instances saw long delays in the response. If Iran has an immediate response, a full on conflict would be underway in the Middle East. Not all wars are bad, but this one would likely impact oil and depending on the duration likely impact economies around the world. A contained conflict between a few nations likely would not spiral into a larger conflict, however, strong alliances on other side could turn this into a much greater event, closer to a world war situation. As drastic as this is, it could explain a potential near-term top. If conflict does not break out, we will likely see a short-term market top before continued movement higher and higher. Time will tell. Enjoy!

S&P 500 Bull Breakout: What Is Next?A strong daily bullish close hold could open the door for another bull rally on S&P500

The key is whether it can rise above 5878.7-6119.3
Hello, traders.
If you "Follow", you can always get new information quickly.
Please also click "Boost".
Have a nice day today.
-------------------------------------
I think this is the first time I've written an idea for the SPX500USD futures chart.
I'll give you an example of how to actually use it using the parallel channel that I introduced.
No matter how good an indicator or chart tool is added, if you don't know how to use it, chart analysis can be done in the wrong direction, so it is recommended that you familiarize yourself with the core interpretation method and how to use it before using it.
There are many examples of how to draw a trend line or how to draw a parallel channel, so you need to study how to draw it.
-----------------------------------------------
(SPX500USD 1M chart)
It is rising near the upper black line of the parallel channel.
Therefore, it is likely to face resistance near the black line and fall.
Accordingly, we need to check for support near 1 (5878.7) drawn with the right trend period Fibonacci Extension (Trend-Based Fib Extension) tool.
If it falls, we need to check if it can rise along the middle point (black dotted line) of the parallel channel.
However, since the section pointed to by the finger is an important support and resistance section, if it receives support near this section, it is highly likely that the upward trend will continue.
-
The left trend period Fibonacci Extension (Trend-Based Fib Extension) is drawn as the first rising wave on the 12M chart.
The trend-based Fibonacci extension on the right is drawn as the last rising wave on the 1M chart.
-
The section drawn as a square box corresponds to an important section among the Fibonacci ratios drawn on the chart, and when viewed as a parallel channel, it passes near the upper black line, so you can see that it corresponds to an important section.
-
(1D chart)
Since it is a futures chart, it is right to explain it on a time frame chart that can actually be traded, but since an idea can become useless as soon as time passes after publishing it, I will explain it based on the 1D chart.
I think the most important trend in futures trading is the trend of the 1D chart.
Therefore, when trading in the opposite direction of the trend of the 1D chart, you need to respond quickly and briefly.
-
A parallel channel was also drawn on the 1D chart.
The first point is designated as the point that is supported and rises from the middle point of the parallel channel drawn on the 12M chart, and the point that the finger points to is designated to draw the parallel channel.
The HA-MS indicator was used to draw the support and resistance points.
However, as shown in the chart above, the HA-MS indicator may be distracting when viewing the chart, so I am explaining it by disabling it.
-
The key is whether the price can be maintained by rising above 5741.6.
The 5741.6 point is the HA-High indicator point on the 1D chart, meaning that anything above this point is in the high range.
Since the StochRSI indicator is currently in the oversold range, it is more likely to lead to an additional decline.
Therefore, if the price falls, the key is whether it can be supported near the middle point of the parallel channel on the 1D chart, which is the section indicated by the circle.
That said, I don't think it's a good idea to enter a sell (SHORT) position right now.
The reason is that the StochRSI indicator is in the oversold section.
Therefore, if you want to trade with a sell (SHORT) position through scalping and day trading, you need to respond quickly and quickly.
Although the StochRSI indicator has entered the oversold section, the BW indicator is still rising.
Therefore, you should consider that there is a high possibility of a fake or sweep that pretends to fall.
Therefore, in order to make a big profit with a sell (SHORT) position, the BW indicator should be in a horizontal line at the highest point (100) and the StochRSI indicator should be falling in the overbought section.
-
Have a nice time.
Thank you.
--------------------------------------------------
