PULLBACKS AND CORRECTIONS 2009 TO DATESWell, the chart speaks for it self. i Might have missed one or two :-).
Spxanalysis

US Market Technicals Ahead (1 Feb – 5 Feb 2021)A big week for earnings, including reports from Amazon ($AMZN), Alphabet ($GOOGL), Exxon Mobil ($XOM) and Pfizer ($PFE). Stimulus negotiations in Washington and the first jobs report of 2021 (January) will all be major events to watch in the coming week, but they are likely to be overshadowed by the standoff between retail investors and Wall Street hedge funds. Investors will be watching closely to see if the short squeezes driven by retail investors continue in what could be a bumpy week for stocks.
Here’s what you need to know to start your week.
S&P500 (US Market)
The benchmark index ($SPX) ended the January flat, with a weekly loss of -3.47%. The correction have breached the multi-month long Trend Channel, along with 20SMA support convincingly, with the month’s highest transactional volume witnessed on 28th January. Additionally 50SMA was also breached on Friday session. This pullback affirms the technical Bearish Divergence between price rally and volume decline highlighted last week.
At the current junction, $SPX remains trading above 3,660 level, a classical support level established at the start of 2021. The breach of this support will see S&P500 trades at a cumulative loss for 2021.
1. The big squeeze
Last week saw retail investors using Robinhood and other apps drive a frenzied rally in shares of GameStop ($GME), AMC ($AMC) and other companies championed on social media platforms including Reddit’s WallStreetBets, that had been heavily shorted by hedge funds.
U.S. stock indexes suffered their biggest weekly fall since late October as the short squeezes saw hedge funds sell stocks to cover their losses, despite positive earnings results from market heavyweights like Apple ($AAPL) and Microsoft ($MSFT).
Some market watchers are concerned that the wild rally may be a fresh sign of overexuberance that could foreshadow volatility for the broader stock market, while others believe it is more of a sideshow.
2. Earnings
With quarterly earnings season in full swing, market participants are looking at whether companies can justify high valuations.
“By and large the surprises have been positive, even more so than typical and by and large companies are showing positive operating leverage where they are able to grow earnings a little bit faster than they are able to grow revenue,” said Ellen Hazen, portfolio manager at F.L.Putnam Investment Management in Wellesley, Massachusetts.
Tech giants Alphabet ($GOOGL) and Amazon ($AMZN) are both due to report after the market close on Tuesday, followed by Qualcomm ($QCOM), Snap ($SNAP) and Pinterest ($PINS) later in the week.
Some big names in the closely watched healthcare sector are also to report, including Pfizer ($PFE), GlaxoSmithKline ($GSK), AbbVie ($ABBV), Biogen ($BIIB), Gilead Sciences ($GILD), Merck ($MRK) and Bristol-Myers Squibb ($BMY).
3. January jobs report
The January nonfarm payrolls report will give markets the first look at the health of the labor market inherited by U.S. President Joe Biden.
The report is expected to show a slight uptick in hiring after the economy shed 140,000 jobs in December (mostly from restaurants and bars), but more substantial improvements are unlikely to come until there is a broader re-opening of the economy. The unemployment rate is expected to remain unchanged at 6.7% – almost twice the level that it was just prior to the pandemic.
Federal Reserve Chairman Jerome Powell last week said that the economic recovery hinges on the progress of the vaccination rollout. “There’s nothing more important to the economy than people getting vaccinated,” Powell said.

SPX500USD 2021 Jan 25 Week
SPX500USD 2021 Jan 25 Week
After the recent high showing supply, 2nd last bar again is a sign of weakness.
Besides, it has fallen out of channel and
If price broke 3820 and it becomes resistance
and let's see if a lower high is formed to confirm change in trend in the near term.
Resistant3 = 3927.5
Resistant2 = 3883.90 - 3894.20
Resistant1 = 3862 - 3869
Support1 = 3820 - 3833
Support2 = 3774.5 - 3784
Support3 = 3723.5 - 3728
Remember to Like and Follow if you find this useful.
Have a safe and successful trading week ahead. OANDA:SPX500USD

US Market Technicals Ahead (19 Jan – 22 Jan 2021)The holiday shortened week will see Joe Biden inauguration as the 46th president of the United States on Wednesday with investors waiting to see how his plans for stimulus relief and tackling the pandemic will roll out. Janet Yellen’s confirmation hearing as the U.S.’s first female Treasury secretary is set to take place on Tuesday.
The fourth-quarter earnings season continues next week, with companies such as IBM ($IBM), Netflix ($NFLX), Intel ($INTC) and P&G ($PG) reporting their results. The European Central Bank is to hold its latest policy meeting against a background of renewed lockdowns to contain the pandemic.
Meanwhile, a raft of PMI data from the U.S, Eurozone, Japan, and the UK on Friday will lay bare the state of the global economy at the start of 2021. Fourth quarter and full year GDP data out of China on Monday could show that it was the only major world economy to have expanded in 2020. Here’s what you need to know to start your week.
S&P500 (US Market)
The benchmark index ($SPX) underwent a correction of -1.98% (-76 points), with majority of the losses experienced on Friday after market missing the estimates of US. Retail Sales for December (-0.7% MoM vs 0%. MoM). With the above, the highlighted Bearish Hanging Man candlestick pattern last week is currently in play.
At the current junction, the $SPX remains firmly within the congested 2 months trend channel, with 20DMA supporting the rally since 4th November 2020. The significance of 20DMA towards $SPX daily current price action is also observed in the various rebound highlighted in the chart (arrow), particularly thrice in December 2020 and once in January 2021.
The immediate support to watch for any further weaknesses is at 3,660 level. This level would see $SPX breaking down the highlighted trend channel convincingly, along with the first break of a minor classical support established on the opening week of 2021.
1. Biden bump?
Joe Biden will be inaugurated as the 46th U.S. president Wednesday, taking over the leadership of a country ravaged by the pandemic and facing deep socio-economic divisions.
Biden has announced a $1.9 trillion stimulus package, which includes $1,400 stimulus checks but this may prove a double-edged sword for investors, bolstering optimism over the outlook for the economic recovery while raising worries over how the U.S. will afford it.
The S&P 500 has risen in the first 100 calendar days of eight out of the last 10 presidential terms, but Biden’s first 100 days may be more fraught than those of his predecessors. He needs to stimulate the economy quickly, but the narrow Democrat majority in Congress means the size and timing of the package remain uncertain.
2. Earnings
Investors will be anxious to see whether upcoming earnings results validate expectations for a strong rebound in 2021.
U.S. stocks are at record highs, boosted largely by optimism that the vaccine rollout will allow for a recovery, while hopes of more fiscal stimulus have also underpinned gains.
Earnings reports for the last quarter of 2020 will get underway in earnest with the release of results from companies including Bank of America ($BAC), Goldman Sachs ($GS), Netflix ($NFLX), Charles Schwab ($SCHW), Procter & Gamble ($PG), United Airlines ($UAL), Intel ($INTC) and IBM ($IBM).
Earnings for S&P 500 companies are expected to decline 9.5% in the final quarter of 2020 from a year ago, but are expected to rebound in 2021, with a gain of 16.4% projected for the first quarter, according to IBES data from Refinitiv.
3. ECB meeting
The ECB is to hold its first meeting of 2021 on Thursday. Policymakers announced extra stimulus in December, but the economic outlook has been clouded again by the discovery of new Covid-19 strains and the relatively slow pace of the vaccination rollout.
Cause for concern? Not so, comments from Christine Lagarde suggest. The ECB chief predicts recovery as COVID subsides, seeing the glass as half-full, not half-empty. Germany’s economy too is cause for optimism, shrinking by a less-than-expected 5% in 2020.
But prolonged lockdowns will hurt. Against this backdrop, markets will want the ECB to signal its commitment to using the full firepower of its 1.85 trillion-euro ($2.24 trillion) emergency bond-buying scheme – something on which policymakers appear to be split.

US Market Technicals Ahead (11 Jan – 15 Jan 2021)Market will likely be focusing on the prospects for a bigger stimulus package after Friday’s employment report showed the U.S. economy shed jobs for the first time in eight months in December amid a resurgence of Covid-19 infections. A further snapshot of how the economy is performing will be presented with upcoming Friday’s release of data on inflation and retail sales.
Additionally, earnings season will get underway with major US banks set to release fourth quarter earnings results on Friday.
Here’s what you need to know to start your week.
S&P500 (US Market)
The benchmark index ($SPX) continued with a 3rd consecutive week of rally, closing with a modest gain of +1.83% (68.6 points) for the opening week of 2021. This rally have continued to establish a new all time high level at 3,826 points, also breaking out of a 9 weeks trend channel congestion that was highlighted over the weeks.
With plenty of eutrophic moves in highly speculative themes over the past weeks (i.e. Electric Vehicles, Bitcoin, Alternative Energy and Biotechnology), there were observation that some of the previously market-leading mega cap companies are not in participation of the week’s rally. Several of the higher profile companies, particularly the FAANG, remain either in a consolidated triangle chart pattern, or a box ranged rectangular chart pattern. Additionally, $SPX traded lower on the first two days of the year, with the month long highest sessional volume observed on Tuesday alone.
At the current junction, the 20DMA have been nicely supporting $SPX in rally since 4th November 2020. The significance of 20DMA towards $SPX daily current price action is also observed in the various rebound highlighted in the chart (arrow), particularly thrice in December 2020 and once in January 2021. There is also a significant pick up in trading volume since the start of 2021, and it is imminent for market volatility to further uptick towards a 50 points ATR14 range within the next two weeks.
The immediate support to watch for any potential weaknesses is at 3,780 level, a confirmation retracement for Friday’s Bearish Hanging Man candlestick pattern.
Top 3 things to watch this week:
1. Stimulus hopes
Stocks closed at record highs on Friday, despite data showing the U.S. economy suffered its first net loss of jobs in eight months in December, after Biden said his economic relief package will be in the trillions of dollars.
Biden said his administration’s economic package will also include unemployment insurance and rent forbearance. The package is due to be unveiled on Thursday.
2. Economic data, Fed speakers
The U.S. is due to release data on consumer price inflation on Wednesday, while retail sales figures for December are due out on Friday. Inflation is expected to tick slightly higher, but remain subdued, while retail sales are expected to have been dampened by the surging virus.
Fed Chair Jerome Powell is to speak on Thursday. The U.S. central bank has indicated that interest rates will remain on hold near zero through at least 2023 and said the path of the economy will depend significantly on the course of the virus.
3. Banks kick off earnings
Big banks will kick off the U.S. corporate earnings season in earnest with JPMorgan (NYSE: $JPM), Citigroup (NYSE :$C) and Wells Fargo (NYSE: $WFC) posting fourth-quarter results on Friday – the first S&P 500 companies to report for the last quarter of coronavirus-stricken 2020.
Some investors expect company earnings and economic data to play a greater role in moving stock prices this year.

SPX500/S&P500 ( DONT MISS THIS)here is SPX500 a.k.a S&P500 , we can see that price is moving respecting a bullish channel in 30 min, Then price has already tested the support of the channel, from here we are looking for buying in order for the price to test the upper boundary of the channel ( BUY AFTER RETEST)

S&P Since Inception to 2020 weekly Golden Cross #2 Gain#3 length1958-2020. we just behind Mid 70s to the End of 90s .

SPX's RSI structure & divergences are to watch very v.v. closelyBelow 60 reading HIGH ALRET.
wish u alll the best.

spx's weekly rsi 63sh readings we've allot of time to confirm ?3 Divergences, with similarities and differences. Food for thoughts.
wish you the best.

SPX & RSI relation. Below 60 Readings 1969-2020 check red box !we go below 60's reading check the red box for percentage of Crash, pullback and corrections. i might missed allote :-)
simple wish you all the best.


SPX"s Japanese candlestick trading signals since inception 1957Hey Traders ,
what's up. I know that there is allot of data, i hate that as every one else does. But,
if you want to keep it simple just study, analyze and write down the Red & Green boxes they should sum up most of the study. I have included all the
data here . So feel free to redo, redistribute, reuse or shar it here or outside of tradingview with anyone even with out mentioning the source. from me
to humanity whom are trading SPX : - ). Moreover, If anything that this data is telling us in a very short English terms "Do not chase tops on monthly candles !!! " .
Also, some monthly candles could be treated as bullish data suggesting that !!! what's up with that!!! no Golden rule for these candles.
wish you all the best.
-----------------------------------------------------------------
1/ Bearish
Spinning Top Black 21 times : since Dec, 1961
Just looks like Evening star !!! Reds i'll treat them
like bearish signals just for the record : - )
--------------------------------------------------------
profit Opportunity cost
zero 300%
54 zero
6.40 zero
zero 340 %
17.33 zero
zero 17.18
zero 7.95
zero 34.49 %
zero 19.98%
22.11 zero
10.31 zero
zero 5.56%
3.61 zero
37.19 zero
zero 8.21
9.48 zero
zero 4.92
8.70 zero
zero 28.87%
28.23 zero
***********************************************************************************
Long Upper Shadow 15 times: since Nov, 1950
---------------------------------------------------------
Profit Opportunity Cost
31.80 zero
zero 16.10
zero 6.28
zero 4.8
Zero 23.55
Zero 145
Zero 69.85
21.39 zero
28.49 zero
2.97 zero
zero 22.31
zero 9.51
3.70 zero
2.30 zero
zero 11.62
***********************************************************************
Hanging Man 8 times: Since Nov, 1951
-------------------------------------------------------
Profit Opportunity Cost
18.62 Zero
2.11 Zero
Zero 3.83
Zero 6.29
Zero 12.98
Zero 17.11
Zero 49.01
Zero 16.22
**********************************************************************
Engulfing 15 signals: since Feb, 1952
--------------------------------------------
Profit Opportunity Cost
Zero 23.33%
Zero 17.77
13.47 zero
11.46 zero
zero 13.36
4 zero
zero 57
zero 27.77
zero 81.35
Zero 124.44
6.06 zero
20.76 Zero
Zero 12.67
5.95 Zero
Zero 14.01
*************************************************************
Marubozu Black 5 times ! : Since Apr, 1952
--------------------------------------------
profite opportunity cost
zero 23.31
zero 62.06
8.11 zero
zero 112
zero 15%
************************************************************
Tweezer Top 13 times : since April, 1956
----------------------------------------------------
Profit Opportunity cost
12.36 zero
4.25 zero
3.81 zero
zero 60.73
zero 34.73
zero 7.47
4.16 zero
zero 14.45
zero 47.07
9.41 zero
15.14 zero
7.04 zero
12.38 zero
*************************************************************
********************************************************************************************************************************
2/Bullish.
Long Lower Shadow-Bull 27 times : since Jul,1950
-----------------------------------------------------
Profit Cost
37.20
8.53
8.28
49.59
3.38
22.42
20.42
zero 46.23
273.66
37.93
60.27
zero 8.84
40.87 zero
zero 36.73
zero 33.39
3.72
19.43
3.83
6.62
6.29
14.01
4.61
25.32
18.08
2.53
8.62
44.87
******************************************************
Marubozu White -Bull 26 times : Since Sep, 1950
--------------------------------------------------------
profit cost
zero 4.60
21.45
12.15
71.55
36.09
2.3
4.15
46.07
19.25
5.86
9.08
4.01
21.27
3.85
zero 14.17
11.21
3.25
11.88
5.79
8.35
3.90
2.36
zero 4.92
3.74
2.45
3.36
************************************************************
Spinning Top White19 times : since March 1950
Just looks like Evening star !!! Whites i'll treat
them like Bullish signals just for the record : - )
---------------------------------------------------------
Profit opportunity cost
zero 19%
14.20 zero
86.64 zero
29.22 zero
44.90 zero
zero 31.81
8.06 zero
zero 9.45
6.35 zero
17.18 zero
24.60 zero
zero 4.01
10.78 zero
zero 3.35
12.22 zero
zero 4.94
zero 4.94
47.61 zero
13.65 zero
--------------------------------------------
Summery: 63% bullish
***********************************************************************************
Rising Window 21 times: Since May, 1950
--------------------------------------------------------
Profit Cost
2.51
8.04
11.22
6.11
1.85
zero 3.90
zero 8.29
12.83
13.72
26.85
3.85
3.85
zero 9.03
6.25
54.19
3.62
zero 4.28
zero 3.50
zero 11.18
*******************************************
Long Lower Shadow-Bull is actually a Doji
52-53-54-
Or inverted hammer 63-86-88!!!!
I might be wrong or tradingview is wrong
or something else is wrong!!!
**************************************************

S&P500 possible moves the indice can make coming into the new week.
lets watch the pair for a while, i will give an update on the same on Monday.


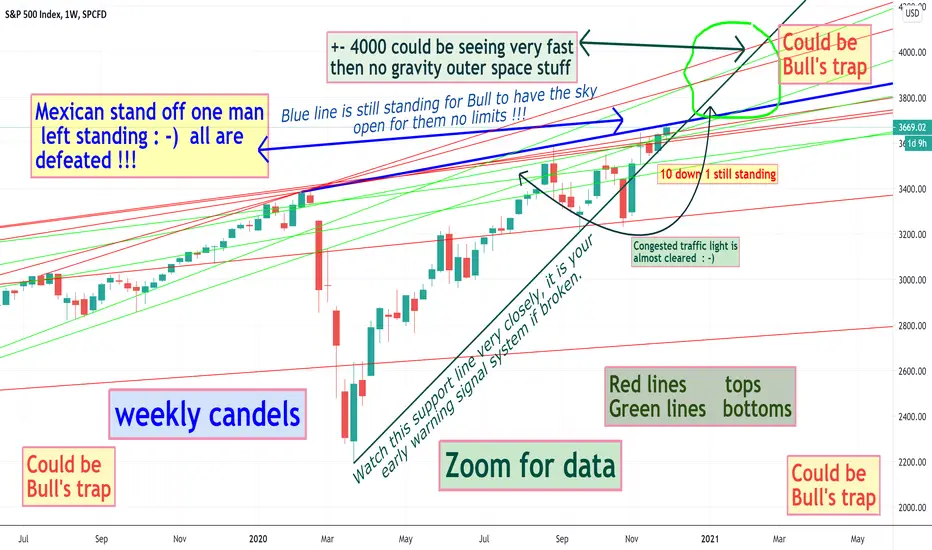
SPX Mexican stand off one man still standing for bull to have the sky limit for them. Or may night and it turns to be a bulls trap !!! time will tell
wish you all the best.
S&P 500 Shorting Opportunity Short-TermS&P500 forming rising wedge like pattern near multiple resistance. So, I believe it might head downward near short-term. However, if it breaks upside, the complete setup will invalidate.

SPX BREAK DOWN BULLS & BEARS WHAT DO YOU THINK ?YOU NEED THIS PRINTED AND HANGED INFRONTE OF YOU.
WISH YOU ALL THE BEST.

SPX500 IS STILL STRONG however another moderate pullback can happen in short term before going up over 4000.

SPXUSD TP_3.134_7.04%_237.30pips_SL_3.470_2.95%_99.30pipsSPXUSD TP_3.134_7.04%_237.30pips_SL_3.470_2.95%_99.30pips

S&P 500 Long Setup!I think we will have one more leg up at least before the election. If you find this useful please leave a like I would appreciate it :)


S&P 500 Breakout Opportunity Short-TermS&P 500 Breakout Opportunity Short-Term
Go long in SPX if it gives upside breakout and go short in case it breaks downside.

GAPS, GAPs, GAPsMr Market likes to fill open gaps. It will do so whenever possible. We have had very good examples of these in recent days.
IMO, we are still on a bullish footing at this stage. I have highlighted the green box. You will note today, prices gapped below the green box and finished back within. That green box is the true range of the last (significant) bull bar. Breaks up or down out of the green box usually will signal a continued move in the direction of the break.
There is potential downside here as there are lower gaps we have not closed around the support level. If we continue to hold the green square, bias would be for continued upside.
My trading stories: dailyxing.medium.com
