SPY DISTRIBUTION - Wyckoff Phases - SHIT IS ABOUT TO HIT THE FANMe applying the wyckoff distribution phases to spy.
Below is a description of everything on the chart. I know it is a lot but it is well worth reading. the mind is a terrible thing to waste.
Please check related ideas link for more information into wyckoff and this distribution phase.
THIS IS BASED OF THE WYCKOFF DISTRIBUTION PHASES.
Phase A: Phase A in a distribution TR (trading range) marks the stopping of the prior uptrend. Up to this point, demand has been dominant and the first significant evidence of supply entering the market is provided by preliminary supply (PSY) and the buying climax (BC). These events are usually followed by an automatic reaction (AR) and a secondary test (ST) of the BC, often upon diminished volume. However, the uptrend may also terminate without climactic action, instead demonstrating exhaustion of demand with decreasing spread and volume; less upward progress is made on each rally before significant supply emerges.
In a redistribution TR within a larger downtrend, Phase A may look more like the start of an accumulation TR (e.g., with climactic price and volume action to the downside). However, Phases B through E of a re-distribution TR can be analyzed in a similar manner to the distribution TR at the market top.
BC: buying climax during which there are often marked increases in volume and price spread. The force of buying reaches a climax, with heavy or urgent buying by the public being filled by professional interests at prices near a top. A BC often coincides with a great earnings report or other good news, since the large operators require huge demand from the public to sell their shares without depressing the stock price.
AR—automatic reaction. With intense buying substantially diminished after the BC and heavy supply continuing, an AR takes place. The low of this selloff helps define the lower boundary of the distribution TR. (trading range)
Phase B: The function of Phase B is to build a cause in preparation for a new downtrend. During this time, institutions and large professional interests are disposing of their long inventory and initiating short positions in anticipation of the next markdown. The points about Phase B in distribution are similar to those made for Phase B in accumulation, except that the large interests are net sellers of shares as the TR evolves, with the goal of exhausting as much of the remaining demand as possible. This process leaves clues that the supply/demand balance has tilted toward supply instead of demand. For instance, SOWs are usually accompanied by significantly increased spread and volume to the downside.
ST—secondary test, in which price revisits the area of the BC to test the demand/supply balance at these price levels. For a top to be confirmed, supply must outweigh demand; volume and spread should thus decrease as price approaches the resistance area of the BC. An ST may take the form of an upthrust (UT), in which price moves above the resistance represented by the BC and possibly other STs before quickly reversing to close below resistance. After a UT, price often tests the lower boundary of the TR. (trading range)
SOW—sign of weakness, observable as a down-move to (or slightly past) the lower boundary of the TR, usually occurring on increased spread and volume. The AR and the initial SOW(s) indicate a change of character in the price action of the stock: supply is now dominant.
Phase C: In distribution, Phase C may reveal itself via an upthrust (UT) or UTAD. As noted above, a UT is the opposite of a spring. It is a price move above TR resistance that quickly reverses and closes in the TR. This is a test of the remaining demand. It is also a bull trap—it appears to signal the resumption of the uptrend but in reality is intended to “wrong-foot” uninformed break-out traders. A UT or UTAD allows large interests to mislead the public about the future trend direction and, subsequently, sell additional shares at elevated prices to such break-out traders and investors before the markdown begins. In addition, a UTAD may induce smaller traders in short positions to cover and surrender their shares to the larger interests who have engineered this move.
Aggressive traders may wish to initiate short positions after a UT or UTAD. The risk/reward ratio is often quite favorable. However, the “smart money” repeatedly stops out traders who initiate such short positions with one UT after another, so it is often safer to wait until Phase D and an LPSY.
Often demand is so weak in a distribution TR that price does not reach the level of the BC or initial ST. In this case, Phase C's test of demand may be represented by a UT of a lower high within the TR.
LPSY—last point of supply. After testing support on a SOW, a feeble rally on narrow spread shows that the market is having considerable difficulty advancing. This inability to rally may be due to weak demand, substantial supply or both. LPSYs represent exhaustion of demand and the last waves of large operators’ distribution before markdown begins in earnest.
UTAD—upthrust after distribution. A UTAD is the distributional counterpart to the spring and terminal shakeout in the accumulation TR. It occurs in the latter stages of the TR and provides a definitive test of new demand after a breakout above TR resistance. Analogous to springs and shakeouts, a UTAD is not a required structural element.
Phase D: Phase D arrives after the tests in Phase C show us the last gasps of demand. During Phase D, price travels to or through TR support. The evidence that supply is clearly dominant increases either with a clear break of support or with a decline below the mid-point of the TR after a UT or UTAD. There are often multiple weak rallies within Phase D; these LPSYs represent excellent opportunities to initiate or add to profitable short positions. Anyone still in a long position during Phase D is asking for trouble.
Phase E: Phase E depicts the unfolding of the downtrend; the stock leaves the TR and supply is in control. Once TR support is broken on a major SOW, this breakdown is often tested with a rally that fails at or near support. This also represents a high-probability opportunity to sell short. Subsequent rallies during the markdown are usually feeble. Traders who have taken short positions can trail their stops as price declines. After a significant down-move, climactic action may signal the beginning of a re-distribution TR or of accumulation.
SPXS

SPX reversed from resistance, potential drop!SPX reversed off its resistance at 2956.1 where it could potentially drop further to 2723.5.
Disclaimer:
Trading CFDs on margin carries high risk.
Losses can exceed the initial investment so please ensure you fully
understand the risks.

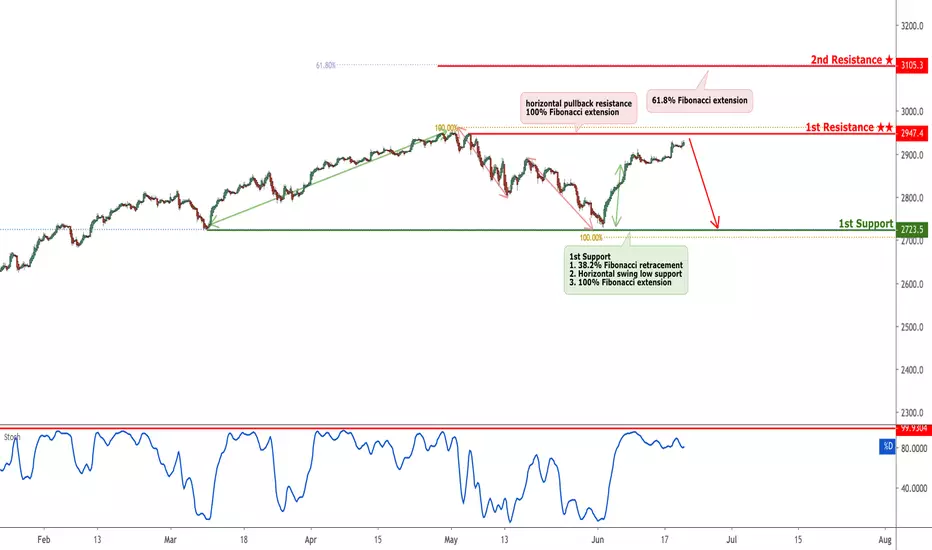
SPX approaching resistance, look out for a potential reversalSPX is approaching its resistance at 2947.4 where it is could reverse down to its support at 2723.5.
Trading CFDs on margin carries high risk.
Losses can exceed the initial investment so please ensure you fully
understand the risks.
SPY ES1! SPX Still Bullish, Pause before higherThe weekly SPY chart continues to look positive.
I circled areas where strong bounce weeks ended up failing and reversing to new lows.
But IMO, those reversals came with poor technicals (MACD trending down and/or negative) and showed big red candles right away. Now, we're seeing different action - MACD is turning up now and last week was flattish, closing at support. Stay long


Short SPX 500 Next 2-4 WeeksClear sell-off in process. Looking for previous support levels to be reached.
In the next two weeks I see a pullback for SPXS right after SPX finds a brief bottom and consolidates for a short bit my target buy for SPXS is the 21’s and my Target sell is $25.
$29 SPXS coincides with ~2550 SPX. This is possible by Mid-July. (4 1/2 weeks).

SPX S&P 500 2 Week ForecastTrump wants to win re-election. Trump can’t win if the US economy enters recession.
The only way Trump can possibly avoid recession is if the Fed cuts interests rates now. If the Fed waits til the market has tanked in order to cut rates, it will be too late to avoid recession via monetary stimulus that point. Trump needs rate cuts now! In order to get this he is using the tariffs to tank the stock market now to force the Fed’s hand.
The Fed meets June 19, July 19, and September something. They don’t meet in August. These next two meetings are important.
I believe the SPX will find a temporary bottom right around this first Fed meeting in 2 weeks, for a 3% decline.
If the Fed comes out with a surprise rate cut in June or July this could send the market higher (not much of surprise as probabilities are now at 80% for a rate cut in September but would still be a surprise). If the Fed does nothing I’d expect more selling & finding new support lower.
If SPX continues selling after June 19, I’d look for support between 2550 & 2475. I don’t think the Federal Reserve would let the SPX get that low again though...

spx channel, trade problems, expansion problems, debt problems..Heres a trend that may continue? Not sure I see a reason to break out to upside? Not sure what china will do as retaliation, but I imagine market wont think of it as a reason to rally back to highs.. but who knows, been wrong many times before.
Why this forecast will ultimately prove to be incorrect:
Im around 90% that monday, if market starts falling, we'll be seeing some trade talks going well, beautiful conversation stuff popping up in the news.. which will surely inspire our cpu palls to push price up into the 2900's.

SP500 Breakdown Near Top of Rising WedgeI've been following, waiting patiently for the breakdown. The market was unstoppable, nothing could shake it. Yesterday's reversal was bizarre, but the breakdown provided a wonderful buying opportunity (short). Further breakdown to come...lets see where we find support.

SPXS declining wedge coming to an end: breakout incoming! SPXS declining wedge pattern coming to ahead in the next few trading days. Watch for a daily close breakout and load up on your SPXS longs. RSI screaming oversold. VIX starting to show uptrend meaning impending volatility. Hold on to your pants.

Market Correction SPYLooking to take SPY shot via SPXS in the next few days, extremely overbought, with an ascending wedge pattern almost fully formed.


SPX: Europe is kindly ushering in the next depressionRead an article this morning on how tech companies having many european constituents are lagging in decline of their stock price compared to tech companies having many chinese constituents by about 4:1. The article argued that the timing of this lag could result in a disastrous tech bubble here in America. This inspired me to checkout SPX in terms of euros, i.e., SPX*EURUSD. For EW believers, the chart provides a strong indication of how bearish the monster knocking on America’s door is.
FYI: EW count reveals a failed Wave 3 (came in under 1.68 Fib extension of W1) followed by the typical extended fifth seen in such scenarios (1-1.68 Fib extension of length from beginning of W1 to end of W3).


$IWM $RUT $TNA $TZA Small Caps About to Lead The Markets!While the large-cap stock indexes like the $SPY $SPX $QQQ $DIA have been running higher, they are now at resistance and should stall out or at least slowdown. Small-cap stocks have been building a base for a mega rally that could make the large-cap run look like chump change!
See more analysis on the small cap sector: www.thetechnicaltraders.com

Elliott Wave View: S&P 500 (SPX) Ending Wave 5Cycle from Dec 26, 2018 low in S&P 500 (SPX) remains in progress as an impulse Elliott Wave structure. In the 1 hour chart below, we can see wave (4) of this impulsive move ended at 2722.27. The Index has resumed higher in wave (5) with subdivision also as an impulse of lesser degree. Up from 2722.27, wave 1 ended at 2852.42 and wave 2 ended at 2785.02.
Wave 1 subdivides as an impulse where wave ((i)) ended at 2736.25 and wave ((ii)) ended at 2723.02. Up from there, wave ((iii)) ended at 2821.24, wave ((iv)) ended at 2803.46, and wave ((v)) of 1 ended at 2852.42. Wave 2 pullback unfolded as double three Elliott Wave structure where wave ((w)) ended at 2802.13, wave ((x)) ended at 2823.28, and wave ((y)) of 2 ended at 2785.02. Wave 3 rally is currently in progress as an impulse. Near term, while dips stay above 2784.94, expect Index to extend higher. We don’t like selling the proposed pullback.

$ES_f $spy $spx $spxs Day Trading Index Price Gaps Made EasyThese morning gap trades happen nearly every week providing a steady stream of winning trades.

$SPX $SPY $SPXS $TZA $SDS Gaps Tend to Get Filled!Lots of intraday pivot lows that will trigger strong sell-off today if price starts to breakdown.

VIDEO analysis on small cap stocks, bearish but at fib supportVIDEO analysis on small-cap stocks, bearish but at fib support for a bounce as of today


Small Cap Stocks with Bearish daily and weekly chartsThe Russell 2000 ETF continues to deliver critical technical and longer-term price patterns for skilled technicians. Combining the IWM chart with the Transportation Index, Oil, Gold, and others provide a very clear picture of what to expect in the immediate future.
Recently, we posted a research article about the Head-n-Shoulders pattern setting up in the $INDU. Again, the IWM chart is also showing a very clear Head-n-Shoulders pattern with critical resistance near $159.50 and support near $144.25. Our researchers, at Technical Traders Ltd., believe this right Shoulder will prompt a downside market move towards support near $144.25 before a downward sloping wedge pattern sets up. This first downward price leg will setup and congesting wedge formation that will, eventually, break to the upside and drive market prices higher.
We authored a research article about this pattern setup on February 17, 2019. You can read it here.
Skilled traders watch all the charts to assist them in identifying characteristics that can assist them in understanding price moves, key support/resistance levels, and price patterns. This IWM chart should be on everyone’s radar at the moment. Where the IWM finds support, so will the other US stock market indexes.
The IWM setup indicates we may only see a 5~7% downside price swing before support is found. We’ll have to watch how this plays out over the next few weeks/months to determine if the $144.25 level is true support or if the lower $137.00 level will become support. Either way, the downside price swing appears poised to unfold over the next few days/weeks – so be prepared.
Please take a minute to visit www.TheTechnicalTraders.com to learn how we can help you find and execute better trades in 2019. We have already positioned our clients for this move and we believe we can help you stay ahead of these markets.
