SPXUSD approaching resistance, potential drop! SPXUSD is approaching our first resistance at 2819.7 (78.6% fibonacci retracement, horizontal pullback resistance, 100% fibonacci extension) where a strong drop might occur below this level pushing price down our first support at 2704.2 (horizontal pullback support, 23.6% fiboancci retracement).
Stochastic (89,5,3) is also approaching resistance and seeing a bearish divergence where we might see a corresponding drop in price.
SPXUSD

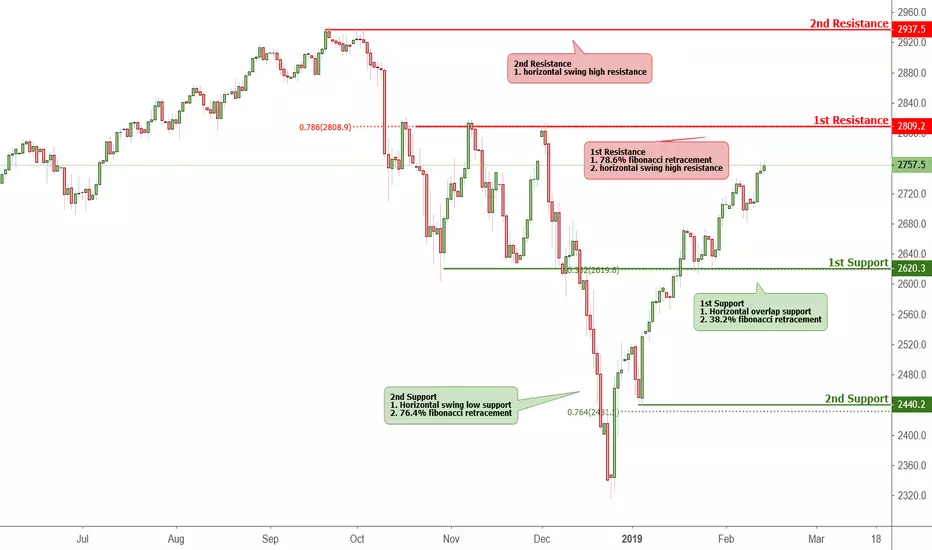
SPXUSD - Dailiy Key Elements Key levels to look out for, please refer to our h4 chart for a strategic view!

SPX to short??SPX looks being dragged by the oil Price, if oil continues going down, we will see an sell off in sp500


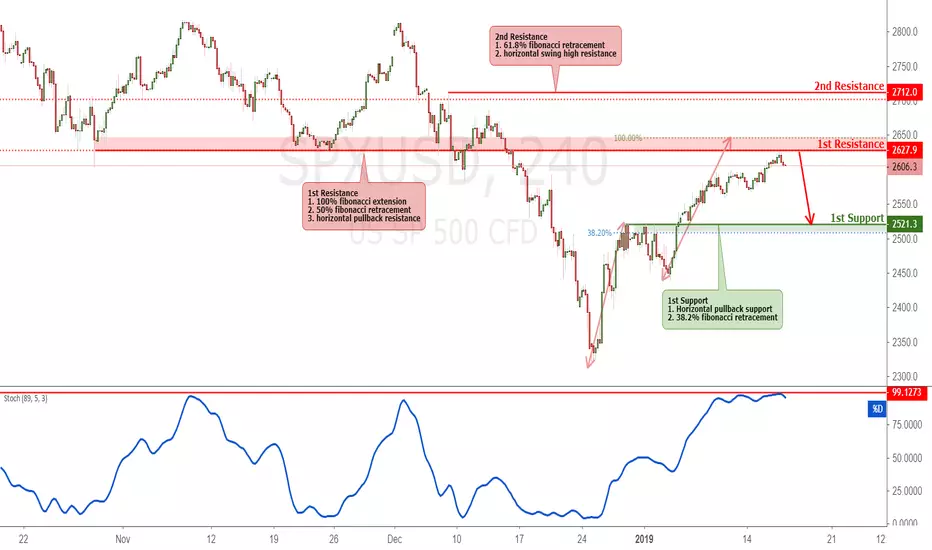
SPXUSD testing resistance, potential reversal!SPXUSD is testing our first resistance at 2627.9 (horizontal pullback resistance, 50% fibonacci retracement , 100% fibonacci extension ) where a strong drop might occur below this level pushing price down to our major support at 2521.30 (horizontal pullback support, 38.2% fiboancci retracement).
Stochastic (89,5,3) is also testing resistance where we might see a corresponding drop in price.
Update: Short either 2531 - 2611 or both until 2272I didn't show the 2531 level in my previous forecasts, but it could potentially be a very important level. TBC

SPXUSD approaching resistance, potential reversal!SPXUSD is approaching our first resistance at 2627.9 (horizontal pullback resistance, 50% fibonacci retracement, 100% fibonacci extension ) where a strong drop might occur below this level pushing price down to our major support at 2521.30 (horizontal pullback support, 38.2% fiboancci retracement).
Stochastic (89,5,3) is also approaching resistance where we might see a corresponding drop in price

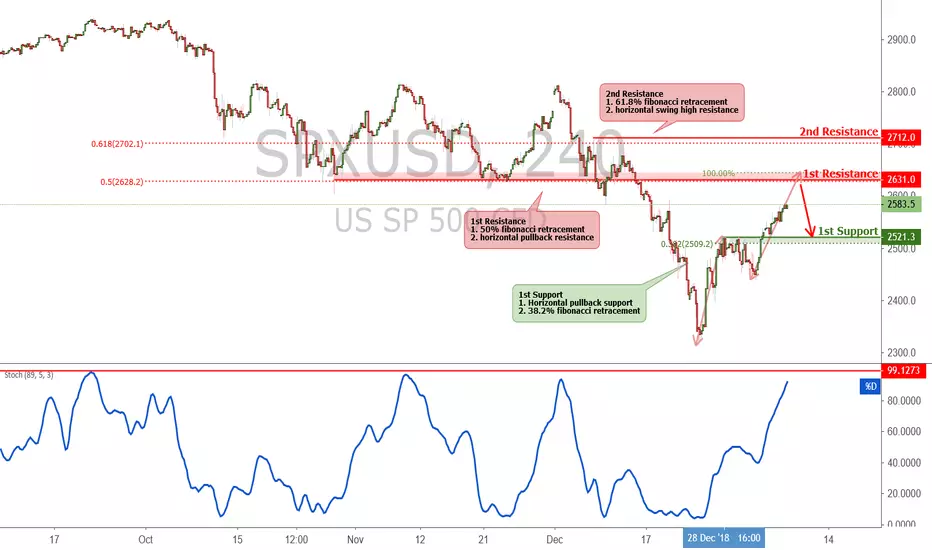
SPXUSD approaching resistance, potential drop! SPXUSD is approaching our first resistance at 2631 (hroizontal pullback resistance, 50% fibonacci retracement) where a strong drop might occur below this level pushing price down to our major support at 2521 (horizontal pullback support, 38.2% fibonacci retracement).
Stochastic (89,5,3) is also approaching resistance where we might see a corresponding drop in price.
SPXUSD - Daily Key Elements Key levels to look for when analysing SPXUSD, please refer to our 4 hour chart for a strategic view!

SPXUSD Approaching Resistance, Potential Reversal!SPXUSD is approaching our first resistance at 2571.4 (horizontal pullback resistance, 61.8% fibonacci extension , 38.2% fibonacci retracement ) where a strong drop might occur below this level pushing price down to our major support at 2474.2 (38.2% Fibonacci retracement, horizontal swing low support).
Stochastic (34,5,3) is also approaching resistance where we might see a corresponding drop in price.

Test: Check this graph 6 months later.Statistically, I'd expect some sudden sharp upside moves and many gap fills to happen by approximately 6 months. When the market can trick a maximum number of traders, then it will trick the maximum number of traders. The Big Short may resume right after, if this year happens to be THE year.


Target reached : Long for some retracements until invalidationThere are in my opinion quite a few reasons to go long (potential sharp countertrend rally and pullback) before the global downtrend resumes, but we're still never too certain. Let's see what happens in the coming days. Let's hope no black swans will kill the markets just after the holidays.

My current view on the SP500. Again, even the markets bounce back, money unloading and fresh shorts would cause havok. I do not currently believe in a bull market for next year.

Potential scenario: Short post-FOMC or pull-back 2620 then shortNo matter what, my opinion is that odds favor the shorts (swing) until invalidation. We shall see what next year gives.

There are so many targets, but as it goes, 2376 could be one We shall see which target prevails. Be nimble

Potential hidden aggressive sellers waiting for a pullback 2622?Post-FOMC moves could be interesting as it would be the last known "major" event before the end of the year. After that, many operators would probably go on vacation.
I think it's possible that many bearish smart monies could be anticipating a potential bounce in order to trigger sell-orders in blocks, or step by step, unnoticed. However, the yearly support has already been tested a few time, and it could ultimately give way. As many may have already spotted, there is monthly bearish divergence on many indicators with the S500. Another seasoned trader also explained that it's the first time since years that the SP500 hasn't been under its Ichimoku cloud (kudos to this guy!).
Let's see what we will have today.

S&P 500: possible expanded flatThe index has been trapped within a large sideways consolidation where the second leg exceeded the former top
and could potentially drop below the former trough as well.
After that I expect the index to resume its way to the upside ti hit 3000+ area.

Gap down soon? How long will the supports hold?This is in line with European markets "correcting" another -15%

(1HR) breakdown?turning for another leg down possibly. rejected by 10ma. $SPY $QQQ $VXX fascinating market times

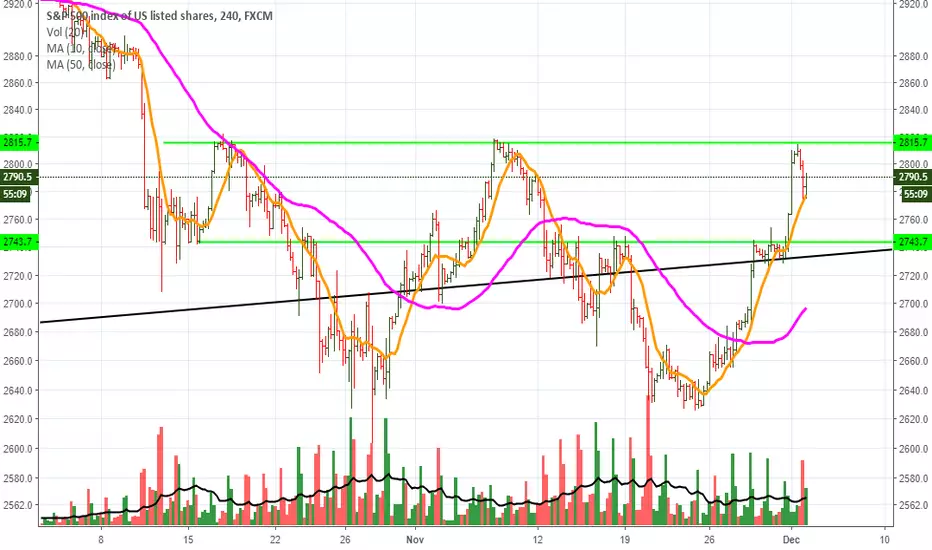
range bound>2815=short term uptrend, <2740 =continuation of medium term downtrend and possible set up for stronger move down $SPY $QQQ