SPX6900 Bulls Eyeing 33% Surge Toward Explosive $2.60 TargetHello✌
Let’s analyze SPX6900’s upcoming price potential 📈.
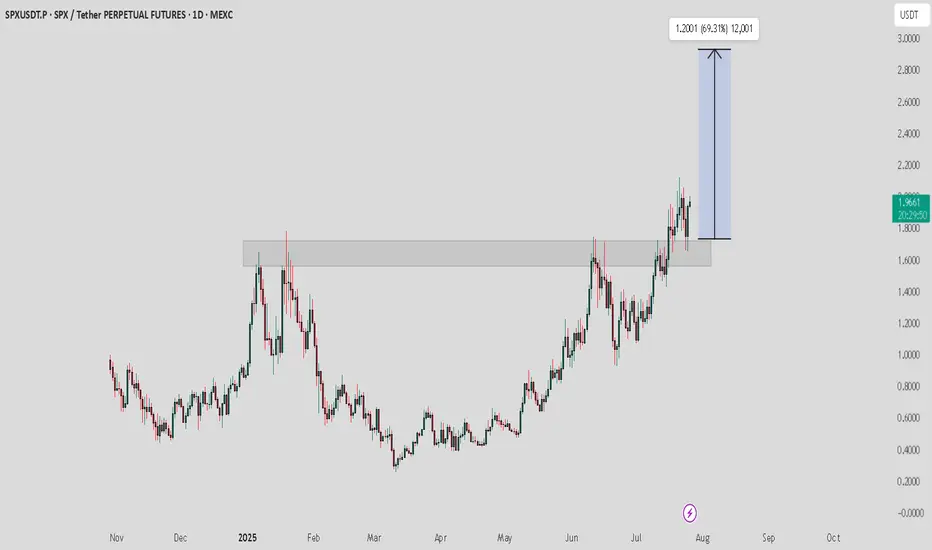
MEXC:SPXUSDT has maintained strong bullish momentum in recent weeks, supported by a stream of positive fundamentals 📈. The price is currently holding within an ascending channel and resting near daily support. If this level holds, a 33% upside toward the $2.60 target could follow 🚀
✨We put love into every post!
Your support inspires us 💛 Drop a comment we’d love to hear from you! Thanks , Mad Whale
Spxusdt

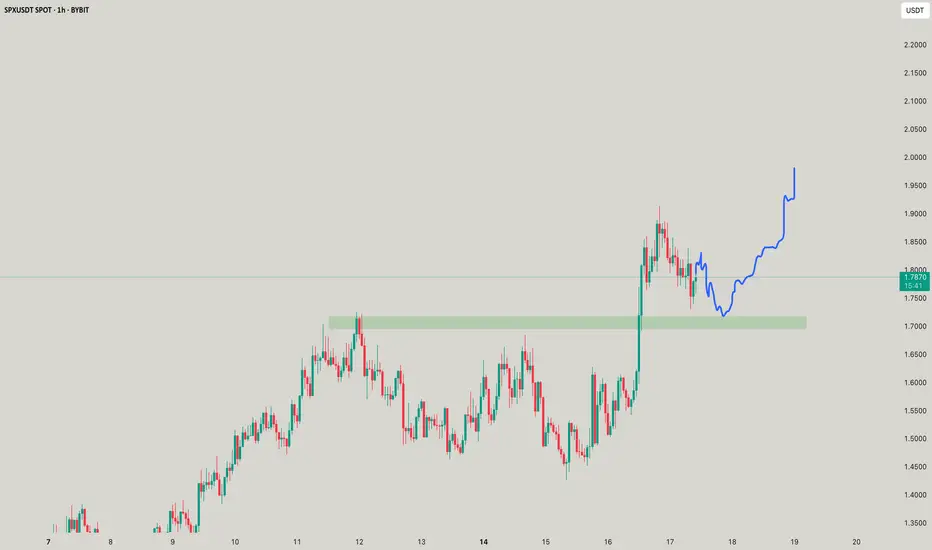
SPX / USDT : Broke out and now successful retestSPX/USDT has broken out from a consolidation zone, with the price approaching key resistance at $1.90. A sustained move above this level could push the price towards the $2.10-$2.40 range, offering a 6.3% upside.
Bullish Scenario: Price stays above support, targeting $2.10-$2.40.
Bearish Scenario: Breakdown below support invalidates the setup, signaling potential downside.
Risk Management: Monitor price action closely and adjust positions if support fails.
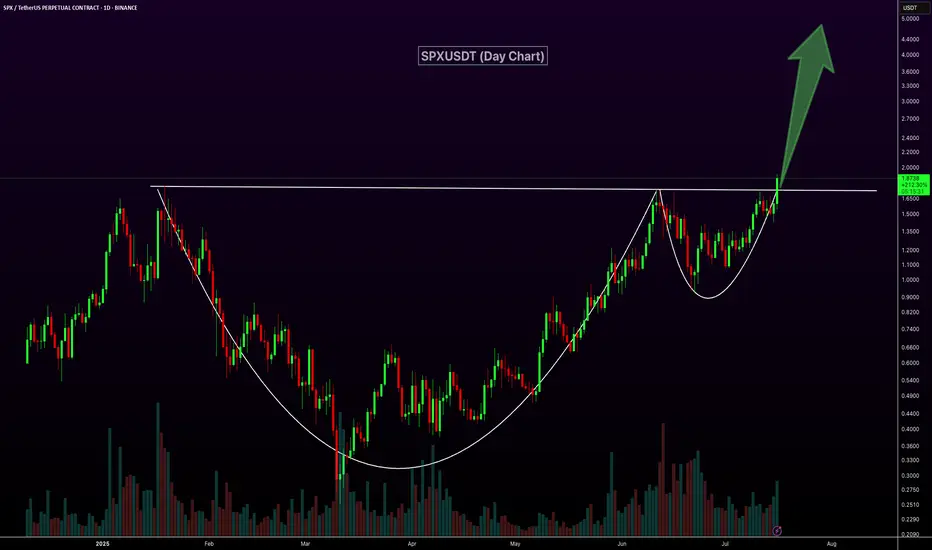
SPXUSDT Forms Classic Cup and HandleSPXUSDT daily chart is showcasing a strong Cup and Handle breakout with high volume, a classic bullish continuation pattern. After a well-formed, rounded base, price has cleanly broken above the neckline resistance around the $1.80 level, supported by strong momentum and a sharp bullish candle. This breakout signals the potential for a significant upside move, with the next leg likely to push toward much higher price levels.
SP:SPX MEXC:SPXUSDT
SPX/USDT – Retest Opportunity Within TriangleAs shared in the previous post, SPX was approaching a crucial breakout zone. Price has now retraced and is hovering around the lower trendline, presenting an ideal retest entry opportunity.
Entry (on retest): 1.37 – 1.39
Stop Loss: Below 1.33
Targets:
T1: 1.70
T2: 2.05
T3: 2.54
T4: 3.56
Support Levels: 1.3737 / 1.33
Resistance Levels: 1.70 / 2.05
Price structure remains intact, and consolidation above this range can fuel a strong move. Entering this retest zone keeps risk low with an excellent risk-to-reward ratio
DYOR | Not financial advice

$SPX - Short-Term OutlookMEXC:SPXUSDT | 4h
Price is now trading above its previous resistance 1.40
We may fill the gap around 1.39s, but this one looks solid so long as we stay above 1.36
Local Support: 1.40-1.38
TPs:
1.54 to 1.58
1.67 to 1.72
1.86 to 1.92


SPX/USDT – Breakout WatchSPX is currently testing a major horizontal resistance zone around 1.34–1.36, after a consistent series of higher lows forming an ascending triangle.
Trade Setup:
Entry (after breakout and retest): 1.34–1.36
Targets:
First target: 1.475
Second target: 1.567
Final target: 1.701
Stop Loss: Below 1.29
Structure: Ascending triangle showing compression and bullish pressure
RSI: Trending up, signaling possible continuation
This setup requires patience — the ideal long entry is after a breakout with successful retest. Rushing in early can be risky.
Do your own research. Not financial advice.


SPX - Space X?SPX means SpaceX? LOL NOO, but this coin has traits of the rockets. to move up, as stated

SPX - Space X?I dont know whats the full form, but its just flowing and when it flows - we say LET IT FLOWW!

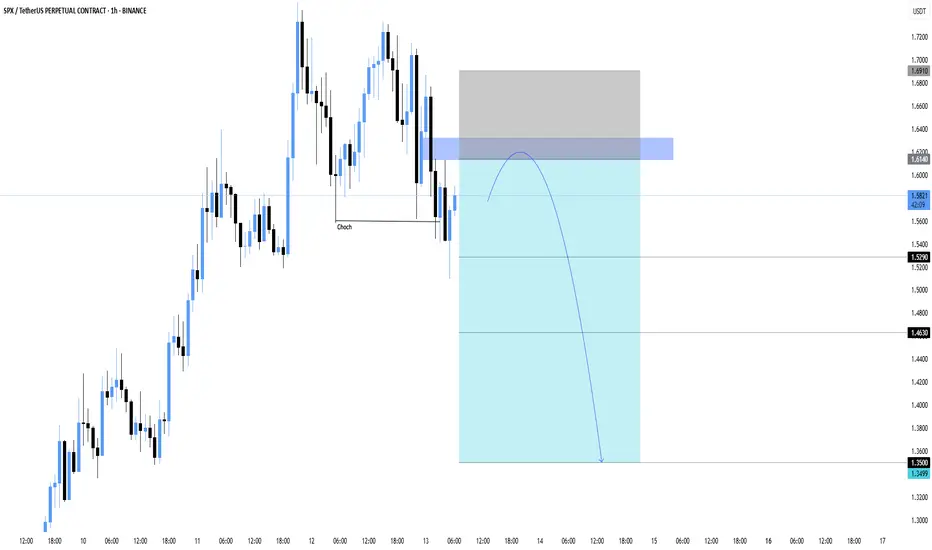
SPX/USDT — Change of Character Signals Bearish Move Incoming The structure has shifted with a clear CHoCH (Change of Character), suggesting that bullish momentum is weakening. Price recently pulled back into a supply zone around 1.6140–1.6910, setting up a potential short opportunity.
🔍 Technical Breakdown:
Price broke below recent higher low = CHoCH confirmed
Bearish BOS followed by retracement into premium zone (FVG/Supply)
Expecting rejection and continuation to downside if price fails to reclaim 1.6140
🔧 Trade Plan:
Entry Area: 1.6140
Stoploss: Above 1.6910
Targets:
• TP1: 1.5290
• TP2: 1.4630
• TP3: 1.3500
This setup aligns with internal structure + supply zone + CHoCH. Wait for confirmation candle or bearish engulfing in entry area before executing.
SPX Technical Analysis – Bullish StructureSPX Technical Analysis – Bullish Structure
The overall trend of SPX appears bullish, and based on the current structure, the asset shows potential for a 20% upside, with a possible move toward the $1.25 level.
Key support zones to watch are:
$0.90, which is approximately 11% below the current price
$0.80, which is around 21% below and can be considered the main support
As long as the price holds above these key levels and the bullish trend remains intact, the outlook stays optimistic for further upward continuation.
📌 This analysis is for educational and informational purposes only and does not constitute financial advice.
📝 Follow for more updates on SPX and other assets

SPX/USDT Breakout SPXUSDT:
SPX is now trading around $0.7255. #SPX has already broken out of the bull flag pattern and looks bullish. So, the possible scenario is that, as a bull flag is a bullish pattern, we can expect bullish momentum. Otherwise, if the price dumps and trades inside the bull flag channel, the breakout will be considered a fakeout. Keep an eye on it.

Breaking: SPX6900 ($SPX) Surged 23% Today Amidst Market TurmoilThe price of SPX6900 ( SP:SPX ) Surged 23% today amidst market volatility. Albeit it wasn't only the crypto industry undergoing correction, the stock market has had its own fair share of the dip with about $1.5 trillion wiped out from US stock market at open today.
As of the time of writing, SP:SPX is up 16.36%, there is still room for price surge as hinted by the RSI at 53. A breakout above the 1-month pivot could cement the path for a move to the $1 pivot.
Similarly, a break below the 50% Fibonacci level could negate the aforementioned bullish thesis leading to a consolidation move to the 1-month low region.
SPX6900 Price Live Data
The live SPX6900 price today is $0.537989 USD with a 24-hour trading volume of $58,478,403 USD. SPX6900 is up 18.38% in the last 24 hours. The current CoinMarketCap ranking is #100, with a live market cap of $500,863,790 USD. It has a circulating supply of 930,993,090 SPX coins and a max. supply of 1,000,000,000 SPX coins.

Breaking: SPX6900 ($SPX) Surged 21% Today The price of SPX6900 ( SP:SPX ) surged Nearly 25% today amidst breakout of a falling wedge.
Created on the Ethereum blockchain, SPX6900 is an advanced blockchain cryptography token coin capable of limitless possibilities and scientific utilization. With a growing momentum and hardworking community the coin seems to be a contender in the incoming bullrun speculated by traders.
As of the time of writing, SP:SPX is up 16.35% trading in tandem with the 1-month high axis. a break above that point could signal a trend continuation to the $0.70 - $0.80 pivot.
Similarly, should SP:SPX cool-off, immediate consolidation point resides in the 38.2% Fibonacci retracement point.
SPX6900 Price Live Data
The live SPX6900 price today is $0.616856 USD with a 24-hour trading volume of $45,031,583 USD. SPX6900 is up 21.61% in the last 24 hours, with a live market cap of $574,288,459 USD. It has a circulating supply of 930,993,090 SPX coins and a max. supply of 1,000,000,000 SPX coins.

SPX/USDT: 100%+ PROFIT POTENTIAL SETUP!!🚀 Hey Traders! Ready to Ride the SPX Breakout? 👋
If you’re hyped for this setup, smash that 👍 and hit Follow for elite trade ideas that actually deliver! 💹🔥
🔥 SPX is looking strong and bullish! It’s breaking out from a falling wedge on the 4H timeframe and is currently retesting the breakout level—setting up for a potential explosive move! 🚀
📊 Trade Setup:
✅ Entry Range: CMP, add more up to $0.75
🎯 Targets:
Target 1: $1.02
Target 2: $1.26
Target 3: $1.50
Target 4: $1.78
🛑 Stop Loss: $0.68
⚡ Leverage: Spot or low leverage (Max 5x)
💬 What’s Your Take?
Are you bullish on SPX’s breakout potential? Share your analysis, predictions, or strategies in the comments! Let’s lock in those gains and ride this wave together! 💰🔥

SPXUSDT is perhaps one of the best short term crypto investmentsSPXUSDT is having an enormous day so far that is about to test its All Time High.
The rebound is taking place after the 1day MA50 was tested and held, right at the bottom of the Channel Up.
Ahead of a 1day MACD Bullish Cross, this is a strong technical buy entry for the short term.
You can target the top of the Channel Up at 9.000, which would be a +9.38% rise, symmetrical with the coin's first.
Follow us, like the idea and leave a comment below!!

SPX Sell/Short Setup (2H)Hi, dear traders. how are you ? Today we have a viewpoint to Sell/Short the SPX symbol.
Considering the bearish mCH on the chart and the formation of an order block, we can look for sell/short positions within the red zone.
For risk management, please don't forget stop loss and capital management
When we reach the first target, save some profit and then change the stop to entry
Comment if you have any questions
Thank You

Buy Signal for SPX/USDT📈 Buy Signal for SPX/USDT
✅ Suggestion: Open a long position in the live market (Spot).
🎯 Target Price:
1️⃣ 0.8340
📊 I am also expecting a 7% growth in the spot market. 🚀
💬 To manage this signal accurately and receive more signals:
1️⃣ Follow my TradingView page 📊
2️⃣ Send me a private message for further guidance.
💎 Opportunities are waiting for you! 💰

#SPX/USDT#SPX
The price has been moving in a descending triangle since July 2023
We are now on the verge of breaking the downtrend
The moving average 100 was broken to the upside
Current price 0.3852
First target: 0.4300
Second target 0.5075
Third goal 0.5979

#SPX/USDT#SPX
The price is moving in a downward channel, and we are about to break it higher.
On the 4-hour frame, we saw clear upward momentum after some correction occurred.
Current price is 0.3715
The first target is 0.3930
The second goal is 0.4100
The third goal is 0.4290

S&P 500 Rocket flies $4,500 or will we catch a correction?llo trader Today I have prepared a new idea for you. Like and subscribe to the channel there is a lot of useful information✅
A few words about the US stock market
After exiting the descending channel , the price was able to rise by 11% ($4.310)
The Fund was able to break through the local resistance at $4,200 and is now trading around $4,300
With such successes, of course, it is not far to $4,500, there is a possibility that this will happen, or $4,300 will serve as a reversal point.
