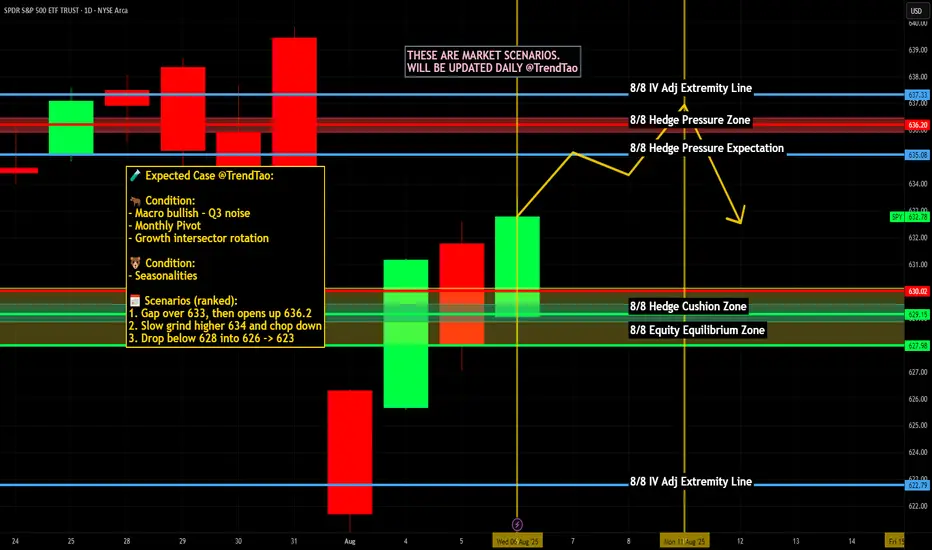
Nightly $SPY / $SPX Scenarios for August 7, 2025🔮 Nightly AMEX:SPY / SP:SPX Scenarios for August 7, 2025 🔮
🌍 Market‑Moving News 🌍
📦 Major Tariffs Implemented Today
Sweeping tariffs ranging from 10% to over 40% officially took effect today on imports from numerous countries, significantly escalating global trade tensions. Markets are closely tracking initial reactions across affected sectors, especially pharmaceuticals and semiconductors.
💻 Semiconductor Tariff Shakes Tech Sector
President Trump introduced a substantial 100% tariff on semiconductor imports, with notable exemptions for U.S. investors such as Apple, Nvidia, and AMD. Apple shares surged 5.1% amid investor optimism, while broader tech stocks saw mixed reactions.
🚀 Firefly Aerospace IPO Debut
Firefly Aerospace launched its IPO today, pricing shares at $45. The stock began trading on Nasdaq under ticker "FLY," attracting significant attention due to its positioning in the space and defense technology sector.
📊 Key Data Releases & Events 📊
📅 Thursday, August 7, 2025:
8:30 AM ET – Initial Jobless Claims (week ending Aug 2)
Forecast: 221,000
Previous: 218,000
8:30 AM ET – U.S. Productivity (Q2)
Forecast: 1.9%
Previous: –1.5%
8:30 AM ET – U.S. Unit Labor Costs (Q2)
Forecast: 1.3%
Previous: 6.6%
10:00 AM ET – Wholesale Inventories (June)
Forecast: N/A
Previous: –0.3%
10:00 AM ET – Speech by Atlanta Fed President Raphael Bostic
Topic: Monetary policy outlook; market-sensitive for potential Fed signals.
3:00 PM ET – Consumer Credit (June)
Forecast: N/A
Previous: $5.1B
⚠️ Disclaimer:
This content is for educational and informational use only and is not financial advice. Always consult a licensed financial advisor before making investment decisions.
📌 #trading #stockmarket #economy #tech #earnings #IPO #Fed #tariffs #semiconductors
SPDR S&P 500 ETF (SPY)
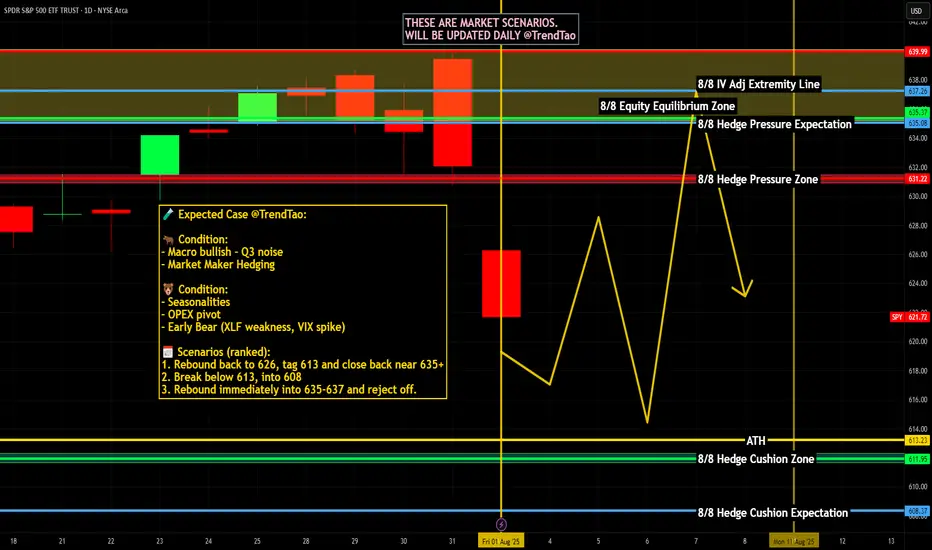
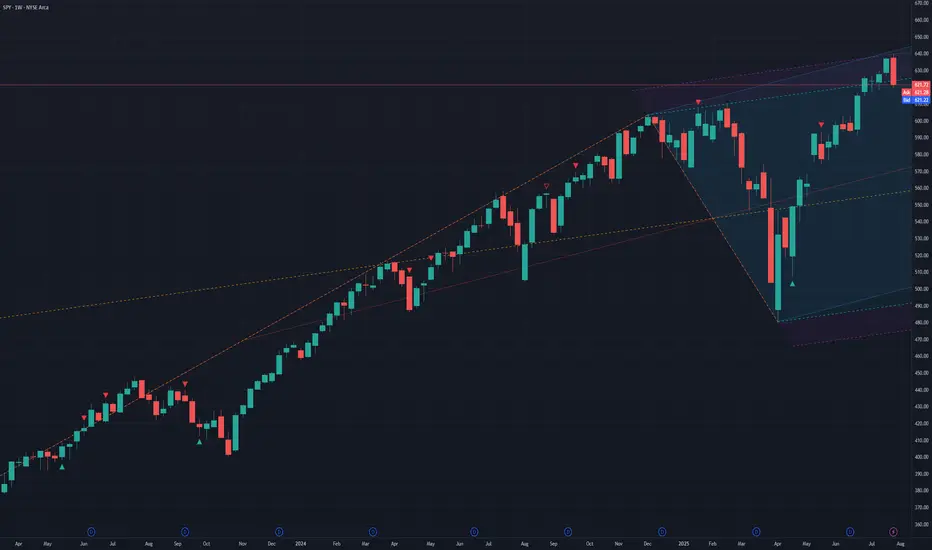
SHORT ON SPX/USDSpy has created a Double top followed by a CHOC and retest to the downside.
Their is plenty sell side liquidity to be collected as I expect a major drop on spy.
Looking to catch 300-400 points on SPY.

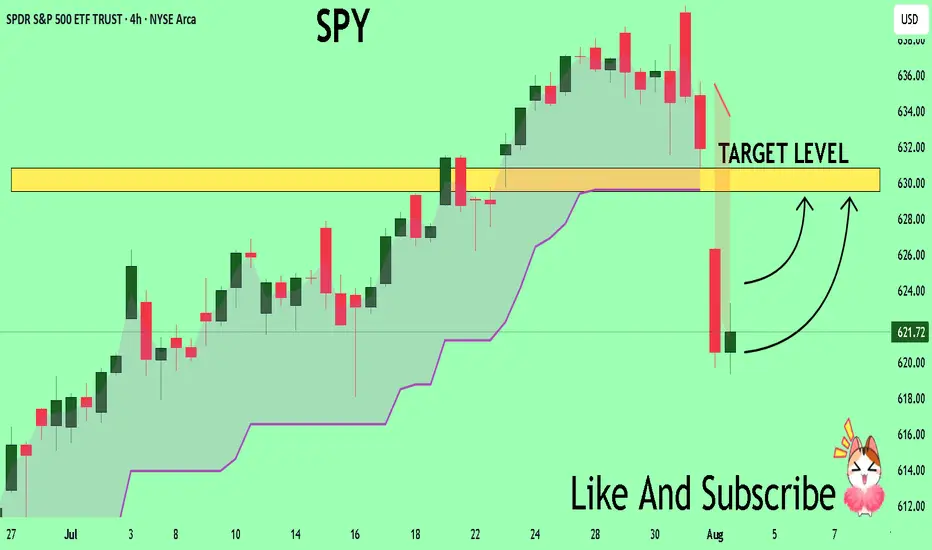
SPY Massive Long! BUY!
My dear subscribers,
My technical analysis for SPY is below:
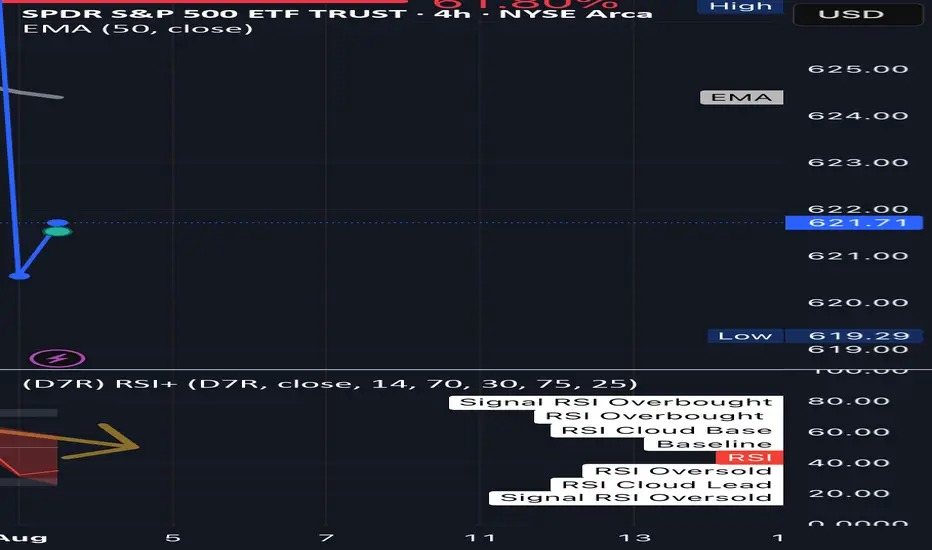
The price is coiling around a solid key level - 621.72
Bias - Bullish
Technical Indicators: Pivot Points Low anticipates a potential price reversal.
Super trend shows a clear buy, giving a perfect indicators' convergence.
Goal - 629.55
About Used Indicators:
By the very nature of the supertrend indicator, it offers firm support and resistance levels for traders to enter and exit trades. Additionally, it also provides signals for setting stop losses
Disclosure: I am part of Trade Nation's Influencer program and receive a monthly fee for using their TradingView charts in my analysis.
———————————
WISH YOU ALL LUCK
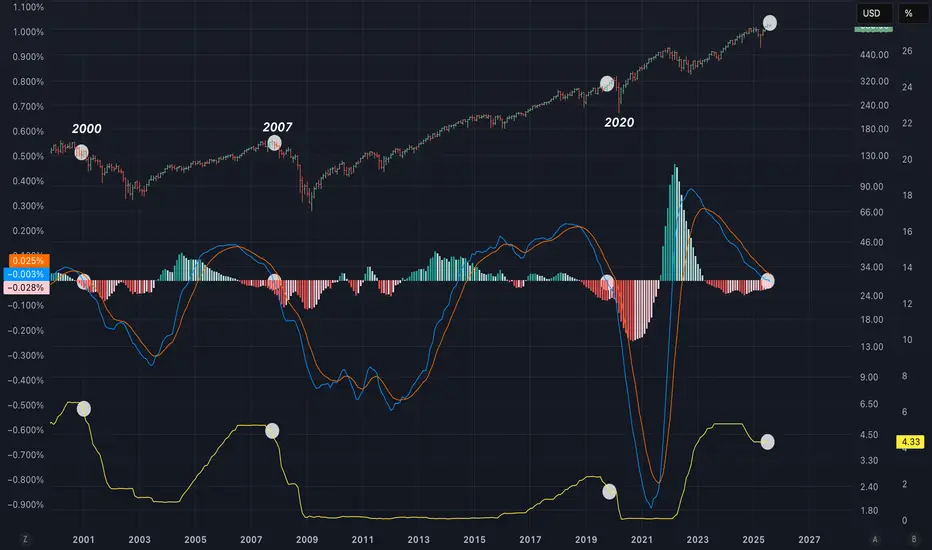
LMACD of the US02Y has just dipped bellow 0!In the past while rates have been elevated for a period of time things have gone bad for risk markets once the LMACD dipped bellow 0. Could be this time different?
SPY | Bullish | Day Trading AMEX:SPY
SPY has confirmed a bullish structural shift on the 1H chart following the August 1st liquidity sweep.
Key Developments:
A Higher Low (HL) was formed after a significant breakdown and volume climax.
Price has since reclaimed the descending trendline and is now trading above all major EMAs.
Momentum continues to build, supported by:
A clean break of the 38.2% Fibonacci retracement (631.37)
Bullish RSI posture with values trending above 50
Volume profile showing absorption on red candles and confirmation on green
Target Levels:
635.26: Prior resistance and key structural target
637.51: Upper liquidity zone and TP2 based on extension geometry
Support & Risk Management:
Primary structural support: 631.00–630.70
Invalidation level: 629.50
As long as price holds above 631, I remain bullish and expect continuation toward the 635–637 range in the next 1–2 sessions. Pullbacks into the 631 zone would present a potential re-entry or add-on opportunity.

$AEO Can Sydney Sweeney Get This Moving?NYSE:AEO – I have made some quick cash on this stock. (I have no position right now)
I may take another trade on it again but, that AVWAP from the all-time high, only about 18 months ago, shows that there are a lot of shareholders underwater looking to get out (overhead supply). Sydney Sweeney is going to have to help them sell a lot of jeans quickly to make this a legit leading stock.
Right now it seems for this to get goin, it needs a ton of volume as a meme stock in the short term. Which may make it a good day or shorter term swing trade. All TBD.
I am intrigued by this one so I am keeping a close eye on it.
Thanks for looking.

SPY/QQQ Plan Your Trade Update For 8-5This short video is to provide my followers with an update.
I'm still here. I'm still working on projects and new TV code. I have developed a couple of new strategies that I like and that seem to continue to perform.
Overall, I'm still doing my best to deliver superior analysis/results for my followers.
This video covers the SPY/QQQ, Gold/Silver, and BTCUSD (plus extras).
Hope you are all getting some great profits from these moves.
GET SOME.
#trading #research #investing #tradingalgos #tradingsignals #cycles #fibonacci #elliotwave #modelingsystems #stocks #bitcoin #btcusd #cryptos #spy #gold #nq #investing #trading #spytrading #spymarket #tradingmarket #stockmarket #silver

Nightly $SPY / $SPX Scenarios for August 6, 2025🔮 Nightly AMEX:SPY / SP:SPX Scenarios for August 6, 2025 🔮
🌍 Market‑Moving News 🌍
🪙 Citi Lifts Gold Price Forecast Amid Global Uncertainty
Citi raised its short-term gold outlook to $3,500/oz, citing surging safe-haven demand driven by trade instability, softening labor metrics, and heightened geopolitical risk. Risk premiums and volatility remain elevated.
📉 Equities Tumble as Risk Aversion Returns
U.S. stocks slipped on renewed caution—investors rotated into bonds and precious metals following weaker job indicators and escalating trade friction. The dollar and gold strengthened, while equity futures pulled back.
📊 Key Data Releases & Events 📊
📅 Wednesday, August 6:
No major U.S. economic data releases scheduled for today. Markets are closely monitoring corporate earnings reports and commentary from Fed officials, including San Francisco Fed President Mary Daly later in the day.
⚠️ Disclaimer:
This content is for educational and informational purposes only—it is not financial advice. Always consult a licensed financial advisor before making investment decisions.
📌 #trading #stockmarket #economy #trade #currency #gold #earnings
SHORT ON US30US30 Has given us a nice CHOC (Change of Character) to the downside.
This indicates a huge potential of US30 dropping more after it pulls back into the supply zone that created the change.
Dollar news is also a catalyst today for this play. If news comes out good for PMI and makes the dollar rise... US30 could fall almost 3000 points over the next few days.
Take Advantage.

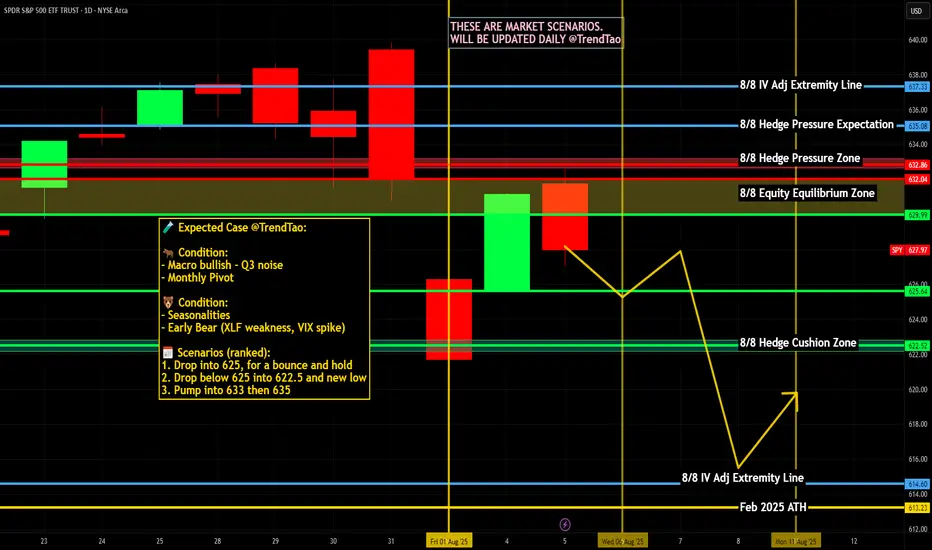
Nightly $SPY / $SPX Scenarios for August 5, 2025🔮 Nightly AMEX:SPY / SP:SPX Scenarios for August 5, 2025 🔮
🌍 Market‑Moving News 🌍
🔹 PBOC Moves Prompt FX Backlash
On August 5, 2019, China’s central bank allowed the yuan to depreciate over 2% to its lowest level since 2008. That same day, the U.S. Treasury officially designated China as a currency manipulator, citing the PBOC’s moves as retaliation for recent U.S. tariff actions. In response, China ordered state-owned enterprises to suspend purchases of U.S. agricultural goods—a significant blow to U.S. exporters.
🔹 EU Suspends Counter-Tariffs for Six Months
Following a negotiated framework with the U.S., the European Union suspended retaliatory tariffs on U.S. goods for six months. The move aims to de-escalate trade tensions while joint discussions continue.
🔹 Citi Raises Gold Price Outlook to $3,500/oz
Citi revised its short-term trading range for gold to $3,300–$3,600 per ounce, based on weakening U.S. labor data, rising inflation pressure from tariffs, and growing demand for safe-haven assets. Spot gold traded around $3,356 oz on Monday.
📊 Key Data Releases & Events 📊
📅 Tuesday, August 5:
8:30 AM ET – U.S. Trade Balance (June)
Expected to improve modestly to –$67.6 billion (from –$71.5B), reflecting tariff-influenced shifts in import/export volumes.
9:45 AM ET – S&P Global U.S. Final Services PMI & ISM Non-Manufacturing Index (July)
Key indicators of service-sector strength. Readings above 50 suggest expansion; below 50, contraction. Flash estimates forecast moderated growth in activity.
⚠️ Disclaimer:
This content is for educational and informational use only—not financial advice. Consult a licensed financial advisor before making investment decisions.
📌 #trading #stockmarket #economy #trade #data #inflation #currency

The Ghost of 1986-1987 Stock Market Overlay onto $IWMThe 1986-1987 stock market advance was 48% as measured by the S&P500 Index SP:SPX from the low in late 1986 which peaked in August 1987 and crashed into October 19th's spectacular 20% decline in one day.
The advance in the Russell 2000 Index from the low in 2023 to the high in 2024 was 51%, topping the 48% gain in the SP:SPX and the meltdown wasn't as spectacular, but it was similar.
There were similar patterns in fears of trade wars, US dollar declines, new tax laws going into effect back then and tax laws sunsetting this time. Those you can go into by reviewing my other charts I have published over the years here.
I stretched the 1987 pattern to fit the low to the high, so it isn't "exactly" the same time day-to-day for this pattern.
I found it interesting because the chart of AMEX:IWM all by itself had the same "look" to me as the 1987 bull market and crash so I decided to put it together for you all here to see.
I would expect a choppy market from here on as people adjust to the new uncertainties. Sellers of this decline will be shy to reinvest anytime soon and buyers are likely afraid to step up and get aggressive with so much uncertainty.
Sentiment as measured by AAII shows an extremely fearful and reluctant investor class, which is typical to see at major market bottoms.
Wishing everyone peace and prosperity!
Tim West
11:17AM EST April 24, 2025

A potential Swing Trade soon on SPY!?OptionsMastery:
🔉Sound on!🔉
📣Make sure to watch fullscreen!📣
Thank you as always for watching my videos. I hope that you learned something very educational! Please feel free to like, share, and comment on this post. Remember only risk what you are willing to lose. Trading is very risky but it can change your life!

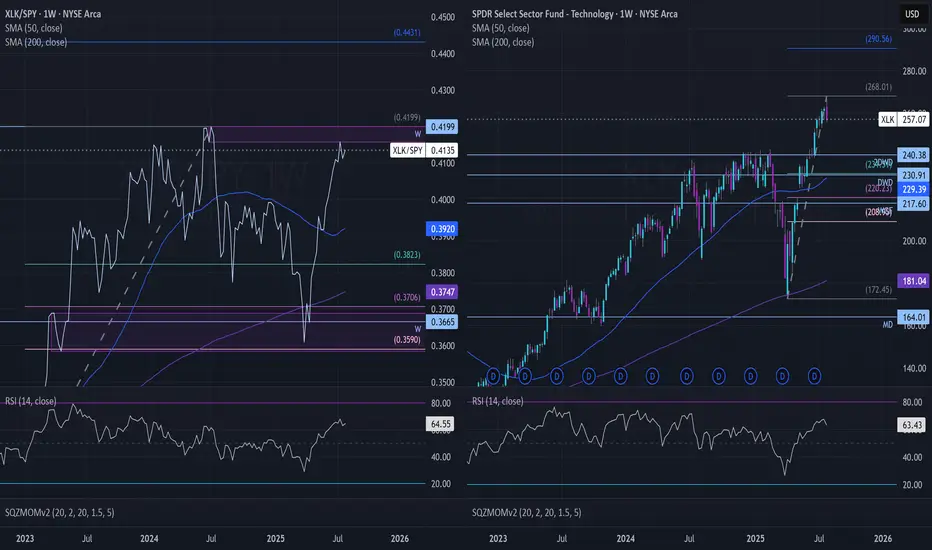
XLK Relative Strength – Leaders Extended, Rotation Risk BuildingXLK has been one of, if not the strongest sectors on a relative basis since bottoming at the end of March. Despite its relative strength, top SXLK holdings are into areas where profit-taking looks to be occurring, and a rotation out may be taking place (see Weekly Supply zone on RS chart 0.4157-0.4199).
This comes as NASDAQ:NVDA , NASDAQ:MSFT , NASDAQ:AVGO , and NASDAQ:INTU are into -0.236 fib. extensions. NYSE:ORCL and NASDAQ:PLTR show a similar picture, with NYSE:ORCL reaching the 1.618 extension, while NASDAQ:PLTR failed to reach its 1.618 extension at $162.05.
Weak:
$APPL, NYSE:CRM , NYSE:IBM , and NYSE:NOW are among the weakest performers. If $APPL doesn’t hold around $200.00, look for it to slump to the $170.00 area.
Trades:
Look for NASDAQ:AMAT to hold around $169.46 for a move to $205.06 (Weekly Supply) or $243.40 (Monthly supply). If NASDAQ:AMAT fails to hold the $169.46 print, expect a move to $156.75.
Look for NASDAQ:QCOM to hold $145.20 (Weekly) for a move to the $172.23 area (Weekly Supply).
Look for NASDAQ:ADBE to hold $329.30 for a move to $449.40 (could top out around $417.30 depending on buying volume).
Look for NYSE:ACN to hold $250.00 (Weekly), or I like it better a $218.32 (Monthly Demand).
Featured Chart:
Look for NYSE:APH to hold $100.71 (Daily close on 07/23) for a move up to $116.00-$116.50 area. If NYSE:APH fails to hold around the $100.00 mark, I’d expect a move below $95.00.
AMEX:XLK move down to $240.38?
Let me know your thoughts for or against any of these names in the comments.
XETR:AMEX :
Weekly $SPY / $SPX Scenarios for August 4–8, 2025🔮 Weekly AMEX:SPY / SP:SPX Scenarios for August 4–8, 2025 🔮
🌍 Market-Moving News 🌍
📦 U.S. Tariffs Finalized as August 7 Deadline Nears
President Trump’s administration confirmed newly finalized tariff rates—ranging from 10% to over 40%—on dozens of countries, set to take effect starting August 7. The announcement has heightened global trade uncertainty and injected volatility into equity markets
📉 Weak Jobs Data Spurs Concern
July’s nonfarm payrolls came in at just 73,000 jobs added, far below expectations, while revisions to May and June data subtracted a combined 258,000 jobs. In response, the administration fired the Bureau of Labor Statistics head, escalating political risk around economic transparency
📈 U.S. Shows Resilience Amid Policy Chaos
Despite the tariff-era turbulence and labor softness, U.S. Q2 GDP rose by 3%—outperforming forecasts. Businesses racked up inventory as a hedge, absorbing initial price shocks. Still, concerns about sustained inflation pressures and waning consumer confidence linger
🎯 Earnings Week Spotlight on Tech & Industrial Names
Major companies reporting include Palantir (Monday), AMD, Uber, Disney, McDonald’s, Gilead, Pfizer, Constellation Energy, and Eli Lilly. Markets will watch for AI signals, consumer demand, and industrial trends
📊 Key Data Releases & Events 📊
📅 Monday, August 4
Factory Orders (June) — Critical for industrial demand and trade momentum.
📅 Tuesday, August 5
ISM U.S. Services PMI (July) — Thermometer for expansion in the biggest part of the economy.
S&P U.S. Services PMI (July, flash) — Preliminary signal on service-sector strength.
Trade Balance (June) — Watching for impact of tariffs and shifting cross-border flows.
📅 Thursday, August 7
Initial & Continuing Jobless Claims — Weekly labor-market readings post weak payroll report.
Productivity & Labor Costs (Q2) — Reflect business efficiency and wage trend shifts.
Wholesale Inventories (June) — Key for supply-chain and inventory cycle insights.
Consumer Credit (June) — Measures household borrowing resilience.
📅 Friday, August 8
Fed Speech: St. Louis Fed President Musalem — Market-watchers will look for cues on the near-term rate path.
⚠️ Disclaimer:
This weekly outlook is for educational and informational purposes only and should not be construed as financial advice. Always consult a licensed financial advisor before making investment decisions.
📌 #trading #stockmarket #economy #tariffs #jobs #earnings #inflation #Fed #technicalanalysis
SPY 4H – Broke the Fib… Now What? Just Sharing What I See Hey People,
not an expert, just showing what i’m seeing on the 4H chart 👇
🧭 quick breakdown:
SPY ran up to around 639, then started dumping.
i dropped a fib from top to bottom and it hit the 61.8% level (626.66)… then lost it.
right now we’re sitting around 621, so it already broke a big level.
🧠 what that might mean:
if price gets back above 626, maybe we bounce back toward **629**
if not, and it keeps chilling under that **50 EMA (around 624)**, it’s probably still weak
nothing confirmed yet, i’m just watching how price moves around those spots.
⚠️ RSi is sketchy too:
rsi is making lower highs, even when price was up; that’s called bearish divergence
basically means momentum isn’t really behind the move
📉 If it keeps dropping:
if we lose 621, next support might be around **615**
and if that breaks? maybe even **610 gets swept** before any bounce
📝 Just how i’m seeing it rn:
not calling anything, just building my plan out loud
Still learning. open to feedback if you see something different
what levels are you watching?
I want everyone to win. 💛
S&P 500: Bearish For The Short Term! Sell It!Welcome back to the Weekly Forex Forecast for the week of July 28 - Aug 1st.
In this video, we will analyze the following FX market for the week of Aug 4-8th:
S&P 500 (ES1!)
The S&P 500 rose Friday to fresh highs, following a busy week of tariff updates and earnings. The S&P ended the week with its fifth straight record close, its longest such streak in over a year.
No reason to consider selling. Wait for pullbacks to FVGs for high probability buys.
FOMC and NFP loom. Be careful to avoid new entries during news times.
Enjoy!
May profits be upon you.
Leave any questions or comments in the comment section.
I appreciate any feedback from my viewers!
Like and/or subscribe if you want more accurate analysis.
Thank you so much!
Disclaimer:
I do not provide personal investment advice and I am not a qualified licensed investment advisor.
All information found here, including any ideas, opinions, views, predictions, forecasts, commentaries, suggestions, expressed or implied herein, are for informational, entertainment or educational purposes only and should not be construed as personal investment advice. While the information provided is believed to be accurate, it may include errors or inaccuracies.
I will not and cannot be held liable for any actions you take as a result of anything you read here.
Conduct your own due diligence, or consult a licensed financial advisor or broker before making any and all investment decisions. Any investments, trades, speculations, or decisions made on the basis of any information found on this channel, expressed or implied herein, are committed at your own risk, financial or otherwise.

ES | SP500 - Weekly Recap & Gameplan - 03/08/25📈 Market Context:
Traders are currently anticipating a possible 0.25% rate cut during the upcoming September FOMC meeting, which continues to support the broader bullish framework.
Although the market pulled back after the Non-Farm Employment Change data came in below expectations, overall optimism remains.
Sentiment has now cooled off from last week's greed and shifted to a more neutral stance. Historically, August tends to bring some chop and pullbacks, but the structural bias still leans bullish.
🧾 Weekly Recap:
• ES kicked off the week with strong upward momentum, climbing steadily into Thursday.
• Along the way, price swept a key 4H swing high, breaking into new highs before initiating a retracement.
• This price action hinted at a short-term distribution and possible liquidity grab ahead of a correction.
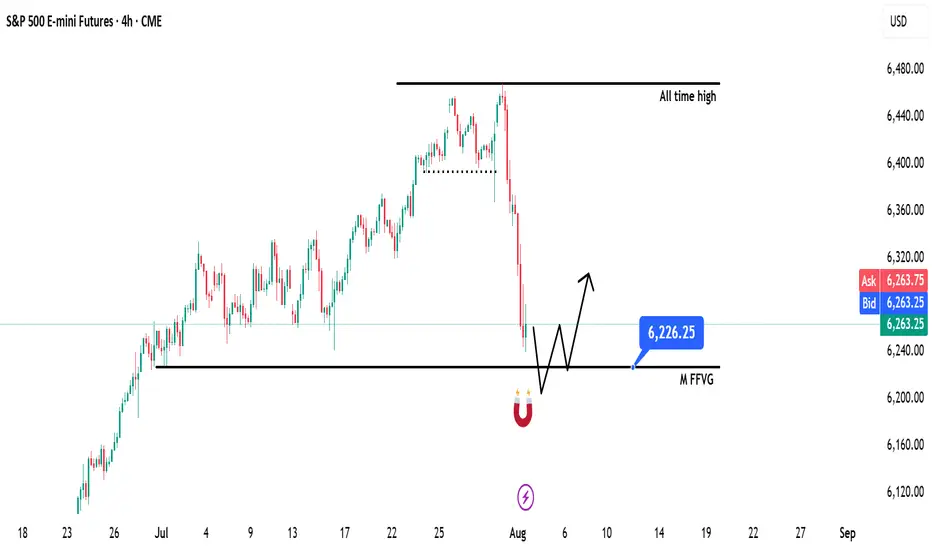
📌 Technical Outlook & Game Plan:
→ I'm anticipating a move into the Monthly Fair Value Gap — a high-probability liquidity zone on my radar.
→ That area could act as a springboard for bullish continuation or at least provide a strong reaction.
→ Until that happens, I remain short-biased targeting the 6226$ zone, which I've marked as a major level.
🎯 Setup Trigger:
Once price taps 6226$, I'll monitor for:
• Clear break of structure on the 4H and 1H timeframes
• Formation of new demand zones indicating potential reversal
→ On confirmation from the lower timeframes, I’ll shift my focus toward long setups, potentially targeting new highs.
📋 Trade Management:
• Stoploss: Below the demand zone formed on 1H–4H
• Target: I’ll trail my stop to lock in profits as price moves higher
• Note: Although I’ll be watching for ATH retests, I plan to manage risk actively and book profits along the way
💬 Like, follow, and comment if this breakdown supports your trading! I’ll be sharing more detailed setups and educational posts — stay connected!
SPY: Growth & Bullish Forecast
The price of SPY will most likely increase soon enough, due to the demand beginning to exceed supply which we can see by looking at the chart of the pair.
Disclosure: I am part of Trade Nation's Influencer program and receive a monthly fee for using their TradingView charts in my analysis.
❤️ Please, support our work with like & comment! ❤️

Stock Market Forecast | TSLA NVDA AAPL AMZN META MSFTStock Market Forecast | CME_MINI:NQ1! CME_MINI:ES1! SPY QQQ
Mag 7 Forecast | NASDAQ:TSLA NASDAQ:NVDA AAPL AMZN META MSFT GOOG

SPY to continue fallingSPY reached a top (resistance) fork line and started to fall. Based on this I entered long on VIX on July 28, when VIX was at its lowest point. I expect this fall of the market to continue.
08/1/25 Trade Journal, and ES_F Stock Market analysis EOD accountability report: +440
Sleep: 6 hours
Overall health: Good
VX Algo System Signals from (9:30am to 2pm)
— 9:30 AM Market Structure flipped bearish on VX Algo X3!
— 10:12 AM VXAlgo ES X1 Buy signal
— 10:20 AM VXAlgo NQ X1 Buy Signal
—12:30 PM Market Structure flipped bullish on VX Algo X3!
— 1:00 PM Market Structure flipped bearish on VX Algo X3!
— 1:50 PM VXAlgo ES X1 Buy signal,
— 3:00 PM Market Structure flipped bullish on VX Algo X3!**
What’s are some news or takeaway from today? and What major news or event impacted the market today?
Market range expanded a lot today, we dropped over 100 points today and sometimes i forget to adjust my bracket orders to go for 10 -15 points take profits when the volatility is so high. But overall, it was a good day, I knew to be patient as market was wild and sometimes you want to just snipe a few trades and call it a day before you get caught on the wrong side.
The great thing about big moves is that it will eventually hit a major level and it will react really well, you just have to wait for it.
a great question is will the market recover? Or is going back down to April prices?
News
*STOCKS TUMBLE TO END THE WEEK, VIX SPIKES AS SOFT JOBS DATA STOKE ECONOMIC JITTERS
What are the critical support levels to watch?
--> Above 6330= Bullish, Under 6310= Bearish

OEX /SPX Bullish wave 5 pattern crossroads The chart posted is the sp 100 I am posting it as we are now at the crossroad for bull or bear count .We have rallied to .786 as I will show and have a wave a x 1.27 = c at the .786 High But if we break above 5922 in the Cash SP 500 There is NOTHING to stop it from reaching a target of 3005 in the OEX where wave A up or wave 1 x 1.618 = wave C Top or wave 3 in the SP 500 WAVE A or WAVE 1 up 5481 - 4835 = 646 x 1.618 =1045 plus wave B low or wave 2 5102low= 5102plus 1045 =6147.22 The exact high . This is the reason I took the loss and moved LONG .Best of trades WAVETIMER

CARRY TRADE RISK IT IS SHOWING CRACKSThe chart posted in my work on TSXV:USS yen I have NOT CHANGED THE WAVE STRUCTURE AT ALL take notice of my statement CRASH COMING
