SPY Short From Resistance! Sell!
Hello,Traders!
SPY went up again
To retest a wide horizontal
Resistance level of 551.00$
And as the political situation
Remains unstable we are
Bearish biased and we will
Be expecting a local move down
Sell!
Comment and subscribe to help us grow!
Check out other forecasts below too!
Disclosure: I am part of Trade Nation's Influencer program and receive a monthly fee for using their TradingView charts in my analysis.
Spy!

S&P 500 Technical Analysis: Z-Score HMA Indicator OutlookOutside of the obvious news on Tarriffs, let's just focus on technicals for a moment:
In case you’re in a hurry:
My HMA Z-Score Probability Indicator is currently signaling overbought conditions.
The Z-Score has moved into the upper green zone, a level where reversals have historically occurred.
Hull Moving Average (HMA) remains upward for now, but is approaching a potential flattening point.
Price continues to respect a descending trendline, indicating resistance remains intact.
Unless the trendline is broken with conviction, the probability favors a bearish reversion in SPY.
HMA Z-Score Indicator Forecast: SPY Nearing Reversion Risk
This week, my HMA Z-Score Probability Indicator is signaling a statistically significant overbought condition in SPY. In case you are unfamiliar, this tool blends the statistical power of the Z-Score with the responsiveness of the Hull Moving Average to give us high-probability momentum and mean reversion setups.
Let’s break down what it’s showing right now and why a pullback may be imminent.
Z-Score in the Green: What That Means
The Z-Score component of my indicator is now in the upper green zone, which I’ve defined as statistically overbought territory. This isn’t arbitrary, it's based on historical distribution thresholds that flag when price has moved too far, too fast from its average.
In past instances when the Z-Score has reached these levels, the market has often reverted back toward the mean. It's not guaranteed, of course but the odds shift. This is one of the key features of my indicator: identifying these moments where the risk/reward tilts away from chasing price and toward anticipating a reversion.
HMA as a Momentum Filter
The Hull Moving Average (HMA) provides the trend context in this setup. Right now, the HMA is still pointing upward, but it’s starting to show early signs of rounding off. If it begins to flatten or turn downward while the Z-Score remains elevated, that would act as a confirmation of a momentum shift and strengthen the case for a pullback.
The HMA has consistently helped filter out false Z-Score signals when the trend is strong. But when both tools start aligning, that's when I pay closer attention.
Descending Trendline Holding as Resistance
On the chart, I’ve drawn a descending trendline connecting recent swing highs. So far, price has failed to break through this line, continuing a pattern of lower highs.
As long as price respects that line, it suggests sellers are still in control of the short-term structure. If SPY gets rejected again here, particularly while the Z-Score is elevated, the probability of a downside move increases significantly.
Bearish Bias: What the Data Suggests
The core logic behind this setup is based on reversion to the mean. When price extends beyond typical volatility bands (as measured by the Z-Score) and momentum stalls (as reflected by the HMA), it often precedes a return to more normalized levels.
Right now, we have:
A Z-Score reading in overbought territory,
A potentially topping HMA,
Resistance still holding at the descending trendline.
That’s a confluence of signals that, in my indicator's design, suggests a bearish reversion is more likely than a continuation.
What I’m Watching This Week
To confirm the setup, I’ll be watching for:
HMA flattening or beginning to roll over,
Break of recent short-term support to trigger downside momentum.
If these conditions start stacking up, the short bias becomes actionable. If instead we see a breakout above the trendline with conviction and volume, I’ll re-evaluate because no indicator is bigger than price.
The HMA Z-Score Probability Indicator is designed to anticipate high-probability turning points, and right now, it's signaling elevated risk for a short-term reversal in SPY.
As always, these are probabilities, not certainties.

SPY Resistance coming upVolume and trend analysis showing key levels to watch. But in this market single chart analysis is not enough. I look at Dollar Index, Gold, 10Y Treasury Bonds. All indicate low confidence in USA economy. Unless these improve I will remain bearish even if SPX,SPY breaks to the upside.
But most likely the markets will reverse at max resistance, as the hedge funds who are under liquidity pressure will start selling again

SPX: Roller Coaster Fest. Looking for a possible short?Not FA*
A lot of set ups looking like flags. Missed the move up but caught puts today for good profit. Or decent profit. I have yet to conquer on how NOT to sell too early? Anyone have any tips?
Set up I’m seeing right now (SPY/SPX): Looks to be flagging.
Green Ray for a short entry
Overall sentiment still feels very bearish. Trump seemed to postpone the tariffs to prevent this market from tanking into near *recession* touches but some say it was a manipulative swing?
So thinking we sell off Friday - as China tariff deal still yet to solidify. A lot of uncertainty overall.
Also on the 1M, the set up looks like a bear flag.
Let me know what you guys think and any insight is welcome! Still new to TA and really wanting to get better at understanding charts/levels. Goal is to be consistent in trading and profitable, very profitable.
GLHF

SPY Massive Long! BUY!
My dear subscribers,
SPY looks like it will make a good move, and here are the details:
The market is trading on 534.03 pivot level.
Bias - Bullish
My Stop Loss - 519.46
Technical Indicators: Both Super Trend & Pivot HL indicate a highly probable Bullish continuation.
Target - 560.94
About Used Indicators:
The average true range (ATR) plays an important role in 'Supertrend' as the indicator uses ATR to calculate its value. The ATR indicator signals the degree of price volatility.
Disclosure: I am part of Trade Nation's Influencer program and receive a monthly fee for using their TradingView charts in my analysis.
———————————
WISH YOU ALL LUCK

TESLA BULLISH 14th April 2025Do not blindly trade anything without maanging your risk.
If market supports then I am expecting a green candle in Tesla.
Again please do not blindly trade anything ever. Hope this helps and yes I am long

SPY/QQQ Plan Your Trade For 4-14 : Up-Down-Up PatternToday's pattern suggests the markets will move in a moderate upward price trend.
Although I don't expect anything huge today, I do believe the EPP structures/layers support this upward price move and that we'll see the SPY attempt to move back towards/above 550 over time.
The QQQ will likely follow the SPY higher over the next 5+ days.
Don't get too excited about this upward price move because it is structurally moving to setup a PEAK that will transition into a downtrend near April 22-25. This peak will create a downward price flag (a new inverted EPP) structure that will assist in developing a new sideways price structure carrying into June/July.
In other words, it looks like we are trapped between 480-585 on the SPY, and we will likely stay within that wide consolidation range for another 2-3 months.
Gold should attempt to rally this week, trying to break above $3300. I believe this is a critical level for Gold and also presents a breakaway level for Silver near $33.00
Bitcoin has moved into APEX VOLATILITY and will continue to trap BUYERS into believing BTCUSD is breaking away from the consolidation range. This is a BULL TRAP.
I believe BTCUSD will ROLL OVER within about 4-5 days - setting up a big breakdown move as the SPY/QQQ also roll downward in about 5+ days.
We still continue to see volatility and sideways price action. Still lots of opportunities for skilled traders.
Get Some..
#trading #research #investing #tradingalgos #tradingsignals #cycles #fibonacci #elliotwave #modelingsystems #stocks #bitcoin #btcusd #cryptos #spy #gold #nq #investing #trading #spytrading #spymarket #tradingmarket #stockmarket #silver


Tariff Exemptions Stir the Bounce | SPX Analysis 14 April 2025It’s Monday… and the markets are once again dancing like a puppet on a tweet-fuelled string.
One minute, tariff fears.
The next, selective exemptions for “favourites.”
Now the weekend’s over and futures are bouncing higher like none of it happened.
SPX looks set to test – or break – the 5400 bull trigger, and if you’ve been following the last few newsletters, you’ll know that’s a big one.
We’ve mapped it.
We’ve rejected it.
Now we’re staring it down… again.
---
The 5400 Line Returns
Let’s back up.
5400 has been my bull/bear trigger for weeks.
When we’re below it, I’m hunting bear swings.
Above? I start reassessing bullish setups, GEX bulls-eye trades, and pullback long entries.
This week, the GEX flip is also sitting around 5400.
That’s no coincidence.
It’s now more than just a price level –
It’s the emotional fault line between headline-driven panic and headline-driven hope.
So… do we flip bullish?
Not so fast.
Strategy: Structure First, Narrative Second
Just because futures are up doesn’t mean momentum is back.
We’ve seen far too many fakeouts, tweet-spikes, and algorithm blinks to trust the first move on a Monday.
That’s why my plan is simple this week:
✔️ 5400 is still the decision line
✔️ No aggressive trades until price confirms
✔️ Will adapt only if structure shifts – not just sentiment
This week isn’t about swinging for the fences.
It’s about precision. Patience. And setup clarity.
Behind the Charts: Tinkering, Rebuilding, Refining
While the markets work out their next identity crisis, I’m taking the time to:
Optimise my new charting layout
Tweak + update my indicator codebases
Re-align my tools for speed and efficiency
Because if the market wants to act like a circus,
I’ll tighten the tent and sharpen the knives.
---
Expert Insight – Don’t Rush the Flip
Common mistake:
Flipping long just because futures are green.
Fix:
Use anchored levels like 5400 as your decision points – and only flip bias when structure confirms.
GEX flips, pulse bars, and price action matter.
Tweets do not.
---
Fun Fact
Did you know?
In 2023–2024, over 60% of intraday SPX rallies over 1.5% failed to hold past 2 days when triggered by political headlines.
Translation?
Headline rallies are easy to sell into – unless they’re confirmed by price.

SPX sharp moves begin arround monthly option expiryWatch out for the this weeks options expiry on Thursday (Friday being holiday)
During volatile time option expiry does produce sharp moves. They are not that significant during normal markets. Also key levels approaching. Monday after Easter, I am expecting the new move to happen. Breakdown or breakout.
I am sure the big boys are aware from the social media that everyone is expecting a reversal and they will set up a trap. They will make us thing we are wrong create a FOMO to the upside and then sell
A volume drop could indicate a big move


Weekly $SPY / $SPX Scenarios for April 14–17, 2025🔮 🔮
🌍 Market-Moving News 🌍:
🏦 Major Financial Earnings Reports: This week, investors will focus on earnings from prominent financial institutions, including Goldman Sachs, Bank of America, and Citigroup. These reports will provide insights into the financial sector's health amid recent market volatility.
📺 Tech and Healthcare Earnings: Key tech and healthcare companies such as Netflix, TSMC, and UnitedHealth Group are also scheduled to release earnings. Analysts will scrutinize these reports for indications of sector performance and future outlooks.
🏠 Housing Market Indicators: The release of housing starts data and a homebuilder confidence survey will shed light on the housing sector's response to recent economic conditions and tariff implementations.
🇪🇺 European Central Bank Meeting (April 17): The ECB is expected to address recent tariff developments and may announce interest rate decisions in response to economic pressures.
📊 Key Data Releases 📊
📅 Monday, April 14:
🗣️ Philadelphia Fed President Patrick Harker Speaks (6:00 PM ET): Insights into regional economic conditions and monetary policy perspectives may be provided.
🗣️ Atlanta Fed President Raphael Bostic Speaks (7:40 PM ET): Remarks may offer perspectives on economic developments and policy considerations.
📅 Tuesday, April 15:
📈 Import Price Index (8:30 AM ET):
Forecast: +0.1%
Previous: +0.4%
Measures the change in the price of imported goods, indicating inflationary pressures.
🏭 Empire State Manufacturing Survey (8:30 AM ET):
Forecast: -10.0
Previous: -20.0
Assesses manufacturing activity in New York State, providing early insights into industrial performance.
📅 Wednesday, April 16:
🛍️ Retail Sales (8:30 AM ET):
Forecast: +1.2%
Previous: +0.2%
Indicates consumer spending trends, a primary driver of economic growth.
🏭 Industrial Production (9:15 AM ET):
Forecast: -0.2%
Previous: +0.7%
Measures the output of factories, mines, and utilities, reflecting industrial sector health.
🏠 Homebuilder Confidence Index (10:00 AM ET):
Forecast: 38
Previous: 39
Gauges builder sentiment in the housing market, indicating construction activity trends.
📅 Thursday, April 17:
📈 Initial Jobless Claims (8:30 AM ET):
Forecast: 223,000
Previous: --
Reports the number of individuals filing for unemployment benefits for the first time, reflecting labor market conditions.
🏠 Housing Starts (8:30 AM ET):
Forecast: 1.41 million
Previous: 1.5 million
Tracks the number of new residential construction projects begun, indicating housing market strength.
🏭 Philadelphia Fed Manufacturing Survey (8:30 AM ET):
Forecast: 3.7
Previous: 12.5
Measures manufacturing activity in the Philadelphia region, providing insights into sector health.
🏦 European Central Bank Interest Rate Decision: The ECB will announce its interest rate decision, with markets anticipating a potential cut in response to tariff impacts.
⚠️ Disclaimer: This information is for educational and informational purposes only and should not be construed as financial advice. Always consult a licensed financial advisor before making investment decisions.
📌 #trading #stockmarket #economy #news #trendtao #charting #technicalanalysi


SPY, More pain to come? SPY / 1D
Hello Traders, welcome back to another market breakdown.
SPY is showing strong bearish momentum, breaking below resistance. However, the price is in the oversold zone for now. Hence, instead of jumping in at current levels, I recommend waiting for a pullback into the middle of the range zone for a more strategic entry.
If the pullback holds and sell mode confirms, the third leg lower could target new lows.
Stay disciplined, wait for the market to come to you, and trade with confidence!
Trade safely,
Trader Leo.

SPY/QQQ Plan Your Trade Overview For 4-12 : Thank youThis video is mostly a big thank you for all the great comments and questions over the past few weeks.
I've been posting these videos on TradingView for almost a year and the types of viewers/followers I've been gaining is incredible.
You guys & gals have really impressed me with your questions and engagement. Many of you follow me for months without ever commenting or asking any questions.
I received a call from a client/follower in Alberta last night and he reported last week's gains at over 300% by following my videos.
I received a message from another TV follower saying he's been following my videos for many months and, after a bad loss a few years back, he has decided to give trading another go.
I've stated it before and I'll keep saying it.. I'm not trying to scam you out of anything. I'm trying to show you the RIGHT SKILLS and TECHNIQUES for you to learn to become a better, more skilled trader.
The way I look at it is like this...
If I can teach you half of what I know and see on the charts, then you guys will be able to achieve so much greater success and have gained/retained the knowledge to do it on your own.
You watch me do it over and over on these charts. Guess what - you are LEARNING at the same time.
Now, after a couple of years of doing this and following my videos, you've GAINED an education on how to trade more efficiently, manage risk more efficiently, and achieve your trading goals (I hope).
Right now, I'm getting messages/comments from people saying they are making 200%, 300%, 500%, or more every week or two from my videos.
That is absolutely incredible. I just want to urge you to remember I'm not 100% perfect in predicting the markets. No one EVER really is 100% perfect at it.
In the long run, as long as you don't get super greedy, you'll survive any minor losses and live to trade another day.
That is probably the most important thing I can teach you - trade within a proper scale to your RISK LEVEL. Never BET THE FARM on your trades. Always have a 50% to 70% cash reserve.
Anyway. Thank you. I really appreciate all of you.
Hope you enjoy this video.
#trading #research #investing #tradingalgos #tradingsignals #cycles #fibonacci #elliotwave #modelingsystems #stocks #bitcoin #btcusd #cryptos #spy #gold #nq #investing #trading #spytrading #spymarket #tradingmarket #stockmarket #silver

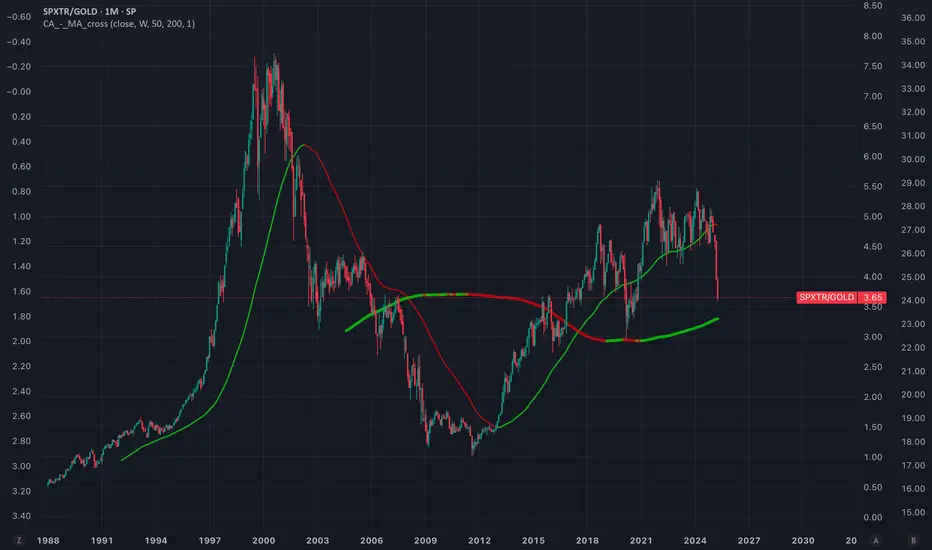
SPX/GOLD ratio near to key supportcrossing below moving average of 200 months could trigger a secular movement in favour of gold.
Potential global debt colapse and lack of confidence in USD + high valuation, mag-7 concentration and high growths expectations on AI are macro/fundamental facts that supports this idea.
Barrick Gold (strong buy) I want you guys take a look at some things real quick
Current Environment Macro Landscape:
Defensive + Hard Assets -
Gold, Miners, Energy, Real Estate (inflation hedges)
AI & Mega Cap Tech -
MSFT, NVDA, AMZN — inflows
China / Trade War Plays -
FCX, CAT, Global Industrials
Reflation / Commodity Rotation-
Oil, Copper, Uranium, Ag plays
gold:
safe haven play amid geopolitical risk and tariffs
Strong correlation with real interest rates + USD — lower rates + weaker dollar = bullish
Tariffs = inflationary = bullish for gold
Strong gold reserve base + relatively low AISC
copper:
1. China Tariffs = Industrial Policy Countermoves
If the U.S. imposes more tariffs on China, China could respond with stimulus or infrastructure spending — which increases demand for copper.
China is the world’s largest consumer of copper, and its response to tariffs often includes pro-growth policies.
2. Copper is Critical for EVs, Grids, and Renewables
Global push toward electrification, clean energy, EVs, etc., requires a massive amount of copper.
Demand is secular, not cyclical — even if tariffs temporarily suppress growth, the long-term demand curve is strong.
3. Tight Supply Outlook
Copper supply is constrained globally. Many copper mines are aging, with long lead times for new projects.
Barrick is developing world-class copper assets (e.g., Reko Diq in Pakistan — one of the largest undeveloped copper-gold deposits in the world).
lets not forget the most revenue being generated from operations comes from their Nevada mines.. US PRODUCTION
gold barrick isnt the only mining company money is moving to, take some thought into moving money to commodities

April 11th Trade Journal & Market AnalysisApril 11th Trade Journal & Market Analysis
EOD accountability report: +1566.50
Sleep: 6 hour, Overall health: going thru Flu symptoms
**Daily Trade Recap based on VX Algo System **
12:08 PM Market Structure flipped bullish on VX Algo X3!
1:00 PM VXAlgo ES X1 Sell Signal (2x Signal)
Today was a very choppy for the early part of the day, tested pre market lows and almost broke it because of consumer sentiment.
We eventually bounce and started moving upward toward the 5 min and 10 min resistance , and eventually broke out with the market structure flipping bullish at 12:08, we went back for a 1 min MOB backtest and pushed up further.
Monday plan; look for back to support as noted on the video

Trump Tariffs - Trade War - High Volatility - Key LevelsEasy trading for 2025, right? Haha
We are seeing some of the wildest swings ever in the markets
Extreme intraday swings and volatility is getting everybody's attention
This video discusses all key levels and current seasonality
Hoping for the best and preparing for the worst

SPY/QQQ Plan Your Trade For 4-11 : Break-Away in CarryoverToday's Break-away pattern suggests the SPY/QQQ will attempt to move (break) away from yesterday's Body range. I believe this trend, after the recent Ultimate Low in price, will be to the upside.
I know a lot of people are asking, "why do you think the markets are going to rally now - after you suggested the markets would trend downward?"
Things have changed now that we have a 90-day pause in the tariff wars. Yes, China is still an issue - but the rest of the world seems to have a pause on the tariff wars as negotiations continue.
I believe the removal of the tariff pressure on the markets will result in a moderate upward trend as we move into Q1:2025 earnings season.
Still, I don't believe we will see new ATHs anytime soon. But I do believe the 580+ level on the SPY is a potential high price level that can be reached before the end of April 2025.
Gold and Silver are moving into a GAP trend move today. I believe the GAP will be to the upside and I believe Gold and Silver will continue to rally.
Silver is really low in terms of comparison to Gold. Silver could make a very big move to the upside over the next 30+ days.
BTCUSD is still consolidating into the narrow range I suggested would happen before the bigger breakdown event near the end of April (into early May).
Everything is playing out just as I expected. The big change is the removal of the tariffs for 75+ nations (for now). That will give the markets some room to the upside and we need to understand how price structure is playing out into an A-B-C wave structure.
Get some.
#trading #research #investing #tradingalgos #tradingsignals #cycles #fibonacci #elliotwave #modelingsystems #stocks #bitcoin #btcusd #cryptos #spy #gold #nq #investing #trading #spytrading #spymarket #tradingmarket #stockmarket #silver

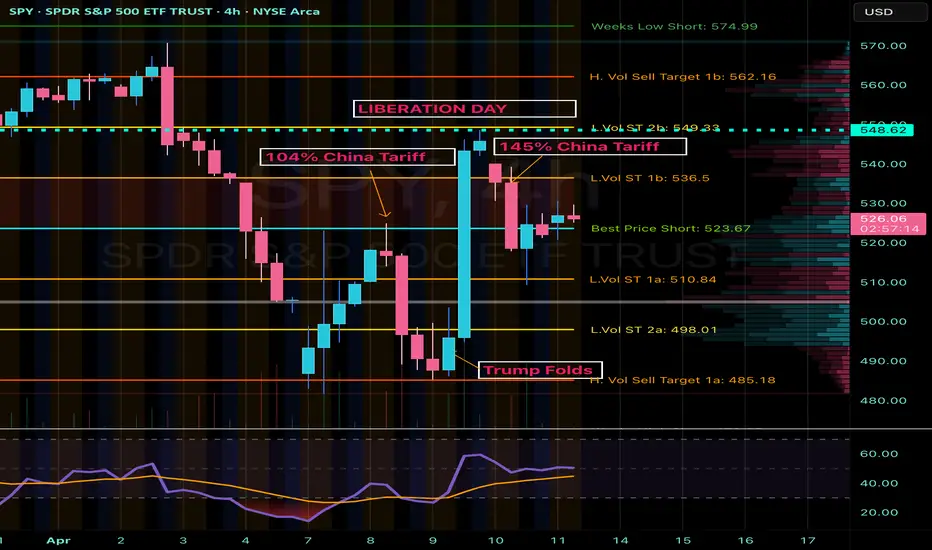
SPY Analysis: Navigating Tariff-Induced VolatilityContinuing from my last update, market volatility remains high due to Trump's unpredictable policy decisions. After initially folding and offering economic relief, Trump pivoted sharply with a sudden 145% tariff announcement. Today, China countered strongly with a 125% tariff. These escalating tariff exchanges continue to create significant uncertainty and market fluctuations, highlighting the critical need for careful analysis and precise trade management.
Technical Breakdown (4-Hour Chart)
Current Price Zone: Around $528.45
Key Resistance Levels:
- Immediate Resistance: $536.50 (L.Vol ST 1b)
- Critical Resistance: $549.33 - $549.60 (L.Vol ST 2b)
- Major Resistance Zone (Liberation Day): Approximately $562.16
Support Levels:
- Initial Support: $523.67 (Best Price Short)
- Secondary Support: $510.84 (L.Vol ST 1a)
- Important Lower Support: $498.01 (L.Vol ST 2a)
- Strong Support Level (Trump Folded area): ~$485.18
Trading Scenarios
Bullish Scenario (Potential Tariff Tension Relief):
- Entry Trigger: Confirmed breakout and sustained hold above resistance at $536.50.
Profit Targets:
- Target 1: $549.33 (next strong resistance level)
- Target 2: $562.16 (major resistance)
- Stop Loss: Below immediate support at $523.67, carefully managing downside risk.
Bearish Scenario (Ongoing Tariff Escalation or Increased Market Fear):
Entry Trigger: Inability to reclaim $536.50, or a decisive breakdown below support at $523.67.
Profit Targets:
- Target 1: $510.84 (nearest significant support)
- Target 2: $498.01 (secondary critical support)
- Target 3: $485.18 (robust support area)
- Stop Loss: Above resistance at $536.50 to protect against potential reversals.
Thought Process & Final Thoughts
The SPY currently trades within clearly defined resistance and support bands, heavily influenced by unpredictable tariff-driven headlines. Trump's volatile policy shifts and China's assertive retaliations amplify short-term market risks. Maintain flexible trading strategies, adhere strictly to established levels, and practice disciplined risk management. Continuous monitoring and swift response to evolving market sentiment will be essential for navigating this challenging environment effectively.
Gold ETF(GLD) - Gold is the Safe Haven?Is Gold the safe haven from all the market turmoil? Looking at the chart, it would appear that Gold is unfazed by current market conditions. Price is still making All-Time Highs as price continues to swing above the 25(green), 100,(yellow) and 200(blue) day EMAs. Further fears in the Bond market may increase interest in Gold as a stable asset. What are you thoughts? What are some other assets that are defying 'gravity'?

Just Let Me Cash Out Before the Weekend | SPX Analysis 11 April Let’s be honest…
This week has been ridiculous.
The market pumped harder than a spin class on espresso because of a rumour.
Then dumped.
Then teased a breakout.
Then decided against it mid-sentence.
It’s been a full-blown rollercoaster of overreactions, headline bait, and “wait, what did Trump say now?” moments.
But amidst the noise, the plan is still holding up.
5400?
Still resistance.
Still our pivot level.
Still doing its job.
---
👁️ Trader’s Eye View – Charting the Nonsense
Let’s recap what I’m seeing:
📉 Earlier this week, the 5400 bull trigger got pierced by an emotional market surge.
But there was no confirmation, no sustained breakout – and we’ve reversed since then.
Now?
We’re seeing the start of a rising channel – but every turn seems to align with a tweet, a walk-back, or a reaction to misread data.
It’s like price is drawing patterns using the tip of a headline.
That’s not conviction.
That’s chaos dressed as structure.
🧭 What I’m Doing Now
📌 Still bearish below 5400
📌 Watching for a move to 5000 or the rising channel low
📌 Will use Tag ‘n Turn, Pulse Bars, and GEX flips for entries
The ideal scenario?
Let my bear swing cash out before the close, pour something brown into a glass, and avoid blood pressure spikes over the weekend.
That’s the play.
---
🎯 Expert Insight – When the Chart's Not Lying, But the Headlines Are
Mistake:
Assuming a spike equals a breakout. Trading on headline strength instead of chart strength.
Fix:
Let the level prove itself.
5400 is my line in the sand – not because I said so, but because price keeps reacting to it.
That’s structure. That’s what we trade.
---
Fun Fact
In 2020, the average headline-related spike in SPX lasted under 37 minutes before mean-reverting.
This week?
We saw multiple trillion-dollar reactions last less than half an hour.
It’s not a breakout if it’s a sugar rush.

Warning: what can save us from a collapse: must read.⚠️This analysis isn’t purely chart-based, but in this macro environment, understanding the bigger picture is essential for predicting market movements. Hopefully, TradingView will allow this idea so that everyone can read it.
What Can Save Us?
Before looking for a solution, we must first acknowledge the problem—and then determine if and when a resolution is coming.
1. Trump’s Tariffs & Policies: A Market Shock
Trump’s economic strategy marks a radical departure from the policies of the past 30 years. However, previous administrations weakened U.S. global influence, shifting power in favor of China.
Since Trump's motto is "Make America Great Again", serious changes are inevitable. Until investors fully grasp these policies, uncertainty will persist.
Let’s break down the key areas of impact and Trump’s expected responses:
2.Monetary Policy & The Federal Reserve
The Federal Reserve (FED) and Jerome Powell are not aligned with the White House.
Powell is sticking to his monetary policy approach, but Trump needs 0% interest rates to implement his vision.
Markets hate uncertainty, and this is fueling volatility.
🔴 Trump's Response:
Expect a bombshell move—Trump will fire Jerome Powell and replace him with a Fed chairman who supports rate cuts to 0%. This will cause short-term chaos but ultimately fuel a massive market rally as:
✔️ The housing market recovers
✔️ Liquidity surges
✔️ Stocks skyrocket
3.U.S. Dependence on China & Russia for Raw Materials
The U.S. imports essential resources from China and Russia, making it vulnerable.
The BRICS alliance is strengthening, further threatening U.S. dominance.
🔴 Trump's Response:
Trump has openly expressed interest in acquiring Greenland, citing its rich natural resources. He will take it by military force if necessary, positioning the U.S. as a raw material powerhouse on par with Russia.
4.Lost Allies: Canada, Mexico & South America
Canada is aligning with Europe
Mexico & South America are leaning towards BRICS
🔴 Trump's Response:
To counter this:
Canada will be pressured into rejoining a U.S.-led trade bloc—or face potential annexation.
South American economies will be crippled by tariffs, forcing them to reintegrate under U.S. influence.
5.Geopolitical Conflicts: Middle East & Ukraine
Iran is aligned with Russia & China
Ukraine relies on Europe (France, UK, EU), rather than the U.S.
The U.S. is not benefiting from these wars
🔴 Trump's Response:
If Zelensky continues to align with Europe, Trump may order a full-scale U.S. bombing of Ukraine, flatten Kyiv, eliminate Zelensky live on TikTok, and then split Ukraine with Russia.
This move would:
✔️ Strengthen U.S.-Russia relations
✔️ Secure a deal on Greenland
✔️ Humble Europe
6.Conclusion: A Global Power Shift
Expect a period of chaos and fear. However, what investors must understand is that Trump is 100% serious about these moves—and he will execute them regardless of global opinion.
If Trump’s strategy works:
✅ The U.S. will regain dominance
✅ Markets will rally hard
✅ Confidence in the U.S. economy will be restored
If Trump fails:
🚨 A prolonged economic downturn (15-20 years of stagflation)
🚨 U.S. & Europe suffer major losses
🚨 Best move? Relocate to Asia or the Middle East before the crash.
So, even if Trump’s policies seem insane, the best-case scenario is that he succeeds.
💡 DYOR (Do Your Own Research)
#Bitcoin #Crypto #Trump #MAGA #Geopolitics #StockMarket #SPX500 #Trading #Investing #Economy #FederalReserve #RateCuts
