Weekly $SPY / $SPX Scenarios for April 21–25, 2025🔮 🔮
🌍 Market-Moving News 🌍:
🇺🇸 Tariff Fallout Deepens: Markets remain volatile as President Trump's recent tariff policies continue to unsettle investors. The S&P 500 is down 14% from its February peak, with recession fears escalating. Economists now estimate a 45% chance of a downturn within the next year, up from 25% previously.
🚗 Tesla's Anticipated Earnings: Tesla is set to report Q1 earnings on Tuesday. Options pricing suggests a potential 9.3% stock movement post-report. Investors are keenly awaiting updates on AI initiatives, including the robotaxi network and the Optimus humanoid robot.
🛢️ Oilfield Services Under Pressure: Halliburton, Baker Hughes, and SLB will release earnings this week amid declining oil prices and tariff-induced cost pressures. Analysts warn that sustained crude prices below $60 could lead to a 20% drop in domestic oilfield activity.
📊 Key Data Releases 📊
📅 Monday, April 21:
No major economic data releases scheduled.
📅 Tuesday, April 22:
🏠 Existing Home Sales (10:00 AM ET):
Forecast: 4.20 million
Previous: 4.38 million
Provides insight into the housing market's health and consumer demand.
📅 Wednesday, April 23:
📊 S&P Global Manufacturing & Services PMI (9:45 AM ET):
Forecast: Manufacturing 49.5; Services 51.0
Previous: Manufacturing 49.2; Services 50.8
Indicates the economic health of the manufacturing and services sectors.
📈 New Home Sales (10:00 AM ET):
Forecast: 675,000
Previous: 662,000
Measures the number of newly constructed homes sold, reflecting housing market trends.
📘 Federal Reserve Beige Book (2:00 PM ET):
Provides a summary of current economic conditions across the 12 Federal Reserve Districts.
📅 Thursday, April 24:
📉 Durable Goods Orders (8:30 AM ET):
Forecast: -0.5%
Previous: 1.3%
Reflects new orders placed with domestic manufacturers for delivery of factory hard goods.
📈 Initial Jobless Claims (8:30 AM ET):
Forecast: 230,000
Previous: 223,000
Indicates the number of individuals filing for unemployment benefits for the first time.
📅 Friday, April 25:
📊 University of Michigan Consumer Sentiment Index (10:00 AM ET):
Forecast: 76.5
Previous: 77.2
Assesses consumer confidence in economic activity.
⚠️ Disclaimer: This information is for educational and informational purposes only and should not be construed as financial advice. Always consult a licensed financial advisor before making investment decisions.
📌 #trading #stockmarket #economy #news #trendtao #charting #technicalanalysis
Spy!

Weekly Market Forecast: Stocks Markets Are Stalled! Patience!In this video, we will analyze the S&P 500, NASDAQ, and DOW JONES futures for the week of April 21 - 25th
The Markets are stalled! No bullish follow through from the previous week. Last week failed to break the previous weekly high. This stall out looks consolidative and unclear. Wait for clarity! Let the markets break the high or low of the range convincingly... and trade accordingly.
Enjoy!
May profits be upon you.
Leave any questions or comments in the comment section.
I appreciate any feedback from my viewers!
Like and/or subscribe if you want more accurate analysis.
Thank you so much!
Disclaimer:
I do not provide personal investment advice and I am not a qualified licensed investment advisor.
All information found here, including any ideas, opinions, views, predictions, forecasts, commentaries, suggestions, expressed or implied herein, are for informational, entertainment or educational purposes only and should not be construed as personal investment advice. While the information provided is believed to be accurate, it may include errors or inaccuracies.
I will not and cannot be held liable for any actions you take as a result of anything you read here.
Conduct your own due diligence, or consult a licensed financial advisor or broker before making any and all investment decisions. Any investments, trades, speculations, or decisions made on the basis of any information found on this channel, expressed or implied herein, are committed at your own risk, financial or otherwise.

MARKETS NOT OVERSOLD CAUTION!While only 36% of stocks are over the 20-day MA, they are nowhere near oversold conditions. As such, there is still room for the downside.
While this indicator is only suitable for short-term trading, tomorrow new making event could push markets way lower.
While I would not suggest trading news events. I know some do, as such bottom picking is not advisable.
CAUTION!

A Tolled BellThe first bell has rung. A bridge is being paved across the $6000 range.
IF it blows up, it likely won't happen until the bridge is constructed and sentiment improves. Expect a few heartfelt endeavors to shoot above $6,660. Base case is long term crab market.

SPY Trading Opportunity! BUY!
My dear subscribers,
My technical analysis for SPY is below:
The price is coiling around a solid key level - 526.40
Bias - Bullish
Technical Indicators: Pivot Points High anticipates a potential price reversal.
Super trend shows a clear buy, giving a perfect indicators' convergence.
Goal - 554.18
My Stop Loss - 512.11
About Used Indicators:
By the very nature of the supertrend indicator, it offers firm support and resistance levels for traders to enter and exit trades. Additionally, it also provides signals for setting stop losses
———————————
WISH YOU ALL LUCK

QQQ SHORT @ $448 TO $433Price also happens to be at the 60% fib level which is added confluence. Will most likely cut this trade around $435 just to secure profit and so I don't have to hold as long. If it decides to crash then of course ill hold. stop loss no higher than $450.7

Bottom this summer!AMEX:SPY has a constant repeating pattern when making new highs! Looking back at previous retracements you can see that they tend to have a common length and drawdown percentage.

April 17th Trade Journal & Stock Market AnalysisApril 17th Trade Journal & Stock Market Analysis
EOD accountability report: +816.25
Sleep: 6 hour, Overall health: Testing out new supplement, Sleep has been low, but energy level has been good. (testing out Ocimum tenuiflorum for sleep and adding Ginkgo Biloba W/LM)
**Daily Trade Recap based on VX Algo System**
9:29 AM Market Structure flipped bearish on VX Algo X3!
11:05 AM VXAlgo YM X1 Buy Signal
11:47 AM Market Structure flipped bullish on VX Algo X3!
3:30 PM Market Structure flipped bearish on VX Algo X3!
3:40 PM VXAlgo ES X1 Buy signal (double signal)
**Monday plan--> **watch for rejection of 48M Resistance for breakdown to 1D MOB

Are US Tariffs Similar To The COVID-19 Global DisruptionThis video is in response to a question asked by one of my followers on TradingView.
He specifically asked if the current US Tariffs create a similar situation to the COVID-19 supply disruptions and how it may result in longer-term market disruptions.
In this video, I try to answer these questions and highlight the differences I see related to what is happening now vs. the COVID-19 shutdown.
It is an interesting question.
I certainly see similarities, but I also see vast differences in terms of how the global markets are attempting to address the US tariff issues.
First, the current tariff issues are somewhat self-inflicted, not something like COVID-19 (unavoidable).
Second, the global central banks acted in concert to present immense liquidity to support a global shutdown with COVID. I don't see that happening right now.
Supply-side disruptions are evident, but we'll see how they play out over the next 60- 90+ days.
Longer-term, I hope these tariff issues are resolved before the global economy moves into a deeper recession. I will state that hard assets are likely to take a hit over the next 60-90+ days across the globe.
Any moderate (think 15 to 35%) slowdown in production, shipping, and consumption across the globe is going to be felt all over the planet. It is not going to be isolated to just one or two areas.
This is the smackdown that I don't believe anyone is really ready for. And that creates the urgency to resolve the tariff issues asap.
Hope this helps.
Get Some.
#trading #research #investing #tradingalgos #tradingsignals #cycles #fibonacci #elliotwave #modelingsystems #stocks #bitcoin #btcusd #cryptos #spy #gold #nq #investing #trading #spytrading #spymarket #tradingmarket #stockmarket #silver

SPY/QQQ Plan Your Trade Video For 4-17 : Another BLANK dayToday's BLANK pattern in counter-trend mode is nothing to worry about.
As I research and document these patterns, there are patterns that appear frequently on the Daily price chart and there are others that appear more infrequently.
If I have not already marked these patterns and documented them, they have not appeared anywhere in the 11+ years of the Daily price data I use within the Lookup Engine.
Therefore, these are VERY RARE types of patterns - Extremely infrequent.
I will add that the secondary looking criteria show yesterday and today could be similar to "key top/bottom" types of price rotation. So, I do believe the current price level on the SPY (520-535) could prove to be very critical support/resistance going forward.
Tomorrow is Good Friday (no trading). So if you are going to take any trades today, make sure you remember to plan your exits for TODAY or NEXT WEEK (or later). You will not be able to exit stock/ETF trades tomorrow (sorry).
Gold is moving into a Momentum Rally, and I really want to see how that pattern plays out before the long holiday weekend.
Fingers crossed we see a BIG RALLY again today.
BTCUSD is still rolling into a downward price trend based on my EPP pattern structure. This downward trend aligns with my May 2 Major Bottom pattern for the SPY/QQQ. So I would expect BTCUSD to start to roll downward sometime near the middle/end of next week.
Remember, this weekend should be about your family, your friends, and your beliefs.
Relax and enjoy.
Get some...
#trading #research #investing #tradingalgos #tradingsignals #cycles #fibonacci #elliotwave #modelingsystems #stocks #bitcoin #btcusd #cryptos #spy #gold #nq #investing #trading #spytrading #spymarket #tradingmarket #stockmarket #silver #xauusd

April 17, 2025 - Powell, Japan & TrumpHello everyone, it’s April 17, 2025. Yesterday’s U.S. trading was pure market carnage. Semiconductors ( NASDAQ:NVDA , NASDAQ:AMD , NASDAQ:ASML ) were steamrolled as AI chip bans to China kicked in and Trump dropped another tariff bomb, hiking duties to 245%. That wiped $200 billion off Nvidia alone.
In Chicago, Powell stoked the flames, warning tariffs will fuel inflation and choke growth, and insisted he’s in no rush to cut rates. The CME_MINI:NQ1! tumbled 3%, the CME_MINI:SOX1! lost 4.1%, and bond futures plunged.
This morning, U.S. futures are up about 0.75% on headlines that Trump’s talks with Japanese negotiators are “going very well,” sparking rallies across Asia: Nikkei +1%, Hong Kong +2.7%, Shanghai +1%. It seems even a whiff of détente with Japan sends everyone scrambling back into risk assets.
On commodities, BLACKBULL:WTI jumps to $63.35 amid fresh U.S. sanctions on Iran and OPEC output cuts; OANDA:XAUUSD rockets to $3,352 /oz; INDEX:BTCUSD hovers near $83,500.
Today watch the ECB’s rate cut, Powell’s next speech, Philly Fed and jobless claims before the Good Friday shutdown. With Trump’s erratic tariff theatrics and Powell’s warning of higher inflation and slower growth, volatility is set to reign supreme. Buckle up.

Bulls and Bears Oh myhmmm up to test resistance. Possibly fill the 550ish gap if it goes a little wild... head and shoulders also on the table

Nightly $SPY / $SPX Scenarios for April 17, 2025🔮 🔮
🌍 Market-Moving News 🌍:
🇪🇺 ECB Expected to Cut Rates Amid Trade Pressures: The European Central Bank is anticipated to reduce its deposit rate by 25 basis points to 2.25% during its meeting on April 17. This expected move aims to counteract the economic impact of recent U.S. tariffs and a strengthening euro, which have contributed to disinflationary pressures in the eurozone.
📉 German Inflation Decline Supports Easing: Germany's inflation rate fell more than expected in March, dropping to 2.3% from 2.6% in February. This decline, driven by falling oil prices and a sluggish economy, bolsters the case for further interest rate cuts by the ECB.
🤖 AI Enhances ECB Policy Predictions: A study by the German Institute for Economic Research indicates that artificial intelligence significantly improves the accuracy of forecasting ECB monetary policy decisions. By analyzing ECB communications, AI models can better anticipate policy shifts.
📊 Key Data Releases 📊
📅 Thursday, April 17:
🏠 Housing Starts (8:30 AM ET):
Forecast: 1.420 million
Previous: 1.501 million
Indicates the number of new residential construction projects begun, reflecting housing market strength.
🏭 Philadelphia Fed Manufacturing Survey (8:30 AM ET):
Forecast: 3.7
Previous: 12.5
Measures manufacturing activity in the Philadelphia region, providing insights into sector health.
📈 Initial Jobless Claims (8:30 AM ET):
Forecast: 223,000
Previous: 223,000
Reports the number of individuals filing for unemployment benefits for the first time, reflecting labor market conditions.
⚠️ Disclaimer: This information is for educational and informational purposes only and should not be construed as financial advice. Always consult a licensed financial advisor before making investment decisions.
📌 #trading #stockmarket #economy #news #trendtao #charting #technicalanalysis

SPY CRACK! WARNING!We are in the "honey" phase in Stocks.
This is the part where they tell you:
-Don't panic
-Stocks are cheap forward EPS
-Nible on the way down
-Diversified portfolio wins..
-It's a stock picker's market
-There is a lot of cash on the sidelines
-It's just a reset
-It's a correction
-We needed this to shake out the weak hands
-Buy when there is blood in the streets, even if it's yours
-There is a lot of value in...
-This is your last chance to...
-This and that stock are going to $1,000
-Stocks are the best investment over the course of time
The list is endless to get you to buy or stay in and suck up the pain. They will "Future Fuke" you the world.
I will remind you that you cannot buy unless you first sell! No one has endless money, and your 1% addition monthly will not lower your cost basis.
All I can tell you is what this chart shows! A BIG CRACK!
WARNING!!!
Click like, follow, subscribe, and let me help you navigate these crazy markets.

S&P 500 - Key Levels and April 7-11 Weekly Candle StructureApril 7-11 will easily be remembered in 2025 as one of the craziest weeks in modern history.
Intraday swings were face ripping all from a Monday "fake news" becoming Wednesday "real news" with the US pausing tariffs for 90 days
5500 major resistance on S&P
4800 major support on S&P
I believe the market will struggle to provide any clear direction in the coming weeks without some shift in narrative (for better or worse). I'm sure most traders are hoping for an optimistic tone but be prepared to be disappointed as the world's alliances and economies are being strained with massive uncertainty and angst.
There are trading opportunities in the short-term, but I'm not taking any major risks. If I can survive, the upside will be easier and a pleasant surprise.
I expect the weekly candles to dance inside the April 7-11 low and high levels and hopefully it provides some ventilation to a VIX > 30

Non-US ETFs outperform during trade warNon-US markets are showing resilience during this year's remarkable volatility.
While NASDAQ:QQQ and AMEX:SPY are down more than 10%, AMEX:VEA (non-U.S. Developed Markets ETF) is up nearly 5%...
AMEX:IEMG (tracking Emerging Markets) is negative so far, but less severe than others. Will Trump's volatile trade war lead to further outflow from the U.S. financial system?
Meanwhile, gold has been rallying to record highs as the world seeks an alternative to the dollar.

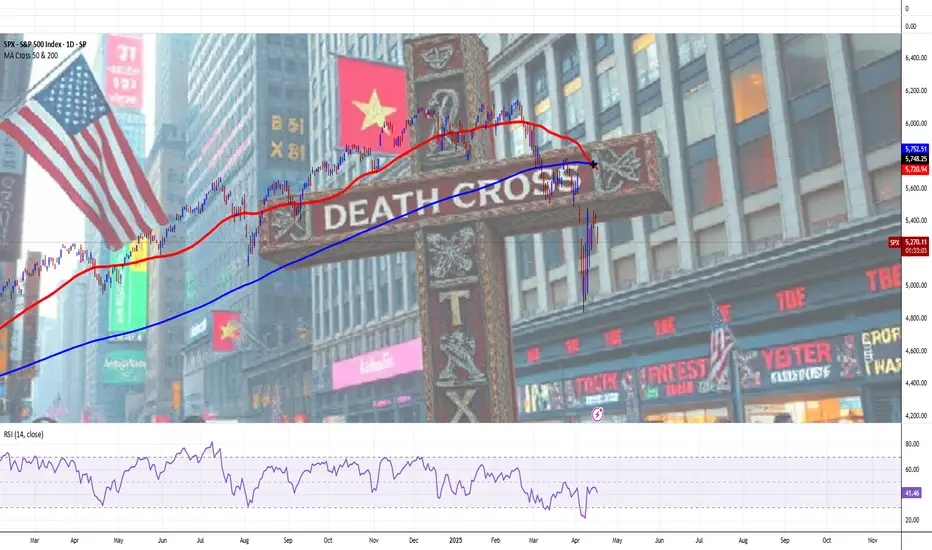
S&P 500 Index Goes 'Death Crossed' Again, Due To Unruly EconomyThe "Death Cross" is a technical chart pattern signaling potential bearish momentum in the US stock market, occurring when a short-term moving average (typically the 50-day) crosses below a long-term moving average (usually the 200-day).
Despite its foreboding name, historical data shows its implications are often less dire than perceived, serving as a coincident indicator of market weakness rather than a definitive predictor of collapse.
Historical Examples and Market Impact
The death cross gained notoriety for preceding major market downturns:
2000 Dot-Com Bubble: The Nasdaq Composite’s death cross in June 2000 coincided with the burst of the tech bubble, leading to a prolonged bear market.
2008 Financial Crisis: The S&P 500’s death cross in December 2007 foreshadowed the 2008 crash, with the index losing over 50% of its value by early 2009.
2020 COVID-19 Crash: The S&P 500, Dow Jones, and Nasdaq 100 all formed death crosses in March 2020 amid pandemic-driven panic, though markets rebounded sharply within months.
2022 Ukraine's War Crisis: The S&P 500, Dow Jones, and Nasdaq 100 all formed death crosses in March 2022 due to proinflationary surge on Ukraine's war and Arab-Israel conflict, leading to a prolonged bear market within next twelve months, up to March quarter in the year 2023.
These examples highlight the pattern’s association with extreme volatility, but its predictive power is inconsistent. For instance, the 2022 death cross in the S&P 500—its first in two years—occurred amid Fed rate hikes and geopolitical tensions, yet the market stabilized within weeks rather than entering a prolonged downturn.
Perspectives on Reliability and Use Cases
While the death cross reflects deteriorating short-term momentum, its utility depends on context:
Lagging Nature: As a lagging indicator, it confirms existing trends rather than forecasting new ones. The 50-day average crossing below the 200-day often occurs after prices have already declined.
False Signals: Post-2020 data shows the S&P 500 gained an average of 6.3% one year after a death cross, with Nasdaq Composite returns doubling typical averages six months post-cross.
Combined Analysis: Traders pair it with metrics like trading volume or MACD (Moving Average Convergence Divergence) to validate signals. Higher selling volume during a death cross strengthens its bearish case.
Strategic Implications for Investors
For market participants, the death cross serves as a cautionary tool rather than a standalone sell signal:
Short-Term Traders: May use it to hedge long positions or initiate short bets, particularly if corroborated by weakening fundamentals.
Long-Term Investors: Often treat it as a reminder to reassess portfolio diversification, especially during elevated valuations or macroeconomic uncertainty.
Contrarian Opportunities: Historical rebounds post-death cross—such as the 7.2% Nasdaq gain three months after the signal—suggest potential buying opportunities for risk-tolerant investors.
Fundamental Challenge
Stocks Extend Drop as Powell Sees Economy ‘Moving Away’ From Fed Goals
Powell sees economy ‘moving away’ from job, price goals due to Trump's tariff chainsaw.
Fed well positioned to wait for policy clarity. Strong jobs market depends on price stability, he adds.
Stocks extend declines, bonds rally as Fed chair speaks.
Conclusion
The "Death Cross" remains a contentious yet widely monitored pattern. Its dramatic name and association with past crises amplify its psychological impact, but empirical evidence underscores its role as one of many tools in technical analysis. Investors who contextualize it with broader market data—such as earnings trends, interest rates, and macroeconomic indicators—are better positioned to navigate its signals.
While it may foreshadow turbulence, its historical track record emphasizes resilience, with markets often recovering losses within months of the pattern’s appearance.
--
Best wishes,
Your Beloved @PandorraResearch Team 😎
// Think Big. Risk Less
BEAR TRAP in SPY?🐻 BEAR TRAP in SPY?
After a sharp correction, SPY is showing a possible Bear Trap formation — right at the zone where the market often catches short sellers off guard.
📊 The pattern resembles the "First Sentiment Extreme" > Shakeout > Bear Trap phase from the classic market psychology cycle (see inset chart).
🔍 Supporting signs:
RSI bouncing off oversold territory (currently at 49.32)
MACD showing a bullish crossover forming
A strong bounce after a panic flush
If this is indeed a bear trap... 📈 we could be at the early stage of renewed optimism. The next few candles are crucial — confirmation could ignite a sharp reversal.
🧠 Don’t chase. Wait for confirmation. But stay alert.

SPY - support & resistant areas for today April 16 2025These are Support and Resistance lines for today April 16 2025 and will not be valid for next day. Mark these in your chart by clicking grab this below.
Yellow Lines: Heavily S/R areas, price action will start when closing in on these.
White Lines: Are SL, TP or Mid Level Support and Resistance Areas, these are traded if consolidation take place on them.

Bulls and Bears zone for 04-16-2025Earlier this week S&P 500 has formed a Death Cross which could be significant or not only time will tell.
Any test of yesterday's Close could provide direction for the day.
Level to watch: 5354 --- 5356
Reports to watch:
U.S. Housing Market Index at 10:00AM EST
U.S. Jerome Powell Speaks at 1:30PM EST

SPY/QQQ Plan Your Trade For 4-15 : BLANK pattern day.As I stated in this video, last night I looked through the data and could not find any reference for this pattern going back more than 11 years. Same thing for tomorrow's pattern.
That means these are very RARE pattern setups and we'll have to watch to see how price action plays out today.
If there were no reference points over 11+ years of Daily price data (more than 2500 Daily Price Bars), then this is something very unique.
I believe today will act like a Reversal Bar. Potentially rallying off a lower opening price and setting up a type of Gap Lower Rally type of pattern - but that is just a guess.
At this point, trade smaller quantities until we see how price reacts this morning.
Gold and Silver make a BIG MOVE overnight - breaking above the $3300/$33 levels I suggested were critical psychological levels.
This is an INCREDIBLE rally in metals (thanks, China).
At this point, if you were long metals like I was, you can thank me all you want.
Be aware that metals will likely pause a bit above this psychological level, then start to move higher again.
The next big target is $3600-$3750 for Gold.
Bitcoin is doing exactly what I stated it would do - rolling into a top as demand for BTCUSD wanes. I believe the next low for BTCUSD will be closer to $60k-$63k. Pay attention.
Going to be a good day for everyone holding Gold/Silver/Miners CALLS (like I kept suggesting).
GOT SOME.
#trading #research #investing #tradingalgos #tradingsignals #cycles #fibonacci #elliotwave #modelingsystems #stocks #bitcoin #btcusd #cryptos #spy #gold #nq #investing #trading #spytrading #spymarket #tradingmarket #stockmarket #silver

A Wolfe Wave? Maybe. Another Win? Definitely. | SPX Analysis 16 What do you call it when you wake up, sip your tea, and realise the market is exactly where you thought it would be?
Answer: another day following the damn plan.
Yesterday’s price action? Snooze city. But tucked away inside that inside day was a lovely little income win, all thanks to those glorious GEX levels we’ve had our eyes glued to for weeks. 5400/5425 was once again the no-go zone. SPX tiptoed up, chickened out, and reversed politely on cue.
While retail traders yawned or second-guessed, we quietly hit our numbers. Again.
And while the surface was calm, beneath the charts... something’s stirring.
---
🎯 "Same Setup. Same Result."
Some traders chase action. We wait for systematic decision-making framework.
While the masses complained about a boring market day, we snagged another payday. The setup was textbook: resistance at 5400/5425, backed by GEX, ADD extremes, and the ol’ "...oh and..." wedge-in-the-making.
Throw in a mechanical bear Tag 'n Turn and we were go for launch.
The overnight futures have started to crack the two-day range. One of the perks of short-dated expirations? You don't need massive moves - just a push in your direction, and the premium does the work for you.
And here's a wildcard for your "...oh and..." notebook:
👀 Possible Wolfe Wave forming. If valid, we could be looking at a gravity slide down to 5000.
Is it the holy grail? Nah. But if it lines up with pulse bars and structure, I’ll be ready.
---
GEX Analysis Update
5425 again
🎓 Expert Insight – "Pattern First, Prediction Later"
Common Trading Mistake: Jumping on a trade just because the news made your pulse spike.
Fix It: Let your levels do the talking. GEX, ADD, Tag 'n Turns… the market leaves breadcrumbs. Follow those, not the headlines.
Don’t predict. React with structure.
Trade setups, not emotions.
Repeat winners are born from repeatable processes.
---
🤓 Fun Market Fact
The Wolfe Wave pattern is named after Bill Wolfe and is often misunderstood as some esoteric mystery. But really? It’s just a glorified channel break with attitude.
It projects a reversal target based on converging trendlines, often in five-wave structures. The magic? The final wave usually slams to a specific line, called the EPA/ETA - and can happen quickly if volatility kicks in.
Most people don’t spot it until it’s too late. But if you know what to look for, it becomes a spicy tool in the AntiVestor arsenal. 🐺📉
Happy trading,
Phil
Less Brain, More Gain
…and may your trades be smoother than a cashmere codpiece

SPY Weekly Options Trade Plan 2025-04-15AMEX:SPY SPY Weekly Analysis Summary (2025-04-15)
Below is an integrated view of the models’ findings:
─────────────────────────────
SUMMARY OF MODEL KEY POINTS
• Grok/xAI noted that on very short timeframes the price is a bit below key 5‑minute EMAs and near lower Bollinger Bands—with RSI and MACD giving mixed signals—but on the daily chart some bullish features (price above the 10‑EMA, a slight MACD bullish grace, and a max pain level at $549) hint at a potential mean reversion. Their “if forced” ramp suggested a call at the $549 strike, though overall confidence was low (≈55%).
• Gemini/Google’s report highlighted conflicting technical readings – the M5 setup looked bearish while the daily chart showed a little bullishness. Their integration of high but falling VIX and options open‑interest levels led to an overall neutral/unclear reading. Their recommendation was to refrain from entering a directional trade at open.
• Llama/Meta leaned toward a moderately bearish reading based on the short‐term indicators (price below key EMAs, bearish MACD on both charts) despite some daily support. They specifically recommended buying the $537 put option (even though the premium is higher than the “ideal” $0.30–$0.60 range) with a target profit roughly 50% above the cost and a stop when SPY breaches an upper resistance level—backed by a 70% confidence level.
• DeepSeek also synthesized mixed timeframes – pointing out that while the market holds some daily support, the intraday picture is muddled by technical conflict, expensive premium costs for the moves required, and time decay factors. Their view was to wait rather than initiate a new position.
─────────────────────────────
2. AREAS OF AGREEMENT AND DISAGREEMENT
• Agreement: All reports recognize that SPY (about $537.61) is trading near key short‑term support levels with significant options OI clustering. The falling VIX is universally noted as a positive sign for reducing fear even though overall volatility remains high.
• Disagreement:
– Grok’s report and to some extent the daily charts hint at a slight bias to the upside (supported by max pain at $549), suggesting a potential call wing trade.
– In contrast, Llama/Meta’s analysis and the very short‐term indicators (M5, lower Bollinger band, bearish MACD) point toward a bearish bias, recommending a put trade.
– Both Gemini/Google and DeepSeek, however, find the technical signals too mixed to have high confidence in initiating any naked single‑leg weekly option trade at open.
─────────────────────────────
3. CLEAR CONCLUSION
• Overall Market Direction Consensus:
The models collectively paint a picture of uncertainty. There is no clear, high‑conviction directional bias at the open. The short‑term (intraday) technicals lean bearish or at best neutral, while the daily chart and max pain argument hint at a potential slight mean reversion. Given these conflicting signals, the overall market direction remains neutral/unclear.
• Recommended Trade:
Based on the clash in opinions—only one model (Llama/Meta) would go short (with puts) while two models (Grok/xAI and Llama/Meta) suggest if forced a trade—and given that the majority (Gemini/Google and DeepSeek) advise against trading in the current conditions, the consensus is not to enter a new weekly options position at the market open.
– Strategy: Single‐leg, naked options (calls or puts)
– Expiration: Weekly options only (expiry April 17, 2025)
– Premium: Trading ideal premium range is $0.30–$0.60, but neither candidate in the call nor put space meets all our criteria with high conviction
– Entry Timing: At open would be the plan if a trade were to be placed
– Confidence: Overall confidence in any trade is low (<60%)
• Key Risks and Considerations:
– The short‑term technical indicators (lower EMAs, bearish M5 MACD, tight Bollinger bands) could trigger a whipsaw if SPY moves sideways or reverses abruptly.
– The high but falling VIX signals that although volatility is subsiding, levels remain elevated.
– Time decay (theta) on weekly options is significant at the open, and the probability of a strong directional move is diminished without further confirmation during the session.
– Conflicting signals between daily trend (some bullish pointers) and intraday behavior reduce the reliability of a directional play.
─────────────────────────────
4. FINAL RECOMMENDATION
Given the model consensus with mixed and conflicting signals, the recommendation is to NOT trade weekly SPY options at market open today.
─────────────────────────────
TRADE_DETAILS (JSON Format)
{
"instrument": null,
"direction": null,
"strike": null,
"expiry": null,
"confidence": null,
"profit_target": null,
"stop_loss": null,
"size": null,
"entry_price": null,
"entry_timing": null
}
Disclaimer: This newsletter is not trading or investment advice but for general informational purposes only. This newsletter represents my personal opinions based on proprietary research which I am sharing publicly as my personal blog. Futures, stocks, and options trading of any kind involves a lot of risk. No guarantee of any profit whatsoever is made. In fact, you may lose everything you have. So be very careful. I guarantee no profit whatsoever, You assume the entire cost and risk of any trading or investing activities you choose to undertake. You are solely responsible for making your own investment decisions. Owners/authors of this newsletter, its representatives, its principals, its moderators, and its members, are NOT registered as securities broker-dealers or investment advisors either with the U.S. Securities and Exchange Commission, CFTC, or with any other securities/regulatory authority. Consult with a registered investment advisor, broker-dealer, and/or financial advisor. By reading and using this newsletter or any of my publications, you are agreeing to these terms. Any screenshots used here are courtesy of TradingView. I am just an end user with no affiliations with them. Information and quotes shared in this blog can be 100% wrong. Markets are risky and can go to 0 at any time. Furthermore, you will not share or copy any content in this blog as it is the authors' IP. By reading this blog, you accept these terms of conditions and acknowledge I am sharing this blog as my personal trading journal, nothing more.
