US Cash Market Goes 'Flippant'. Understanding Revenge in TradingFirst of all, revenge trading is a destructive pattern of behavior in trading where individuals make impulsive and emotionally-driven decisions in an attempt to recoup previous losses. This practice is not limited to novice traders; even experienced traders can fall prey to it. The primary emotions driving revenge trading include anger, frustration, greed, fear, and shame, which cloud judgment and lead to irrational decision-making.
Causes of Revenge Trading
Emotional Response: Traders often react emotionally to significant losses, feeling compelled to immediately recover their losses without adequate analysis or strategy.
Lack of Discipline: Deviating from established trading plans and risk management principles is common in revenge trading.
Psychological Triggers: Feelings of injustice, anger, or a desire for vengeance against the market can trigger revenge trading.
Consequences of Revenge Trading
Financial Losses: Revenge trading often results in larger losses due to riskier trades and poor timing.
Emotional Burnout: The stress and frustration from repeated losses can lead to emotional exhaustion and decreased trading performance.
Career Impact: Persistent revenge trading can erode confidence and lead to a trader questioning their abilities.
Real-Life Examples of Revenge Trading
Increasing Position Size: A trader experiences a significant loss and decides to double or triple their position size in the next trade, hoping to quickly recover their losses. This action disregards risk management principles and often leads to even greater losses.
Ignoring Stop-Loss Orders: After a loss, a trader might hold onto a losing position longer than planned, hoping it will turn around. This behavior ignores established stop-loss orders and can result in further financial damage.
Chasing Trades: A trader feels compelled to enter trades without proper analysis, driven by the urge to recoup losses quickly. This impulsive behavior can lead to a series of poor trading decisions.
Market Reversal Scenario: A trader suffers a loss due to a sudden market reversal. In an attempt to recover, they enter a trade in the opposite direction without thorough analysis, which can exacerbate their losses.
Wish more examples? Watch recent one below 👇👇
How to Avoid Revenge Trading
To avoid revenge trading, traders should focus on maintaining discipline and adhering to their trading strategies. This includes:
Taking Breaks: After a loss, taking time to reassess the market and calm emotions can help prevent impulsive decisions.
Sticking to Plans: Adhering to established trading plans and risk management principles is crucial.
Emotional Awareness: Recognizing emotional triggers and taking steps to manage them can help prevent revenge trading.
In conclusion, revenge trading is a HARMFUL AND DANGEROUS practice that can lead to significant financial and emotional consequences. Understanding its causes and recognizing its signs are essential steps in avoiding this behavior and maintaining a successful trading career.
--
Best wishes,
@PandorraResearch Team 😎
Spy!

SPY 03/26Looks like it's about to roll down. First target would be monthly VWAP. Not financial advice. Could also range a little bit longer.
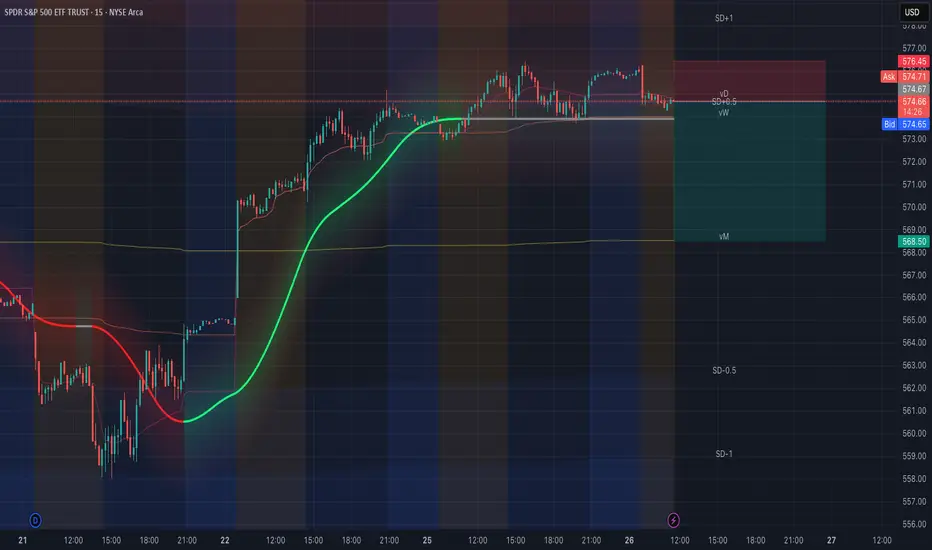
SPY WILL FALL|SHORT|
✅SPY has hit a key structure level of 577.50$
Which implies a high likelihood of a move down
As some market participants will be taking profit from their long positions
While others will find this price level to be good for selling
So as usual we will have a chance to ride the wave of a bearish correction
SHORT🔥
✅Like and subscribe to never miss a new idea!✅
Disclosure: I am part of Trade Nation's Influencer program and receive a monthly fee for using their TradingView charts in my analysis.

Bulls and Bears zone for 03-26-2025Futures are trading a little bit lower during ETH session, since there is a lot of uncertainty in the market.
Level to watch: 5829 --- 5827

SPY/QQQ Plan Your Trade for 3-26-25 : Flat-Down PatternToday's Flat-Down pattern for the SPY/QQQ suggests the markets will consolidate in a sideways channel, generally drifting downward.
As I've been warning all of you for the past month+, the market will likely roll over into a topping formation over the next few days, then start an aggressive downward trend targeting $525-535 on the SPY.
Today's video covers some details related to my expectations and how traders can prepare for the bigger moves I see pending.
Gold and Silver are poised for a potentially BIG BREAKOUT move to the upside. And I still believe Gold/Silver are going to rally another 15-20% within the next 30-45 days.
Bitcoin should follow the SPY/QQQ into a "rollover top" type of pattern then shift into a downward price trend over the next few days.
Everything is following my predictions/expectations almost perfectly.
Now, we try to profit from some of these big moves.
Go get some.
#trading #research #investing #tradingalgos #tradingsignals #cycles #fibonacci #elliotwave #modelingsystems #stocks #bitcoin #btcusd #cryptos #spy #gold #nq #investing #trading #spytrading #spymarket #tradingmarket #stockmarket #silver

SPX Stalls at Resistance - Here's What I’m Watching SPX Stalls at Resistance - Here's What I’m Watching | SPX Analysis 26 Mar 2025
You know that scene in every action movie where someone’s finger hovers over the big red button… and they don’t press it?
That’s me right now.
Because once again, sitting back and waiting for a cleaner entry zone is paying off. SPX tagged the upper Bollinger Band – like a polite tap on the shoulder – but hasn’t turned with any conviction.
No pulse bars. No reversal. Just a stall.
And that, my friend, is where we earn our edge – not by reacting early, but by knowing when not to act at all.
---
Deeper Dive Analysis:
Markets don’t always reward the busy. Sometimes, the biggest wins come from doing… nothing.
And today is one of those days.
📍 SPX tagged the upper Bollinger Band
⏸️ But instead of turning sharply, price paused
🚫 No bearish pulse bars yet – which means no confirmed reversal
We’re in “hover mode”.
Which, translated to trader speak, means:
"Don’t be clever. Just wait."
🎯 I’m staying bullish above 5700
🧭 But I’m not placing blind trades just to feel productive.
If price breaks and holds above 5700, I’ll consider scaling in for a bullish continuation.
If we slip back below 5700, I’ll reassess for bearish setups and pulse bar confirmation. But until then? My finger’s off the button.
Why? Because I know this pattern.
The tag-with-no-turn often just means we’re not done yet. The trend might still have gas in the tank, or it’s winding up for a more dramatic move later.
Either way, I’m not front-running it.
And honestly? Watching others flinch and overtrade while I sip tea and wait is one of life’s great pleasures. 😎
---
Fun Fact
📢 In 2006, someone accidentally sold 610,000 shares of a stock instead of 1.
💡 This infamous “fat-finger trade” cost Mizuho Securities $225 million in one afternoon — and became one of the most expensive typos in trading history.
Moral of the story?
In trading – as in typing – sometimes doing nothing is smarter than doing something fast.
$SPY Bounce to 590s?Hey everyone, it's your boy pic. AMEX:SPY looks primed for a typical ABC correction to around 590 going into the second half of March. Chart lines up with NextPivot Indicator and FIB levels just as pretty as you please. Nice look with clear stops. Good luck!

Nightly $SPY / $SPX Scenarios for March 26, 2025🔮 🔮
🌍 Market-Moving News 🌍:
🇺🇸📉 Consumer Confidence Hits Four-Year Low: The Conference Board reported that the Consumer Confidence Index fell to 92.9 in March, marking the fourth consecutive monthly decline and reaching its lowest level since January 2021. Rising concerns over tariffs and inflation are major contributors to this decline.
🇺🇸🏠 New Home Sales Rebound: New home sales increased by 1.8% in February to a seasonally adjusted annual rate of 676,000 units, slightly below the forecasted 679,000. The median sales price decreased by 1.5% to $414,500 from a year earlier, indicating potential affordability improvements in the housing market.
📊 Key Data Releases 📊
📅 Wednesday, March 26:
🛠️ Durable Goods Orders (8:30 AM ET):
Forecast: -1.0%
Previous: 3.2%
Reflects new orders placed with domestic manufacturers for long-lasting goods, indicating manufacturing activity.
⚠️ Disclaimer: This information is for educational and informational purposes only and should not be construed as financial advice. Always consult a licensed financial advisor before making investment decisions.
📌 #trading #stockmarket #economy #news #trendtao #charting #technicalanalysis
SPY Technical Outlook - Will Buyers Step In?AMEX:SPY is experiencing a corrective move after rejecting the upper boundary of the ascending channel. This rejection led to increased selling pressure, bringing price back to the lower boundary of the channel, where buyers may step in to defend the trendline support.
If the price holds at this dynamic support level, a bullish reaction could send AMEX:SPY toward the midline of the channel, with the next target around 607.00. Holding above this level would reinforce the bullish trend structure and increase the probability of continuation toward the upper boundary of the channel.
However, a breakdown below the trendline support would weaken the bullish outlook and open the door for further downside. Monitoring price action, volume, and confirmation signals will be crucial in determining the next move.

Daily Trade Recap based on VX Algo SystemEOD accountability report: +$760
Sleep: Bad Overall health: drained
Daily Trade Recap based on VX Algo System
9:50 AM VXAlgo ES 48M Sell Signal ( didn't work that well)
10:10 AM VXAlgo ES 10M Buy signal (Double Signal) :check:
12:47 PM VXAlgo ES 10M Buy signal (Double Signal) :check:
3:30PM doji trade + expecting 48m to flip up
Market stalled a it today as expected because we ran up a lot yesterday,
We did go a bit higher but not much up from yesterday's high.
Overall decent range day if you trade the 1 min MOB.

$DXY 10% Declines along with $SPX declines from 1987-1995In case you are wondering if the drop in the $USDOL TVC:DXY US Dollar of 10% from a high is a sign of something major going on in the stock market, it reminded me of research I did right when I got out of college in 1987.
Here's a quick overview of that pattern of TVC:DXY declines of 10% against the backdrop of SP:SPX or S&P500 Index declines at that time. The 1987 stock market crash is on the far left of this graph and gets the chart started for you to review.
The 10% drops from highs in the TVC:DXY index are labeled with yellow arrows and there were 9 of them across this time series from 1987-1995.
We can imagine how a Non-US investor would handle both a drop in the TVC:DXY and a drop in the SP:SPX , but a drop of both the TVC:DXY and SP:SPX of 10% together would mean a loss of 20% for the non-US investor. That is a painful loss and perhaps more than investors wanted to risk.
Historically, it was a good time to look for a stock market bottom AFTER a drop in the TVC:DXY index and the green boxes at the top show the risk of a deeper decline in the SP:SPX was minimal after this scenario.
So the end result of this analysis is that the Dollar can be viewed as a contrarian indicator after a meaningful decline, as in 10% in this time frame. Look for other signs of a market bottom, especially using my TVC:VIX signals (5 point spike indicator and VIX75% retracement) to help define a bottom. The VIX75 signal triggered on Monday, March 24th, indicating that the panic from the selloff had moderated to a point enough to signal that the panic was over.
Do some more research for yourself and see if the TVC:DXY drop was an "asset allocation" shift as US investors bailed out of US stocks to invest in non-US stocks or was it another wave of non-US investors dumping US stocks to cut risk.
Either way, know what you are investing in and question everything. These days, it is more important to be educated and use TradingView to chart and research the past will help you be a more educated investor.
Cheers,
Tim

SPY Free Signal! Sell!
Hello,Traders!
SPY made a nice bullish
Move and will soon hit a
Horizontal support of 577.19$
From where we can enter
A short trade with the
Take Profit of 566.48$
And the Stop Loss of 583.38$
Sell!
Comment and subscribe to help us grow!
Check out other forecasts below too!
Disclosure: I am part of Trade Nation's Influencer program and receive a monthly fee for using their TradingView charts in my analysis.

BEARISH ALT WAVE PEAKING NOWThe chart posted is the Bearish alt we should Not rally anymore is I am correct and if there is a bearish alt. I am looking for a 3 wave drop in the form of an abc decline we should decline to a window of .786 in total of the rally from 5504 or Make a small new low to 5489. Then we should rally very sharp in a 5 wave rally to 50 % or .618 of the The drop from 6147 This is the ONLY BEARISH WAVE COUNT Best of trades WAVETIMER

SPY/QQQ Plan Your Trade For 3-25-25 : Top PatternToday's Top Pattern suggests the SPY/QQQ will find resistance slightly above yesterday's closing price level and attempt to roll over into a bearish price trend.
Watch today's video to see which levels I believe will be the top for the SPY & QQQ.
I do expect metals to rally over the next 3+ weeks and I'm watching for this morning's bounce to carry onward and upward.
Bitcoin should be rolling downward off that FWB:88K top level I predicted months ago.
We are moving into a topping phase - so get ready for the markets to attempt to ROLL DOWNWARD over the next 5+ trading days into a deeper low price level.
Get some.
#trading #research #investing #tradingalgos #tradingsignals #cycles #fibonacci #elliotwave #modelingsystems #stocks #bitcoin #btcusd #cryptos #spy #gold #nq #investing #trading #spytrading #spymarket #tradingmarket #stockmarket #silver

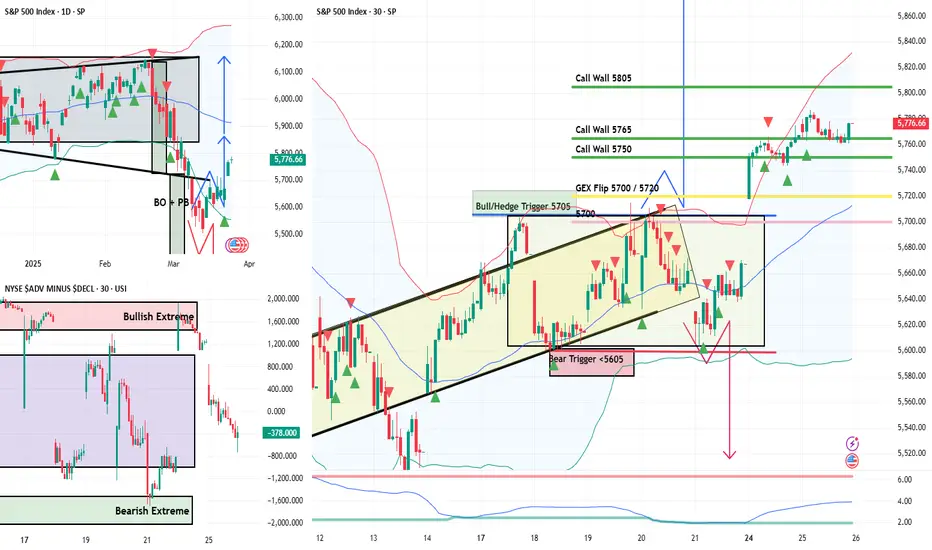
Bear Slippers Off. Bull Boots Laced.Bear Slippers Off. Bull Boots Laced. | SPX Analysis 25 Mar 2025
The tide turned Monday, and for once, the charts didn’t just mutter vaguely in Morse code – they actually gave us something to work with.
After weeks of grindy, gummy-bear movement, SPX finally flashed a bullish signal. The classic breakout-pullback has shown itself on the 30-minute timeframe, and the daily chart has joined the party with a sharp reversal, flipping us right back into the prior range.
Let’s just say this… not rolling those final bear swings? Smartest decision I didn’t overthink. I just wanted to stop the bleeding. Turns out, it also kept me out of harm’s way.
Now, with the bear slippers safely tucked back into the winter cupboard, I’m eyeing the bull setups. But as always – I’m not jumping just yet…
---
Deeper Dive Analysis:
Monday brought a much-needed shakeup – not the kind that rattles your coffee mug off the desk, but the kind that whispers: “Something’s changed…”
And it has.
The 30-minute chart formed a clean breakout-pullback, the kind you could frame on the wall and call “textbook.”
The daily chart? We’ve got a bullish reversal pattern that’s pushing price back into the old range.
That means my bearish bias has officially flipped.
Goodbye bear slippers. Hello, Bull Boots.
Let’s talk about those bears for a moment…
Last week’s trades didn’t go to plan. Friday’s rally chewed them up, and instead of rolling endlessly like a gambler doubling down, I did what needed to be done: closed them. Cleared the head. Took the "L".
And now, I’m glad I did.
Sometimes, the best trade is no trade. Or at least, no new pain.
During my Fast Forward mentorship call, we did our usual morning deep dive.
We looked at:
The GEX flip (Gamma Exposure momentum line)
Intraday call wall pressure
And the speculative cap at 5765 for the high of day
With that info, I made the call to delay my bull swing entry. Why chase a top when the market’s whispering “pullback pending”? I’d rather find a smarter entry… with more meat on the bone.
So what now?
Bias is bullish
5765 & 5805 = overhead friction
Waiting for a deeper pullback before entering long - Ideally 5720
My trigger’s locked. My chart’s marked. Now I wait.
And if that pullback doesn’t come?
Fine. I’ll let it go and re-evaluate. No FOMO. No flinching.
The plan is simple: Trade with the setup, not the hype.
--
Fun Fact
Benjamin Graham once said, “In the short run, the market is a voting machine. In the long run, it is a weighing machine.”
But he never accounted for meme stocks, social media panic, and Reddit-fuelled rocket ships.
Today, it often feels like the market's a slot machine with a Twitter feed.
Still – patterns like breakout-pullbacks?
They’re timeless, regardless of the noise.

Price climbing with Volume warningsPrice climbed after the bullish headsup we had on Friday
Strong bullish signs:
Strong close with little selling at the top
Closing above LT MA's and daily previous high
Bearish: Volume is not picking up - hint that this is an up reaction but the trend is still down, be careful with longs at this point
Daily Trade Recap based on VX Algo SystemEOD accountability report: +$650
Sleep: 🆗 Overall health: feeling drained today.
Health wise, Feeling really tired today, might need to really add red light therapy to my morning process.
Daily Trade Recap based on VX Algo System
11:39 AM VXAlgo NQ 48M Sell Signal (took mes but got stopped out)
12:26 PM VXAlgo ES 48M Sell Signal +NQ 48 sell (made money)
1:30 PM VXAlgo ES 10M Buy signal (avg down at support & made money)
In regards to the market today, we broke over the 48 min resistance yesterday night when market opened and it pushed us into bullish zone,
naturally when market is in bullish zones, it can push hard so you just have to sit back and watch if you missed the entry.
Which was what I did and just waited until we get a sell signal.

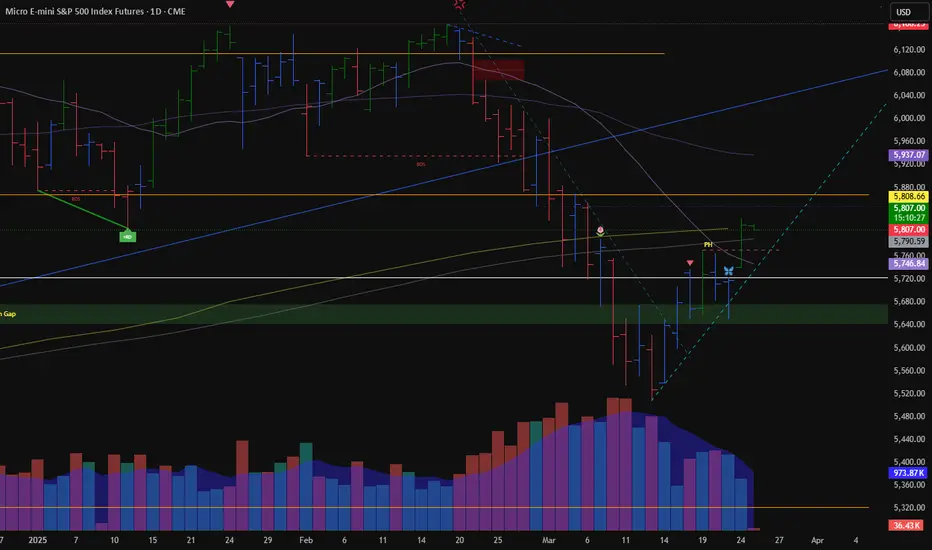
SPY/QQQ Plan Your Trade for 3-24-25 : Bozu Trending PatternToday's Bozu Trending pattern suggests a very aggressive price move is likely. I believe this move will be to the upside after my weekend research suggested we are moving into a "blow-off" topping pattern that will act as a Bull Trap.
Overall, I belive the SPY/QQQ have about 2-3 days up upward price trending early this week, then the markets will suddenly roll into a topping pattern and start to aggressively move downward.
The next base/bottom of the continued downward price trend sets up in early/mid April. The March 21-24 base/bottom is likely the minor base/bottom we have seen over the past 3-5+ days.
I believe the breakdown in the SPY/QQQ late this week and into next week will result in a new lower low - causing the Consolidation phase of this downturn to extend down to the 520-525 level on the SPY.
Bitcoin is very close to my $88,000 upper target level (only about $250 off that level). Get ready, BTCUSD should make an aggressive move downward after stalling near the FWB:88K level peak.
Gold and Silver are moving into a trending mode. I believe both Gold and Silver will rally this week and into the next few weeks as we expand into the Expansion phase.
Buckle up. If my research is correct, we are going to see a BIG ROLLOVER this week.
Get some.
#trading #research #investing #tradingalgos #tradingsignals #cycles #fibonacci #elliotwave #modelingsystems #stocks #bitcoin #btcusd #cryptos #spy #gold #nq #investing #trading #spytrading #spymarket #tradingmarket #stockmarket #silver

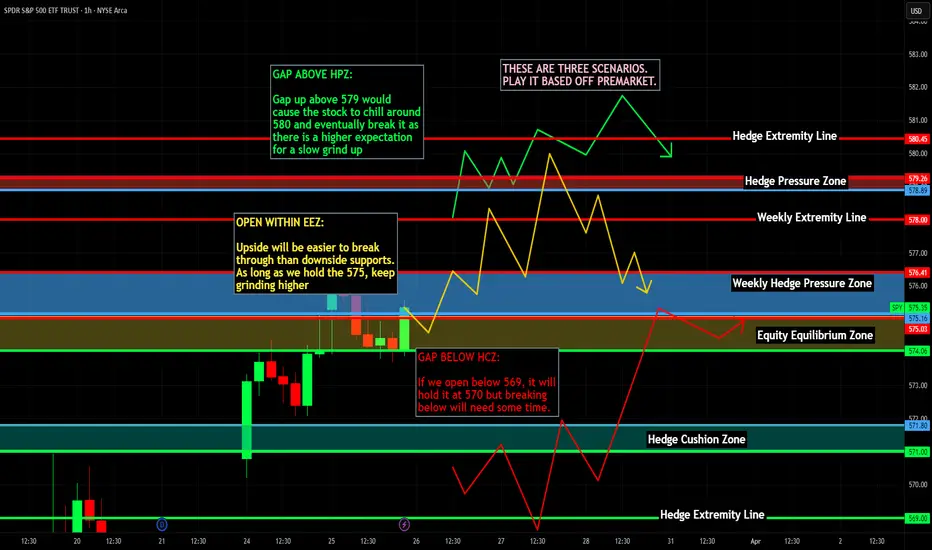
Why I Took the L (and Feel Great About It)Why I Took the L (and Feel Great About It) | SPX Analysis 24 Mar 2025
The markets are meandering again, and I’m starting to feel like a one-man tribute band for “Brimful of Asha” on repeat. Another grindy week, another re-run of the up-a-bit, down-a-bit SPX drama.
Today’s vibe? Picture those magnificent men in their flying machines… looping up diddely up-up and down diddely down-down with zero destination in sight.
The overnight futures opened with some energy - but landed us smack back into the call wall zone at 5700/5720. Meanwhile, the Bollinger Bands are pinching tighter than my jeans post-Christmas, confirming what we already know: this market’s stuck in a range.
But here's the thing… I’m not stressing it. I’ve seen this dance before. And I know exactly what I’m waiting for.
---
Deeper Dive Analysis:
Another week, another range, and here I am again – sipping coffee, muttering to myself like a budget oracle, watching SPX push a few points higher and thinking… "Didn’t we just do this yesterday?"
The overnight futures gapped higher, but the market basically landed us right back into the same call wall we’ve been dancing with all week – 5700/5720. It’s like déjà vu… but with less excitement.
And don’t even get me started on the Bollinger Bands. They’re pinching so tightly now you could use them as a tourniquet. Yes, we’re consolidating. Yes, we already knew that. But now it’s like the market is actively mocking us.
🎯 So what’s changed? Nothing.
The plan remains exactly the same:
Wait for a breakout-pullback – either direction.
Don’t force trades.
Stay sharp, but don’t get twitchy.
Friday’s rally? It messed with the last of my bear swings, and instead of dragging the positions out like a bad soap opera, I just let them expire and took the loss. Not because I had to. But because they were irritating me.
Sometimes, the smartest move is not about managing the trade – it’s about managing the trader. I cleared the decks, reset the headspace, and now I’m ready for what comes next.
So here we are:
Bullish trigger is still 5720+
Bearish trigger stays below 5605
Everything in between is just noise.
And yeah, I’m still leaning bearish, but I’m not forcing it. We’ve seen this pattern before – the grind, the stall, the fakeout. And when the real move comes? That’s when I’ll strike.
Until then, it’s back to the charts, back to the tea, and back to waiting with the quiet smugness of someone who knows patience pays better than panic.
Let’s see if today delivers… or if we’re just rolling the same episode again.
---
Fun Fact
📢 In 1997, when the VIX dropped below 10, traders called it "nap time."
The market stayed so calm for so long, many option traders took part-time jobs just to stay busy - including one notorious story of a floor trader who moonlighted as a nightclub bouncer.
💡Lesson? When volatility vanishes, don’t force action – prepare for the return of chaos.

S&P500 Next Key Levels I will be waiting to see if we get some short term buying before continuing down to $5,200 levels.
Waiting for price to reach the $5,800 area and anticipating a strong rejection to continue the bearish trend.
After confirmation of the rejection, I will be looking for simple lower lows, lower highs before entering a sell, preferably around the $5,600 mark.
What are your thoughts on the AMEX:SPY and the THINKMARKETS:USDINDEX in general?

Trading Is Not Gambling: Become A Better Trader Part III'm so thankful the admins at Tradingview selected my first Trading Is Not Gambling video for their Editor's Pick section. What an honor.
I put together this video to try to teach all the new followers how to use analysis to try to plan trade actions and to attempt to minimize risks.
Within this video, I try to teach you to explore the best opportunities based on strong research/analysis skills and to learn to wait for the best opportunities for profits.
Trading is very similar to hunting or trying to hit a baseball... you have to WAIT for the best opportunity, then make a decision on how to execute for the best results.
Trust me, if trading was easy, everyone would be making millions and no one would be trying to find the best trade solutions.
In my opinion, the best solution is to learn the skills to try to develop the best consistent outcomes. And that is what I'm trying to teach you in this video.
I look forward to your comments and suggestions.
Get some.
#trading #research #investing #tradingalgos #tradingsignals #cycles #fibonacci #elliotwave #modelingsystems #stocks #bitcoin #btcusd #cryptos #spy #gold #nq #investing #trading #spytrading #spymarket #tradingmarket #stockmarket #silver

$BABA HARMONICS Suggest move is over with a possible $95 TargetNot sure if I'm doing this correctly but please do chime in and help out if you can. What this is, is an addition to my previous post about BABA coming back down to EARTH. I'm just adding another chart to reinforce the idea.

$BABA on its way to $120s into AprilI would honestly be surprised if it doesnt gap down this Monday before the open. The weekly imo, looks like a mess atm and could gap into $120s easy. If it doesn't, I would expect some consolidation for a fall into the First week of April. We're right at the golden pocket retrace at the .618, very common retracement level, if we look at Fibs with a bearish perspective and measure a retrace back to the lower golden pocket at 1.61 fib from highs, $112.30 would be my ultimate target if we can break $126. $126 opens the flood gates to our ultimate target at $112.
