Combined US Indexes - Time to make a Lower HighFrom the last time, the Combined US equity indexes did keep into the Extension Zone (EZ) as marked out. This Zone is defined from the lowest point of the TD Setup and the range is determined by the range of the candle that has the lowest point, this case being Candle 9 (4 March).
So after the expected two week in the EZ, we see an indication of the week ahead to continue the Sell Setup and break out of the EZ for the week, at least from mid-week where it would be candle 9.
According to TD rules, this Sell setup is NOT bullish, and can be expected to turn further down from resistance (Orange Line). This orange line is determined from the weekly chart where there is an ongoing TD Buy Setup (bearish) that needs to be kept intact for the trend to continue.
So, based on the techincals, the combined US equities may be seeing a last week of bullishness which goes through the yellow ellipse, then face strong resistance and continue the main Bearish trend (as depicted by the prevailing Buy Setup (20Feb to 4Mar). Noted that the main trend changed to Bear once the TDST was broken down on 3Mar.
Here are very good live examples for those keen on (Thomas) Demark indicators; watch and wait for it to develop...
Spy!

SPY: Long Trade Explained
SPY
- Classic bullish pattern
- Our team expects retracement
SUGGESTED TRADE:
Swing Trade
Buy SPY
Entry - 564.17
Stop - 555.92
Take - 581.52
Our Risk - 1%
Start protection of your profits from lower levels
Disclosure: I am part of Trade Nation's Influencer program and receive a monthly fee for using their TradingView charts in my analysis.
❤️ Please, support our work with like & comment! ❤️

NIKE INC. AMERICAN SHOOES LOOSING GLOSS, AHEAD OF U.S. RECESSIONNIKE Inc. or Nike is an American multinational company specializing in sportswear and footwear.
The company designs, develops, markets and sells athletic footwear, apparel, accessories, equipment and services.
The company was founded by William Jay Bowerman and Philip H. Knight more than 40 years ago, on January 25, 1964, and is headquartered in Beaverton, Oregon.
As of July 15, 2024, NIKE (NKE) shares were down more than 33 percent in 2024, making them a Top 5 Underperformer among all the S&P500 components.
Perhaps everything would have been "normal", and everything could be explained by the one only unsuccessful December quarter of 2023, when the Company’s revenue decreased by 2 percentage points to $12.6 billion, which turned out to be lower than analyst estimates.
But one circumstance makes everything like a "not just cuz".
This is all because among the Top Five S&P500 Outsiders, in addition to NIKE, we have also shares of another large shoe manufacturer - lululemon athletica (LULU), that losing over 44 percent in 2024.
Influence of macroeconomic factors
👉 The economic downturn hurts most merchandise retailers, but footwear companies face the greatest risk to loose profits, as higher fixed costs lead to larger profit declines when sales come under pressure.
👉 The Nasdaq US Benchmark Footwear Index has fallen more than 23 percent since the start of 2024 as consumer spending is threatened by continued rising home prices, banks' reluctance to lend, high lending rates, and high energy and energy costs. food products - weaken.
👉 In general, the above-mentioned Footwear Sub-Industry Index continues to decline for the 3rd year in a row, being at levels half as low as the maximum values of the fourth quarter of 2021.
Investment Domes worsen forecasts...
👉 In the first quarter of 2024, Goldman Sachs made adjustments to its forecast for Nike shares, lowering the target price to $120 from the previous $135, while maintaining a Buy recommendation. The company analyst cited ongoing challenges in Nike's near-term growth trajectory as the main reason for the adjustment, anticipating potential underperformance compared to market peers, noting that Nike's 2025 growth expectations have become "more conservative."
👉 Last Friday, Jefferies Financial Group cut its price target from $90.00 to $80.00, according to a report.
👉 Several other equity analysts also weighed in on NKE earlier in Q2 2024. In a research note on Friday, June 28, Barclays downgraded NIKE from an "overweight" rating to an "equal weight" rating and lowered their price target for the company from $109.00 to $80.00.
👉 BMO Capital Markets lowered their price target on NIKE from $118.00 to $100.00 and set an overweight rating on the stock in a research report on Friday, June 28th.
👉 Morgan Stanley reaffirmed an equal-weight rating and set a $79.00 price target (up from $114.00) on shares of NIKE in a research report on Friday, June 28th.
👉 Oppenheimer reiterated an outperform rating and set a $120.00 price target on shares of NIKE in a research report on Friday, June 28th.
👉 Finally, StockNews.com downgraded NIKE from a "buy" rating to a "hold" rating in a research report on Friday, June 21st.
...and it becomes a self-fulfilling prophecy
Perhaps everything would have been fine, and all the deterioration in forecasts could have been attributed to the stretching spring of price decline, if not for one circumstance - it is not the ratings that are declining due to the decline in share prices, but the shares themselves are being pushed lower and lower, as one after another depressing ones are released analytical forecasts from investment houses.
16 years ago. How it was
On January 15, 2008, shares of many shoe companies, including Nike Inc. (NKE) and Foot Locker Inc. (FL) fell after investment giant Goldman Sachs (GS) slashed its stock price targets, warning that the U.S. recession would drag down the companies' sales in 2008 as consumers spend more cautiously. "The recession will further increase the impact of the key headwind of a limited number of key commodity trends needed to fuel consumer interest in the sector," Goldman Sachs said in a note to clients.
In early 2008, Goldman downgraded athletic shoe retailer Foot Locker to "sell" from "neutral" and cut its six-month share price target from $17 to $10, saying it expected U.S. sales margins to continue to decline in 2008 despite store closures.
The downgrade was a major blow to Foot Locker, which by early 2008 had already seen its shares fall 60 percent over the previous 12 months as it struggled with declining sales due to declining demand for athletic shoes at the mall and a lack of exciting fashion trends in the market. sports shoes.
Like now, at those times Goldman retained its recommendation rating to “buy” Nike Inc shares, based on general ideas about the Company’s increasing weight over the US market, topped off with theses about the Company’s international visibility, as well as robust demand ahead of the Beijing Olympics.
However Goldman lowered its target price for the shares from $73 to $67 ( from $18.25 to $16.75, meaning two 2:1 splits in Nike stock in December 2012 and December 2015).
Although Nike, at the time of the downturn in forecasts, in fact remained largely unscathed by the decline in demand for athletic footwear among US mall retailers, it reported strong second-quarter results in December 2007 (and even beating forecasts for strong demand for its footwear in the US and growth abroad) , Goldman Sachs' forecasts for Nike's revenue and earnings per share to decline were justified.
Later Nike' shares lost about 45 percent from their 2008 peaks, and 12 months later reached a low in the first quarter of 2009 near the $40 mark ($10 per share, taking into account two stock splits).
The decline in Foot Locker shares from the 2008 peaks 2009 lows was even about 80 percent, against the backdrop of the global recession and the banking crisis of 2007-09.
Will history repeat itself this time..!? Who knows..
However, the main technical graph says, everything is moving (yet) in this direction.

German $DAX ($EWG) Topping Out?Originally posted on 3/12, but blocked b/c I referenced my X account. Looks like a bearish move could be materializing alongside broader risk asset weakness:
Is the XETR:DAX topping out? Monthly RSI @ 80+ w/ weekly nosing over and daily bearish divergences observable. Index high from 3/6 coincided with the 261.8% Fibonacci extension of the 11/2021-10/2022 uptrend correction.
Confirmation short setup could materialize $FDAX closes below pivot low of the 1D uptrend (22226), bounces off of short-term demand (ex: 22142-21691, and trades into supply ≥ 22226. This scenario is speculative - the market needs to show its hand.
Presently, DAX is up > 1.5% alongside US stocks, which dipped into intermediate-term demand and benefited from softer-than-expected CPI prints. However, DAX (and domestic) bulls haven't proven anything yet. Unless buyers manage to push the DAX higher - initially above 22900 and secondarily through 23000-23200 - on accelerating momentum, risk remains to the downside (IMO). German stocks have been global relative strength leaders as of late, so if they do correct, other equity indexes may retreat in tandem.
Long-term charts for US indices ( SP:SPX , NASDAQ:NDX , TVC:RUT ) look more bearish vs. bullish (I still have some shorts on), though a near-term recovery is plausible. If domestic equities do trade lower, selling could materialize in Asian and European markets. Use LTF charts to monitor price action/manage risk and splice into shorts if German stocks AMEX:EWG start to crack.
My $0.02. Feedback welcome.
Jon

SPY/QQQ Plan Your Trade for 3-21-25 : BreakAway PatternToday's Breakaway pattern may show up in the form of an Island Top or break-away to the upside if my analysis is correct.
I see the markets stalling over the past few days, potentially setting up a "last breakaway" type of pattern today.
I've highlighted how these "last" patterns work where price sets up a peak or trough (in this case a peak) as a last/exhaustion move and how this move can sometimes be very aggressive.
I urge traders to stay cautious today as we are moving into a MAJOR REVERSAL weekend.
I believe the markets will suddenly change direction next week (early) and will move back into downward trending by March 25-26.
Gold and Silver may rally today if the markets move into that Exhaustion Peak pattern. Keep an eye out for Gold/Silver/Bitcoin to potentially rally today and into early next week.
Overall, traders should stay very cautious as we move into next week's peak/top/rollover.
Don't get too aggressive trying to prepare for the rollover or any potential upside move over the next 3-5+ days.
Let the markets show us what and when we need to be aggressive.
Get Some.
#trading #research #investing #tradingalgos #tradingsignals #cycles #fibonacci #elliotwave #modelingsystems #stocks #bitcoin #btcusd #cryptos #spy #gold #nq #investing #trading #spytrading #spymarket #tradingmarket #stockmarket #silver

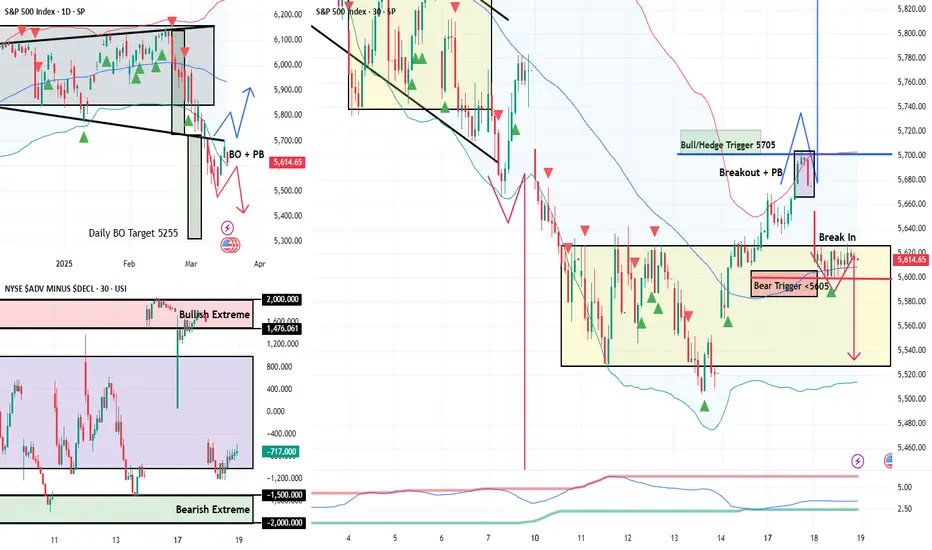
Bollinger Bands Pinch, Market Yawns… I Stay Ready Bollinger Bands Pinch, Market Yawns… I Stay Ready | SPX Analysis 21 Mar 2025
It’s Friday, the market’s half-asleep, and I’ve redrawn my trendlines more times than I’ve refreshed my tea.
The weekly chart (top left, if you're playing along at home) is shaping up to close with a tight little range bar, which basically tells us what we already knew: we're in a classic sideways smush. (technical term)
And yes—I've once again spent time repositioning the bull/bear boundary levels, only to find that my actual triggers haven't changed a bit. The Bollinger Band pinch just confirms the stallout. Nothing new. Nothing sexy. Just… waiting.
And honestly? I’m fine with that. Because Monday’s “don’t rush it” dodge saved me from getting trapped on the wrong side of a lazy bounce.
Still bearish. Still patient. Still on standby fora push towards 5600, where I’ll happily ring the register on a few bear swings.
---
There’s a special kind of frustration in watching a chart do absolutely nothing while you do absolutely everything to analyse it.
That’s where we are. SPX continues to compress, now sporting a tight little Bollinger pinch that confirms (again) that the market’s in full nap mode.
🟠 Weekly chart: Range bar. Narrow. Uneventful.
🟠 Boundary redrawing: Done. Re-done. And redone again.
🟠 Bull/Bear triggers: Still the same, above 5705 for bulls, below 5605 for bears.
I’ve adjusted my short-term channel view, tried to refine the angles, squinted at a few Fibonacci levels, and... nothing's really changed. .
What’s interesting, though, is that while all this noise is happening, the real setups are marinating. My bear swings are aging like fine wine, just waiting for a push toward 5600 so I can cash out a few tranches that’ve been overstaying their welcome.
And let’s not forget:
💥 The bull trigger still hasn’t fired.
💥 Monday’s Paddy's Day Party and bull entry swerve? Best decision of the week.
💥 No new entries unless levels break. No exceptions.
I’m not expecting a massive move today, though saying that probably jinxed it. If we get some surprise action late in the day, great. If not, I’ll be clicking into the weekend with my blood pressure blissfully normal and my trades still on track.
---
Fun Fact
📢 Did you know? Jesse Livermore, one of history’s greatest traders, once said: "The real money is made in the waiting."
💡 The Lesson? The best trades don’t happen when you force them—they happen when you let them come to you.

Nightly $SPY / $SPX Scenarios for March 21, 2025 🔮 🔮
🌍 Market-Moving News 🌍:
🇯🇵📉 Japan's Inflation Data Release 📉: Japan will release its inflation figures for February on March 21. Analysts expect a slight decrease in the Consumer Price Index (CPI) from January's 4.0% to approximately 3.5%. This data could influence global markets, including the U.S., as it may impact the Bank of Japan's monetary policy decisions.
📊 Key Data Releases 📊:
📅 Friday, March 21:
🛢️ Baker Hughes Rig Count (1:00 PM ET) 🛢️:
Previous: 592 rigs
This weekly report provides the number of active drilling rigs in the U.S., offering insights into the health of the oil and gas industry.
⚠️ Disclaimer: This information is for educational and informational purposes only and should not be construed as financial advice. Always consult with a professional financial advisor before making investment decisions.⚠️
📌 #trading #stockmarket #economy #news #trendtao #charting #technicalanalysis

I wouldn't be surprised for a capitulatory type of drop tomorrowAs we can see the trend line have held the US500/SPX/SPY price for so many times, we still couldn't break above it. In other word, it's acting as current overhead resistance ever since we broke down from this white line. We tried three times so far this week, 17th, 19th and the 20th, still couldn't manage to break above it. So if anything happens tomorrow, it would be a big red candle to tomorrow with gigantic volume since it is going to be the "Quad Witching" Day.
When will the "True Bounce" be happening? I would say, the bounce back window should starts as early as next week if we see capitulation tomorrow.

$DIS keeping it simple, fake pump to $102 ishSimple chart. Seeing some NYSE:DIS flow coming in to the upside short term. Chart looks ok. Giving $100c 4/17 a try. Fill at $3.25.
WSL

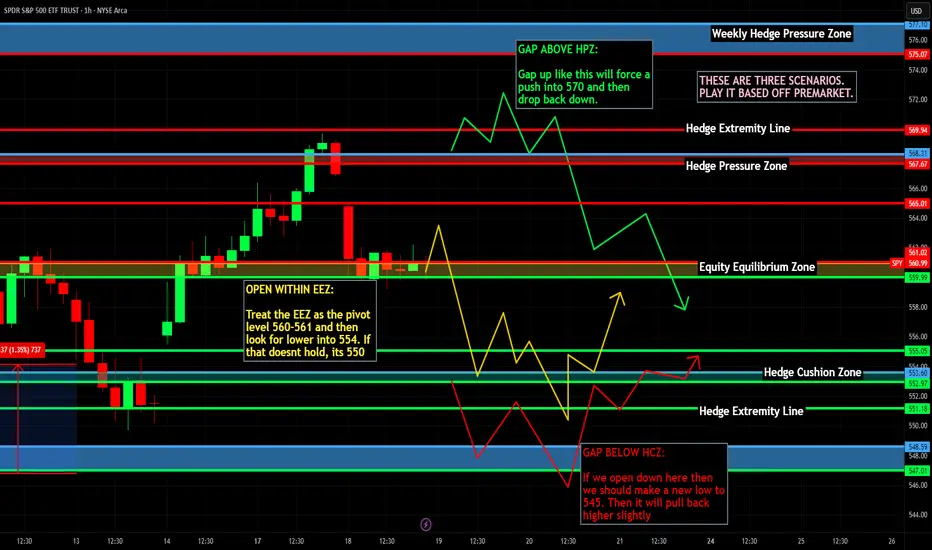
Gamma Exposure Analysis SPY & VXX SPY Resistance at 570. The 570 level in SPY likely corresponds to a high gamma concentration for 0DTE (zero days to expiration) options. At this strike, market makers short gamma (i.e., net sellers of options) at this level would dynamically delta-hedge by selling SPY as the price approaches 570, creating selling pressure and resistance. Next resistance level 575.
For VXX , the 48 level likely represents a put-dominated gamma zone: If market makers are net long puts, they would buy VXX as prices decline toward 48 to hedge against further downside, creating support. Next support level 46.50

RSP and WHY I AM BULLISH STILL197/199 target The chart posted is the sp 500 equal weighted RSP has dropped to a trend line dated back to march 23 2020 . I have three clean points and all are major . Elliot Wave calls for a final 5th wave to end this advance in the area of 198 plus or minus 1.25 Fib relationship and PUT /CALL as well as most of my spiral and cycles point to the final advance to a Bull market top is now setup . BULL MARKETS TOP ON GOOD NEWS > Best of trades WAVETIMER

SPY/QQQ Plan Your Trade For 3-20-25 : Flat-Down PatternToday's SPY Cycle pattern suggests the SPY/QQQ will stay somewhat muted in trading range today.
I still believe the SPY/QQQ are in a moderate melt-up type of trend - attempting to reach a peak near the end of this week or early next week (see the patterns for March 24, 25, 26).
Even though I believe we are struggling to try to move higher, I do believe any failure of the SPY to move above the 0.382 Fibonacci retracement level would be a technical failure related to the breadth of this pullback.
Thus, I believe the markets have at least one more attempt to try to move higher over the next 5+ days before topping and rolling over into a broader downtrend.
Gold and Silver moved solidly lower this morning - almost like a Panic type of selling. I believe this is related to the Flat-Down pattern and I believe Gold/Silver will recover fairly quickly. I do believe this is a huge opportunity for Gold/Silver over the next 30+ days. I believe Gold will attempt to move above $3500-3600 before the end of April.
BTCUSD rolled higher yesterday by more than $4000 - just like I predicted.
Incredible.
And, that is another reason why I believe the SPY/QQQ have more room to the upside than we are seeing right now.
Remember this is a trader's market.
Get some.
#trading #research #investing #tradingalgos #tradingsignals #cycles #fibonacci #elliotwave #modelingsystems #stocks #bitcoin #btcusd #cryptos #spy #gold #nq #investing #trading #spytrading #spymarket #tradingmarket #stockmarket #silver

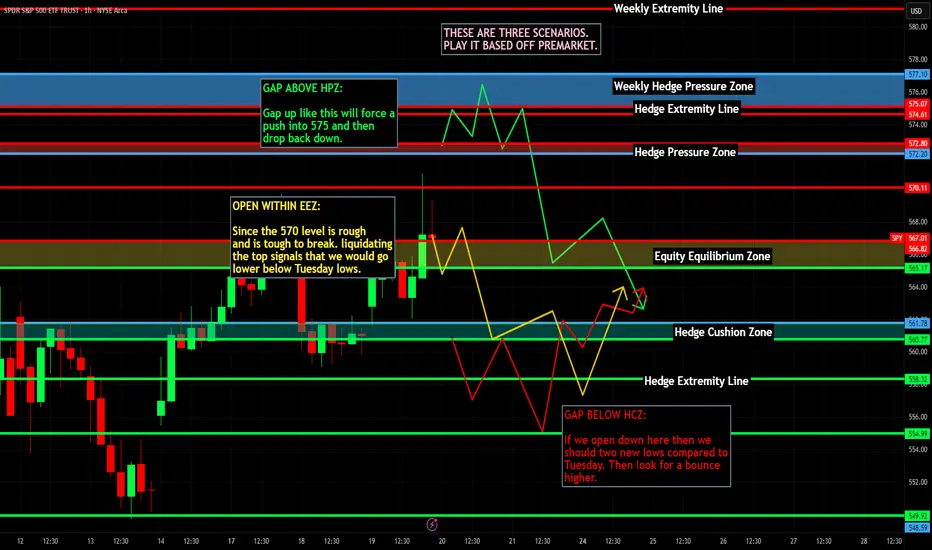
5700 Holds the Key - But I’m Not Chasing5700 Holds the Key - But I’m Not Chasing | SPX Analysis 20 Mar 2025
There was a time—many, many moons ago—when I’d stare at the screen, heart pounding, watching every single tick, second-guessing myself, sweating over every micro-move.
And you know what? It was exhausting.
Now? I don’t play that game anymore.
I check my charts twice a day—once in the morning, once near the close. That’s it. I don’t get caught in the noise, I don’t set alerts that jolt me into action every five minutes, and I sure as hell don’t stress over every single price fluctuation that nudges my trigger levels.
Because I trade a system—not emotions.
Right now, SPX is hovering near my key levels, and while others are biting their nails and jumping in too soon, I’m just… waiting.
---
Deeper Dive Analysis:
I used to think the best traders were the ones who never took their eyes off the screen.
That was a lie.
📌 How I Trade Without Letting the Market Control Me
I’m a full-time trader, but that doesn’t mean I sit at my desk all day, reacting to every tiny move.
I check the charts in the morning to set my plan.
I check back near the close to manage open positions.
That’s it.
No pointless alerts. No staring at every price tick. No overreacting when price comes close to my trigger levels.
📌 Why This Works – Stress-Free & More Profitable
Not gluing myself to the screen means:
I don’t jump in too soon out of FOMO.
I don’t panic if price "almost" hits my level.
I let trades play out without second-guessing every move.
📌 SPX Setup – The Same Plan, Still Waiting
Despite all the noise, the plan hasn’t changed.
5705 is my bullish trigger.
5605 is my bearish trigger.
5700 is shaping up to be a key pivot level.
The market is dancing around these numbers, but I’m not chasing.
📌 Why Patience Pays – Let the Market Do the Work
I’m not paid to react—I’m paid to execute.
If price confirms my setup, I’ll take action.
If it doesn’t, I wait.
Either way, I sleep just fine at night.
📌 Final Thought – Trading Is NOT a 9-5 Job
The market doesn’t care how long you stare at your screen.
Great trades don’t require babysitting.
Stress-free trading is real—you just need discipline.
The best setups work, with or without you watching.
So today, I’ll do what I always do—stick to my plan, check in when I need to, and let the market come to me.
Because the real secret to high profits and low blood pressure?
Not overtrading.
---
📢 Did you know? In 1958, legendary trader Richard Donchian introduced the 4-week rule—if price breaks out after four weeks of sideways action, it often triggers a massive move.
💡 The Lesson? Great setups don’t happen every day—but when they do, you better be ready.

Nightly $SPY / $SPX Scenarios for March 20, 2025🔮 🔮
🌍 Market-Moving News 🌍:
🇨🇳🏦 People's Bank of China (PBOC) Interest Rate Decision 🏦: On March 20, the PBOC will announce its latest interest rate decision. While specific expectations are not detailed, any adjustments could influence global markets, particularly in the Asia-Pacific region.
🇬🇧🏦 Bank of England Interest Rate Decision 🏦: The Bank of England is scheduled to announce its interest rate decision on March 20. Analysts anticipate that the central bank will maintain the current rate at 4.5%, following a recent reduction. This decision will be closely watched for its implications on the UK economy and global financial markets.
📊 Key Data Releases 📊:
📅 Thursday, March 20:
📉 Initial Jobless Claims (8:30 AM ET) 📉:This weekly report indicates the number of individuals filing for unemployment benefits for the first time, providing insight into the labor market's health.
Forecast: 225,000
Previous: 220,000
🏭 Philadelphia Fed Manufacturing Index (8:30 AM ET) 🏭:This index measures manufacturing activity in the Philadelphia Federal Reserve district, with positive numbers indicating expansion.
Forecast: 10.0
Previous: 18.1
🏠 Existing Home Sales (10:00 AM ET) 🏠:This data reflects the annualized number of previously constructed homes sold during the prior month, offering insights into the housing market's strength.
Forecast: 3.95 million annualized units
Previous: 4.08 million annualized units
⚠️ Disclaimer: This information is for educational and informational purposes only and should not be construed as financial advice. Always consult with a professional financial advisor before making investment decisions.⚠️
📌 #trading #stockmarket #economy #news #trendtao #charting #technicalanalysis
SPY rally done soon?My overall thesis is we are in the very early stages of a multi-year decline ultimately with the S&P 500 below 3500. I have been wrong many times before so I will just take this thing in stages and see if it plays out. After this massive decline, we should be in for a great market rally of many decades. I am expecting the market to end its recent rally this week. The current rarely would be about a week in length depending when it began for individual stocks. The rally has done a few important things with its slow and prolonged upward movement, mainly prevents a wave 3 signal from occurring during the next decline.
My wave 3 indicator tends to signal wave 3s and 3 of 3s. See my scripts for the specifics of the indicator. If the market had a short wave 4 up and then a sharp or prolonged drop during wave 5, a new wave 3 signal would occur which violates the currently placed Minor wave 3 (yellow 3). Allowing separation from the current wave 3 signal enables wave 5 to drop quick or slow.
This chart applies select movement extensions based on wave 1's movement on the left and then another based on wave 3's movement on the right. I keep the values between 0%-100% on the chart for wave 2s and 4s retracements of the preceding wave's movement for reference even though the retracement values would be inverted.
Specifically for SPY, Minor wave 3 was longer than wave 1, which does not place a maximum length on wave 5. Assuming wave 4 ends on Thursday or Friday, Minor wave 5 could be a week or longer. In that time, at the very least it should drop below wave 3's bottom of 549.68. Using some basic movement extensions, it will likely go lower. The 5 wave lower pattern for this fifth wave is hypothetical, but a bottom could occur between 525-538. Once we bottom, we should see another rally over a few weeks. I will forecast what that could look like as Intermediate wave 1 nears its end.
Another possibility that could play out is we rally through the weekend. In this case Intermediate wave 1 possibly ended at the current Minor 3 bottom. This would mean we are in Intermediate wave 2 now. I will evaluate this solution if the rally continues next week.

MAG7 MODEL Rally is going to be in the form of ABC up The chart posted is the Mag 7 .I feel strong that the super cycle Top in the mag 7 was seen like January 2000 in the internet Bubble . I am counting a clean 5 waves down and see a strong ABC rally phase like that in 2000 then we dropped about 30% in the first leg down followed by a huge Bearish rally back up first leg up moved to the 50% retracement and then had a abc down for wave b of B to be followed up to .618 of the decline to form THE B Wave TOP . I am looking forward in my work and my models to see a near prefect rematch in the formation . I stated in my dec 8th forecast How the market will unfold based on the Wave structure and cycles and the DATA . We are now set for that abc rally . next turn date in spirals in 3/28 best of trades WAVETIMER

Trading Is Not Gambling : Become A Better Trade Part IOver the last few weeks/months, I've tried to help hundreds of traders learn the difference between trading and gambling.
Trading is where you take measured (risk-restricted) attempts to profit from market moves.
Gambling is where you let your emotions and GREED overtake your risk management decisions - going to BIG WINS on every trade.
I think of gambling in the stock market as a person who continually looks for the big 50% to 150%++ gains on options every day. Someone who will pass up the 20%, 30%, and 40% profits and "let it ride to HERO or ZERO" on most trades.
That's not trading. That's flat-out GAMBLING.
I'm going to start a new series of training videos to try to help you understand how trading operates and how you need to learn to protect capital while taking strategic opportunities for profits and growth.
This is not going to be some dumbed-down example of how to trade. I'm going to try to explain the DOs and DO N'Ts of trading vs. gambling.
If you want to be a gambler - then get used to being broke most of the time.
I'll work on this video's subsequent parts later today and this week.
I hope this helps. At least it is a starting point for what I want to teach all of you.
Get some.
#trading #research #investing #tradingalgos #tradingsignals #cycles #fibonacci #elliotwave #modelingsystems #stocks #bitcoin #btcusd #cryptos #spy #gold #nq #investing #trading #spytrading #spymarket #tradingmarket #stockmarket #silver

Will the spring & summer of 2025 conclude our retrace in minor BIn the interest of full disclosure we have not even confirmed our minor A has in fact bottomed...but assuming we have struck a short term bottom, we are now embarking on a minor B wave retrace that I anticipate taking us into the start of summer.
In any respect, I am viewing this as only a counter trend rally with a scary (c) of C of (A) to come into the low SPX 5,000 region eventually. There everything gets decided for the long-term.
Be careful out there.
Chris

SPY/QQQ Plan Your Trade For 3-19-25 : Top PatternToday's Top pattern suggests the SPY/QQQ will attempt to rally up to resistance, then form a peak/top in price, and then roll over a bit.
After yesterday's fairly consolidated price range, I believe the SPY/QQQ may rally through most of the day and move into the topping pattern near the end of today's trading day.
Overall, I believe the markets are still rolling into the Excess Phase Peak consolidation phase and that means traders need to prepare for extreme price volatility.
What is interesting is how BTCUSD is trying to rally a bit, but not finding upward momentum.
As I stated in today's video, I believe a fairly big move upward, possibly $3000 or more, in BTCUSD could happen between now and the end of this week.
This would be a perfect upward price advance into resistance that could correlate with a move h higher in the SPY/QQQ - targeting the upper level of the Consolidation Phase.
Gold and Silver have reached a "pause" level. I believe Gold and Silver will only pause for 48 to 96 hours before attempting to break higher. So, metals will still attempt to break higher into late March 2025.
Get some.
#trading #research #investing #tradingalgos #tradingsignals #cycles #fibonacci #elliotwave #modelingsystems #stocks #bitcoin #btcusd #cryptos #spy #gold #nq #investing #trading #spytrading #spymarket #tradingmarket #stockmarket #silver

Tight Coil, Big Move Coming - FOMC Could Be the TriggerTight Coil, Big Move Coming - FOMC Could Be the Trigger | SPX Analysis 19 Mar 2025
Sometimes, doing nothing is the best trade you’ll ever make.
While I was off enjoying my long weekend, SPX’s bullish move got slapped back into the range. Had I jumped in long, I’d probably be hedging or cursing my screen right now.
Now, price is coiling into a bear flag, and with the FOMC circus rolling into town at 2PM, I’m expecting things to stay tight until the fireworks start.
📌 Bullish above 5705.
📌 Bearish below 5605.
📌 Until then, I sit back and let the market make the first move.
Because in this game, you don’t force trades—you wait for the perfect shot.
---
Deeper Dive Analysis:
Some days, doing nothing is the right trade.
That’s exactly what I did over my long weekend, and it ended up saving me from stepping into a bullish trap. SPX’s move up was short-lived, and now we’re right back in the range—but this time, it’s setting up in an interesting way.
📌 The Setup – Bear Flag + FOMC = Volatility Incoming
SPX has:
Fallen back into the previous range—bulls are losing control.
Coiled into a tight bear flag formation—hinting at a breakdown.
FOMC later today, which could be the match that lights the next move.
📌 The Trade Plan – Let the Market Show Its Hand
Right now, I have no interest in guessing. Instead, I’m letting the market come to me.
Bullish above 5705? I’ll consider a long setup.
Bearish below 5605? I’ll ride the downside momentum.
Until then, I sit tight.
📌 Bigger Picture – The Waiting Game
FOMC is always a game of patience. Traders try to guess what’s coming, but most end up whipsawed to oblivion.
I won’t be one of them.
If the market confirms my bias, I strike.
If it fakes out, I wait for a better setup.
No stress, no panic—just disciplined execution.
📌 Bottom Line – The Best Trade Is Sometimes No Trade
For now, I’m watching, waiting, and keeping my capital intact.
Because when the market finally makes its real move, I’ll be there, ready to take full advantage.
---
Fun Fact
📢 Did you know? The longest FOMC meeting in history lasted five days—in 1932, during the Great Depression. Traders were left in limbo, staring at their tickers, waiting for an answer that took 120 hours to arrive.
💡 The Lesson? Waiting for clarity isn’t new—it’s just that today, we get our pain in hours, not days.
Nightly $SPY / $SPX Scenarios for March 19, 2025 🔮 🔮
🌍 Market-Moving News 🌍:
🇺🇸🏦 Federal Reserve Interest Rate Decision 🏦: The Federal Open Market Committee (FOMC) will announce its interest rate decision on Wednesday, March 19, at 2:00 PM ET, followed by a press conference with Fed Chair Jerome Powell at 2:30 PM ET. The Fed is widely expected to maintain the federal funds rate at its current range of 4.25% to 4.5%. Investors will closely monitor the Fed's economic projections and Powell's comments for insights into future monetary policy, especially in light of ongoing trade tensions and global economic uncertainties.
🇯🇵💴 Bank of Japan Monetary Policy Decision 💴: The Bank of Japan (BOJ) is set to announce its monetary policy decision on March 19. The BOJ is expected to keep interest rates steady, as policymakers assess the potential impact of U.S. trade policies on Japan's export-driven economy. The yen has remained stable ahead of the announcement, with traders awaiting the BOJ's guidance on future monetary policy.
📊 Key Data Releases 📊:
📅 Wednesday, March 19:
🏢 Existing Home Sales (10:00 AM ET) 🏢:This report measures the annualized number of existing residential buildings sold during the previous month, providing insight into the strength of the housing market.
Forecast: 5.50 million annualized units
Previous: 5.47 million annualized units
⚠️ Disclaimer: This information is for educational and informational purposes only and should not be construed as financial advice. Always consult with a professional financial advisor before making investment decisions.⚠️
📌 #trading #stockmarket #economy #news #trendtao #charting #technicalanalysis
$META CRASH in PROGRESS !! $600 incomingWowzers... I'm not sure what to say but ... good money is going to be made here for sure... would love to see this play out to the Tee... Take care yall ... DAILY BAR PATTERN from the Box of June 24' - Aug 24' .... I must say... let's make it happen..

10D Chart shows Falling 3 , Pullback to 3/18!! $SPYAMEX:SPY shows 10D trend very clear. It is my hidden gem. We, by my charting, Should pullback until 3/18 ... not sure how far but I have plenty of targets on the way down to my ultimate target at 5200... I think we could flush to $560.. Good Luck yall. Gems I tell ya... sorry I'm so bad at explaining things..
