Nightly $SPY / $SPX Scenarios for March 7, 2025🔮 🔮
🌍 Market-Moving News 🌍:
🇺🇸📊 Anticipated U.S. Jobs Report 📊: The Bureau of Labor Statistics is set to release the February employment report on Friday, March 7. Economists expect an increase of approximately 133,000 nonfarm payrolls, with the unemployment rate holding steady at 4%.
📊 Key Data Releases 📊:
📅 Friday, March 7:
👷♂️ Nonfarm Payrolls (8:30 AM ET) 👷♂️:
Forecast: +133K jobs
Previous: +150K jobs
This report indicates the number of jobs added or lost in the economy, excluding the farming sector, and is a key indicator of employment trends.
📈 Unemployment Rate (8:30 AM ET) 📈:
Forecast: 4.0%
Previous: 4.0%
This metric represents the percentage of the total workforce that is unemployed and actively seeking employment during the previous month.
💵 Average Hourly Earnings (8:30 AM ET) 💵:
Forecast: +0.3% month-over-month
Previous: +0.2% month-over-month
This metric indicates the month-over-month change in wages, providing insight into consumer income trends.
⚠️ Disclaimer: This information is for educational and informational purposes only and should not be construed as financial advice. Always consult with a professional financial advisor before making investment decisions.⚠️
📌 #trading #stockmarket #economy #news #trendtao #charting #technicalanalysis
Spy!

+405% day from $0.35 to $1.77 for $PSTV WOW 🔥 +405% from $0.35 to $1.75 NASDAQ:PSTV 🚀 What market sell off 🤷🏻♂️ we don't know anything about that, our strategy is getting us paid no matter the overall market circumstances 💪 It's been like this for over a decade
P.S. AMEX:SPY is at 200 moving average, if it cracks below it we could see NASDAQ:TSLA NASDAQ:NVDA NASDAQ:AMZN NASDAQ:GOOG NASDAQ:META and many others go way lower.

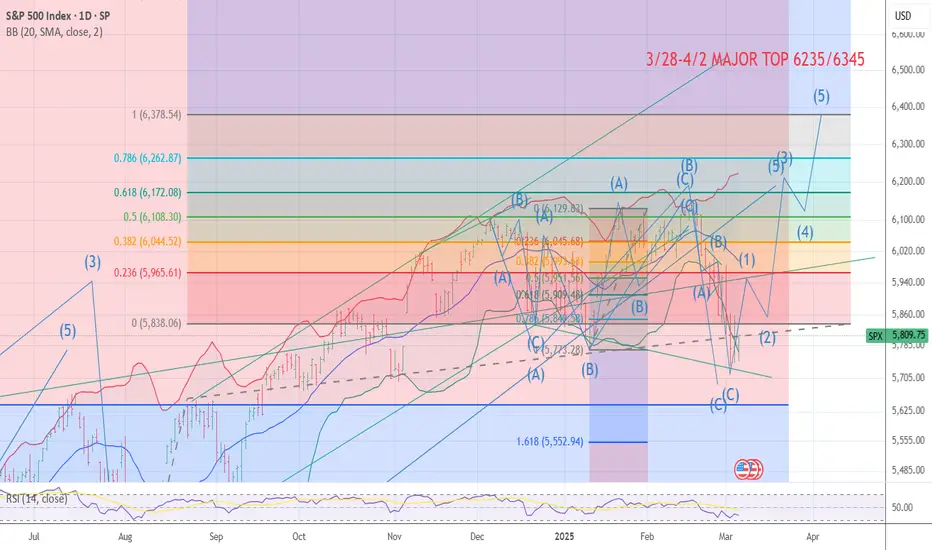
NEW BULL MOVE IS NEAR Wave 4 cycle low SETUPI am coming into the major and minor spiral cycle Low is has been due into 3/8 3/13 focus on the 10th for sometime . But the Crash cycle is in day 10 today and over the last 112 years data back to 1902 the crash cycle has been from 8 to 12 days long we are in day 10 Now .I have taken up a 75 % long deep in the money Calls into this morning drop I this give the market a chance of 30 % to drop to the lower target of 5644 But Put Call models are bell ringing now .I will move to 100 % long calls at 5723/5713 and move to 110 % long at 5644 MIT . after the low print and we break above 5909 on a close I have a confirmed LOW and we short see a major 5th wave blow off it should take 26 TD and the target min is 6183 and max to 6430 with 6235 being focus in the math In the QQQ 552 is a focus with 545 as the min max based on the Math 564 Tight range for the QQQ as it should be The DJI will see a minor new new above 45040 best of trades WAVETIMER
SPY - support & resistant areas for today March 6, 2025The key support and resistance levels for QQQ today are above.
Understanding key levels in trading can provide valuable insights into potential market movements. These levels often indicate where prices might reverse or consolidate, serving as important signals for traders considering long (buy) or short (sell) positions.
Calculated using complex mathematical models, these levels are tailored for today's trading session and may evolve as market conditions change.
If you find this information beneficial and would like to receive these insights every morning at 9:30 AM, I invite you to support me by boosting this post and following me @OnePunchMan91. Your engagement is greatly valued! However, please note that if this post doesn’t receive more than 10 boosts, I will have to reconsider providing these daily updates. Thank you for your support!

SPY/QQQ Plan Your Trade for 3-6-25: Breakaway PatternToday's Breakaway pattern suggests the SPY/QQQ will attempt to move away from yesterday's open/close price range.
Given the fairly strong downward pre-market trending in the SPY/QQQ, I'm cautiously optimistic we will see a fairly strong MELT-UP in price related to the recent support/rejection levels near 575.
I'm urging my followers to be cautious of the first 30-60 minutes of market activity today. Jobs data (or other data) could disrupt price after the open and I believe price will be very volatile in the first 30-60 minutes of trading today.
In other words, price may try to SHAKE-OUT early positions with wild volatility before settling into a MELT-UP or MELT-DOWN trend.
As I shared in my video, today's BreakAway pattern could break upward or downward. I believe the upward trend potential has about a 60-70% chance of happening IF the 575 level holds as support. If not, then we will probably break downward.
The fact that BTCUSD is holding up quite well suggests the SPY/QQQ may actually MELT-UPWARD. Again, we need to see how things play out in early trading today.
Gold & Silver are consolidating into a range which may continue over the next 3-4 days. The current bias for Gold and Silver is an uptrend. So, I do believe metals will continue to appreciate throughout this 3-4 day consolidation phase.
The only reason I urge traders to stay cautious for the first 30-60 minutes is because of the Jobs data and how the markets may react to news items. You can't kick the markets to go in a certain direction.
So, often, it is better to let the morning SHAKE-OUT happen, then wait for more clear trending to setup.
Get some.
#trading #research #investing #tradingalgos #tradingsignals #cycles #fibonacci #elliotwave #modelingsystems #stocks #bitcoin #btcusd #cryptos #spy #es #nq #gold

$QQQ $508 Rug Pull ? All in on REDSo… attaching the bar pattern from Spring 2022, I see the next decline by the middle of next week. I’ll be placing my bets at today’s close if possible . 🫡 Target is $480 by next Friday. Short $508 into next week.

SPX500 - Bulls Need Strong Entry Bar - 6 Mar 2025
The report below uses the Spy chart which is the Normal Trading House.
• The market traded lower earlier to retest the March 4 low but formed a higher low. The market then reversed higher into the close, closing the daily candlestick as a bull inside bar closing in its upper half.
• The bulls see the market trading in a broad bull channel and want the move to continue for months. They want an endless pullback bull trend.
• They want a retest of the all-time high (Dec 6) followed by a breakout and trend resumption. They see the current move (Mar 4) as a bear leg within the trading range.
• They want a reversal from a double bottom bull flag (Jan 13 and Mar 4) and a wedge (Feb 25, Feb 28, and Mar 4).
• They hope the bottom of the 22-week trading range will act as support. They want a failed breakout below the January 13 low. So far, the breakout below the trading range low has limited follow-through selling.
• At the least, they want a retest of the middle of the trading range (around the 20-day EMA). They must create a strong entry bar today (March 6) to increase the odds of the bull leg beginning.
• If the market trades lower, they want the November 4 or October 3 low to act as support.
• The bears got a reversal from a higher high major trend reversal, a wedge top (Dec 6, Jan 24, and Feb 19), and a smaller double top (Jan 24 and Feb 19).
• They see the market as being in a 22-week trading range.
• They got a bear leg to retest the January 13 low and hope to get a breakout followed by a measured move based on the height of the 22-week trading range.
• So far, the breakout below the January 13 low has limited follow-through selling.
• If the market trades higher, they want the bear trend line or the 20-day EMA to act as resistance.
• They want at least a small second leg sideways to down to retest the March 4 low after a pullback (bounce).
• So far, the market is trading in a 22-week trading range.
• The SPX broke below the January 13 low (Mar 4) but the follow-through selling has been limited.
• The move down is strong enough for traders to expect at least a small second leg sideways to down after a pullback (bounce).
• For now, traders will see if the bulls can create a strong bull entry bar today.
• Or will the market trade slightly higher, but stall and close with a long tail or a bear body instead?
• The bulls need to create consecutive bull bars closing near their highs to show that they are back in control.
• The bears must create a strong breakout below the January 13 low with follow-through selling to convince traders a breakout could be underway.
• Traders may BLSH (Buy Low, Sell High) within the trading range until there is a breakout from either direction with follow-through buying/selling.

Nightly $SPY / $SPX Scenarios for March 6, 2025🔮 🔮
🌍 Market-Moving News 🌍:
🇪🇺💶 ECB Interest Rate Decision 💶: The European Central Bank is expected to announce a 25 basis point reduction in its deposit rate, bringing it to 2.5%. This move aims to stimulate economic growth amid ongoing uncertainties, including trade tensions and fiscal policy shifts.
📊 Key Data Releases 📊:
📅 Thursday, March 6:
📉 Initial Jobless Claims (8:30 AM ET) 📉:This weekly report indicates the number of individuals filing for unemployment benefits for the first time, providing insight into the labor market's health.
Forecast: 220K
Previous: 215K
📦 Factory Orders (10:00 AM ET) 📦:This report details the dollar level of new orders for both durable and non-durable goods, offering insight into manufacturing demand.
Forecast: -0.5%
Previous: +1.2%
⚠️ Disclaimer: This information is for educational and informational purposes only and should not be construed as financial advice. Always consult with a professional financial advisor before making investment decisions.⚠️
📌 #trading #stockmarket #economy #news #trendtao #charting #technicalanalysis

Recession IncomingVery clear confirmation signals here across many sectors in the market that we are in a recession. Fundamentals were breaking down last summer in fact, but now everything is rising to the surface and markets are turning. Buckle up.
Oil is breaking down today.
Bond yields continue to signal de-risking.
USD continues to break down.
USD/JPY is heading lower back toward July panic levels.
VIX is sustaining above 20.
I'm not 100% clear on the structure of this count, so please feel free to share your charts and insight here, but I don't think we are looking at a buy the dip and shoot back to new highs situation anytime soon here.. Unless Trump's entire policy stance changes, he drops Tariffs, and starts increasing the deficit and handing out money, the tightening and de-risking will continue. That said, I believe this is a great thing long-term and is what needs to happen, so I am all for a recession at this point. But this medicine is going to tasty very bad.
All of those white boxes below the price chart are unfilled gaps. I'm not entirely sure if there is an amount of time that passes that makes unfilled gaps less reliable, but still they are there.

$ROKU Bullish Reversal?I have taken a 1/2 size position here on $ROKU. It had a nice big earnings gap and has since pulled back. It looks to me that it is now ready to reverse higher. See notes on chart.
I have taken the fact that it broke (just barely) the Downtrend Line and put in what looks to be a reversal candle. My stop will be just below yesterday's low.
This is my idea. If you like it, please make sure it fits within your trading rules. While I consider this a low risk trade, you may not. Thanks for looking. Comments always welcome.

SPY/QQQ Plan Your Trade For 3-5-25: Flat-Down PatternToday's pattern suggests the SPY will move into a sideways type of stalling pattern. Based on yesterday's rejection off the lows, I suspect we may see some continued upward reversion trending, then we'll likely see the SPY move into a stalling pattern near 579.
Ultimately, the Flat-Down pattern does not suggest big trending will take place today.
Yesterday's price rejection off the lows adds a bit to the overall picture that the SPY may attempt to move away from that lower support level - thus, we may see some upward "melt-up" type of trend today.
But, overall, I'm not confident we'll see any big price trends today. I expect the SPY to stay somewhat flat/muted today. Same thing with the QQQ.
If we do see any big price move today, it will likely be news-related.
Gold and Silver are both sitting near 618 pause levels and continuing to try to push higher. I believe both gold and silver will make an expansion move over the next 5 to 7+ trading days and begin a very solid rally phase. Where gold will attempt to break above $3000 and Silver will attempt to rally above $35.
Bitcoin is still struggling in the Consolidation phase. This wide-range consolidation should continue until sometime near March 19-24.
Don't expect Bitcoin to do much except consolidate into the flagging sideways price trend for the next week or two.
Go get some today.
#trading #research #investing #tradingalgos #tradingsignals #cycles #fibonacci #elliotwave #modelingsystems #stocks #bitcoin #btcusd #cryptos #spy #es #nq #gold

Nightly $SPY / $SPX Scenarios for March 5, 2025🔮 🔮
🌍 Market-Moving News 🌍:
🇨🇳📉 China's Manufacturing Activity Contracts 📉: China's official Manufacturing Purchasing Managers' Index (PMI) fell to 49.9 in February, down from 50.1 in January, indicating a contraction in manufacturing activity for the second consecutive month. This downturn raises concerns about global economic growth and could impact markets worldwide.
📊 Key Data Releases 📊:
📅 Wednesday, March 5:
📄 ADP National Employment Report (8:15 AM ET) 📄:
Forecast: +160K jobs
Previous: +183K jobs
This report provides a monthly snapshot of private-sector employment, offering insights into labor market trends ahead of the official government employment data.
🏢 ISM Services PMI (10:00 AM ET) 🏢:
Forecast: 53.0
Previous: 52.8
This index assesses the performance of the U.S. services sector. A reading above 50 indicates expansion, while below 50 signifies contraction.
🏭 Factory Orders (10:00 AM ET) 🏭:
Forecast: -0.5%
Previous: +1.2%
This report details the dollar level of new orders for both durable and non-durable goods, providing insight into manufacturing demand.
⚠️ Disclaimer: This information is for educational and informational purposes only and should not be construed as financial advice. Always consult with a professional financial advisor before making investment decisions.⚠️
📌 #trading #stockmarket #economy #news #trendtao #charting #technicalanalysis

S&P500 Index Goes 'Draconian', ahead of Roller Coaster ExplosionThe S&P 500's "roller coaster" behavior stems from its sensitivity to various economic, geopolitical, and market-specific factors that influence investor sentiment and corporate performance.
Economic Factors: Changes in interest rates, inflation, and Federal Reserve policies significantly impact the index. For example, rising interest rates can reduce corporate earnings and valuations, leading to market sell-offs. Conversely, expectations of rate cuts can boost optimism and drive rallies.
Investor Sentiment and Volatility: The S&P 500 is closely tied to the CBOE Volatility Index (VIX), often called the "fear gauge." The VIX rises during market downturns as investors seek portfolio protection, amplifying price swings. This inverse correlation highlights how fear or optimism can drive sharp movements in the index.
Global Events: Geopolitical tensions, natural disasters, or pandemics can disrupt markets by creating uncertainty about future economic performance. Such events often lead to sudden spikes or drops in the S&P 500 as investors react to perceived risks.
Valuation Cycles: Overvaluation or bubbles in specific sectors can lead to corrections. For instance, high price-to-earnings ratios combined with slower economic growth can result in prolonged periods of stagnation or volatility.
These factors collectively create the "roller coaster" effect begun in the S&P 500.
// Life is like a roller coaster, as you don't know what's going to be thrown at you next, so all you can do is give us your best shot.
--
Best wishes,
@PandorraResearch Team 😎

S&P500 $SPY | SPY’s All-Time High - Where to Next? | Feb23'25S&P500 AMEX:SPY | SPY’s All-Time High - Where to Next? | Feb23'25
AMEX:SPY BUY/LONG ZONE (GREEN): $597.50 - $613.23
AMEX:SPY DO NOT TRADE/DNT ZONE (WHITE): $584.88 - $597.50
AMEX:SPY SELL/SHORT ZONE (RED): $574.00 - $584.88
AMEX:SPY Trends:
AMEX:SPY Weekly Trend: Bullish
AMEX:SPY Daily Trend: Bullish
AMEX:SPY 4H Trend: Bullish
AMEX:SPY 1H Trend: Bearish
AMEX:SPY just reached a new all-time high! How did price get there?
AMEX:SPY experienced a small range between 602.45 – 604.00, followed by bearish momentum, leading to a 3% drop in price. However, bullish momentum quickly stepped in, pushing the price up before continuing downward again. This bearish trend was short-lived and appears to have formed a developing range rather than a sustained downtrend.
Shortly after, price broke back above 597.50, signaling the start of a new bullish trend. SPY then established a ranging pattern between 597.50 - 608.00 before ultimately breaking out to a new all-time high of 613.23. Despite the breakout, price action has now dropped back into the range between 597.50 - 608.00.
Where to next? Will SPY hold its new highs, or is this the start of a reversal?
This is what I would personally look at before entering trades, everything is subject to change on a daily basis and as I analyze different timeframes and ideas.
ENTERTAINMENT PURPOSES ONLY, NOT FINANCIAL ADVICE!
trendanalysis, trendtrading, priceaction, priceactiontrading, technicalindicators, supportandresistance, rangebreakout, rangebreakdown, rangetrading, chartpatterntrading, chartpatterns, spy, sp500, s&p, fed, federalreserve, fedrate, AMEX:SPY , snp, snp500, usmarket, usmarkets, stockmarket, overallmarket, spyath, spyalltimehigh, all-time high, price action, bullish trend, bearish momentum, trading range, breakout, support and resistance, choppy market, untradable zone, stock market, technical analysis, market trends, price breakout, volatility, trend reversal, stock trading, SPY analysis, market momentum, trading strategy, sparros, sparrosexchange,

$KTOS Defense Stock Going Higher?I took this long this morning after finding out that there is some insider buying. It looks like it is in a solid uptrend on this 30 minute chart. If this trade works it can run 20% to 30% in just a few weeks. All TBD.
My stop is just below today's low.
This is my idea, if you like it please make sure it fits with your trading plan.

NEW RECORD HIGH Coming 26 td from today The wave structure I was so bearish on Has made it to the support targets the crash cycle based on data back to 1902 is all Crash cycles have been 8 to 12 TD today is day 9 I have moved to a 90 long knowing that the cycle has at most 2 days and is into the 5 /6 spiral cycle lows inan event due by 3/8 to 3/13 focus 3/10 .I can now state that the chart posted could be counted as an expanding triangle in what is now labeled wave 4 I am looking for a sharp 26 td rally to mark the top from 3/10the week .SP 100 should see 3055 min to as high 3150 in a blowoff wave . Best of trades WAVETIMER

US $ YEN Rally back up to .618 The us dollar trade has a nice rally setup so this aid in the sp 500 rally to above 6183 to 6347 So cycles and wave structure are rather positive for next 26 td best of trades WAVETIMER .

PUTCALL BELL RINGING BUY SIGNAL I am 90 % long callsData back to 1902 All CRASHES have been 8 to 12td days long today is day 9 I have moved to a 90 % long today and will move to 100 at 5718 mit and 110 % at 5644 plus or minus 11 We are ending wave 4 and will see a 610 pt rally in the sp 500 to a final BLOWOFF TOP from the march 10 to 13th Low it maybe early .So time to move 90 % long see the double red arrow signal . best of trades WAVETIMER

Direxion High Beta Bull S&P 500 3X | HIBL | Long at $30.86Contrarian view, despite tariffs. I don't think this rodeo is over - but I could always be wrong. Even if individual consumption drops (which I think it has for some time now), rising prices will continue to mask it. Many, but not all, companies will profit and until there is a "bigger" catalyst... bullish.
AMEX:HIBL is a personal buy at $30.86 (also noting the possibility of it going into the FWB:20S in the near-term)
Targets:
$40.00
$45.00
$50.00

VIX going higher: Sector Rotation UnderwayTVC:VIX is the tool I use for market timing. It tells us a lot. When it spikes to a Resistance (often 50% of the last major high) that tends to be a market bottom. But when you see what it is doing the last few weeks: Closing sustainably higher each bar... you know the market is pricing in more volatility.
VIX is known as the "fear index" and you can extrapolate that out to see that fear is increasing. The VIX is also the most forward looking indicator I have found for the stock market. All signs point to more broad market downside.
Another thing going on in context is a clear Sector Rotation. I noticed this last week but today's look at the Sector ETFs make it more clear. Not everything is down; AMEX:XLP and AMEX:XLU are up even as AMEX:SPY makes new lows. What this tells me is that investors are fleeing into "quality" stocks with low volatility and that pay dividends.
I'm currently sitting in cash, waiting for opportunities, and hedged some of my long term tax advantage accounts in AMEX:SH

broke long term trend. hold cashbroke long term trend. hold cash and buy when we hit the 236 line on the spy

Time to Prepare | $SPY Options Bull & Bear Week 1 March 2025AMEX:SPY
Last week's AMEX:SPY $595 Put 3/10 ran for 66% from $480 up to $1,420.
The last two weeks, the market has suffered a controlled pullback. So far it has been cautious selling rather than outright panic. While fear has entered the market, it has yet to reach capitulation, where there would be significantly more potential downside. The key level to watch long-term is the 200SMA on the daily chart, currently at $568.45. This level, which hasn't been tested in 16 months, could signal a Stage 4 selloff, a more aggressive and potentially prolonged downward trend.
Here are this week's AMEX:SPY Options:
(15-30 minute candle closes for confirmation and stop-loss)
📜 $580 PUT 3/17
Entry: Breakdown and failed retest of $584.50
Target 🎯 : $580, $574, $571
📜 $590 CALL 3/17
Confirmed breakout over $584.50
Target 🎯 : $590, $591.50, $594

SPY/QQQ Plan Your Trade for 3-4-25: Top Resistance PatternToday's pattern is a Top Resistance pattern.
Usually, these types of patterns reflect a market where price moves higher - attempting to find a peak/resistance level, then rolls downward (confirming that resistance level).
Because of yesterday's strong selling after Trump's Tariff comments, I suggest the peak in today's price activity may be set in very early trading.
We're going to have to watch the charts to see how price reacts to more news and the continued restructuring of global economies.
One thing is obvious: the markets are resettling based on Trump's expectations and tariff comments. I checked out TLT and a few other symbols last night, and it appears the Predator Fed comments I made over the past 12+ months are still holding up very well.
Inadvertently, the US has moved into a position of being the 900 lb gorilla of the global markets.
Higher Fed rates for longer are putting pressure on global currencies and many global economies.
If Trump is able to secure more US manufacturing and a more secure US economy (reducing deficit spending), I can see the next 3+ years being very disruptive for the global markets.
Ultimately, though, building a strong US economy and going through this disruption will lead to explosive growth in 2026 and beyond. You may not see it now, but if we are able to organize our government/finances better going forward - start to think about how powerful that could be for the next 15 to 25+ years.
Next, thank you for all the great comments. Love it.
Gold and Silver are starting to make that recovery rally move after the last 7+ days of selling. This could be a very powerful move to the upside for metals and miners.
Bitcoin is still struggling and will likely stay trapped in a sideways range. that range could be $10k to GETTEX:13K in size - so stay cautious of wild volatility in BTCUSD if you are trading it.
Again,I want to urge all of you to consider your trading as "taking calculated risks" - not gambling.
I talked to a friend just yesterday, and he told me how I changed his life by helping him to stop the gambling-style of trading he was doing. Once you realize that trading is not about those HUGE WINS (sure they are nice) - but it is about staying agile, getting in and out with decent profits, and growing your account efficiently.
So, I urge you to step back and consider every new trade you take as "how much am I really risking if things go wrong". When you do that, you'll find you can still take the trade, but you'll teach yourself to manage your capital more efficiently.
Ok. Go Get Some!
#trading #research #investing #tradingalgos #tradingsignals #cycles #fibonacci #elliotwave #modelingsystems #stocks #bitcoin #btcusd #cryptos #spy #es #nq #gold
