TSLA PRICE ACTION JUNE 25 2025This is the price action for Tesla. I have discussed all the levels. I have given a trade today & have discussed it thoroughly.
If you have any doubts, then feel free to Dm me or leave a comment below
NOTE:DO NOT BUY CALLS
Spy!

Nasdaq All-Time Highs, S&P Close, Blast Off or Breakdown?What an incredible melt-up since April 7 lows in the US markets.
Trump vs Musk - ignored
Iran vs Israel - ignored
High Valuations - ignored
FED Pausing - ignored
The US economy is resilient and it's a good thing because the world is performing really well (EX-US). Europe/China/India/Emerging Markets are outperforming the US by 15-16% YTD
The USD is having one its worst years ever in 2025
Gold, Silver, Bitcoin are great diversifiers in my opinion for 2025
Oil prices are incredibly volatile and energy stocks and commodities in turn are showing
volatility and big swings
As we near end of month and end of Q2, I have to believe the market is due for a small pause or pullback sooner rather than later - but we'll see
Thanks for watching!!!

The Ghost of 1986-1987 Stock Market Overlay onto $IWMThe 1986-1987 stock market advance was 48% as measured by the S&P500 Index SP:SPX from the low in late 1986 which peaked in August 1987 and crashed into October 19th's spectacular 20% decline in one day.
The advance in the Russell 2000 Index from the low in 2023 to the high in 2024 was 51%, topping the 48% gain in the SP:SPX and the meltdown wasn't as spectacular, but it was similar.
There were similar patterns in fears of trade wars, US dollar declines, new tax laws going into effect back then and tax laws sunsetting this time. Those you can go into by reviewing my other charts I have published over the years here.
I stretched the 1987 pattern to fit the low to the high, so it isn't "exactly" the same time day-to-day for this pattern.
I found it interesting because the chart of AMEX:IWM all by itself had the same "look" to me as the 1987 bull market and crash so I decided to put it together for you all here to see.
I would expect a choppy market from here on as people adjust to the new uncertainties. Sellers of this decline will be shy to reinvest anytime soon and buyers are likely afraid to step up and get aggressive with so much uncertainty.
Sentiment as measured by AAII shows an extremely fearful and reluctant investor class, which is typical to see at major market bottoms.
Wishing everyone peace and prosperity!
Tim West
11:17AM EST April 24, 2025

SPY/QQQ Plan Your Trade for 6-25 : Breakaway PatternToday's Breakaway pattern suggests the SPY/QQQ may attempt to move into another breakaway price move - very similar to yesterday's price move.
I will add that I believe the SPY cycle patterns have already moved through a breakaway phase with the ceasefire news early this week. I believe the gap and breakaway move yesterday may be the breakaway trend we are expecting today.
That would suggest the markets could pause and pullback a bit over the next few days.
Gold and Silver are trying to find a bottom after the brief selling that took place over the past few days. I really do believe Gold and Silver are poised to make a big move higher.
Bitcoin is on a terror to the upside. But be cautious of the downward cycle channel that may prompt a rollover in BTCUSD near the $107,500 level.
I spend a little time near the end of this video highlighting my work on the Tesla 3-6-9 price theory and going over a few examples for my new book on trading.
Enjoy the quick look at some of the more advanced techniques I'm working to unlock for all of you.
Get some.
#trading #research #investing #tradingalgos #tradingsignals #cycles #fibonacci #elliotwave #modelingsystems #stocks #bitcoin #btcusd #cryptos #spy #gold #nq #investing #trading #spytrading #spymarket #tradingmarket #stockmarket #silver

Nightly $SPY / $SPX Scenarios for June 25, 2025🔮 Nightly AMEX:SPY / SP:SPX Scenarios for June 25, 2025 🔮
🌍 Market-Moving News 🌍
💱 Dollar Slides on Middle East Ceasefire Optimism
A fragile ceasefire between Israel and Iran lifted risk sentiment across global markets. The U.S. dollar weakened, while the euro and British pound hovered near multi‑year highs
📈 Equities Near Record Highs
The S&P 500 and Nasdaq pushed toward all-time highs on June 25, supported by the Middle East truce and retreating energy prices. The S&P 500 rallied ~1.1%, with tech and discretionary sectors leading the charge
🛢 Oil & Treasuries Dip, Yield Cuts Anticipated
Oil plunged ~6% to ~$65/bbl as conflict fears eased. Softer prices plus weak consumer confidence spurred expectations of up to 60 bps in Fed rate cuts by December; Treasury yields pulled back accordingly
📉 Consumer Confidence Falls Again
The Conference Board’s index dropped to 93—the lowest level since May 2020—as concerns over tariffs and job availability weighed on households
📊 Key Data Releases 📊
📅 Wednesday, June 25:
(No major U.S. economic data scheduled)
Markets remain focused on geopolitical dynamics, Fed commentary, and next week’s PCE inflation release.
⚠️ Disclaimer:
This information is for educational and informational purposes only and should not be construed as financial advice. Always consult a licensed financial advisor before making investment decisions.
📌 #trading #stockmarket #economy #geopolitics #Fed #inflation #technicalanalysis
SPX Rug📊 Chart Analysis: ES1! (S&P 500 E-mini Futures, 1H) – Impending Breakdown via iFVG and Rising Wedge Top
This chart represents a technical analysis setup for ES1! (S&P 500 E-mini Futures) on the 1-hour timeframe. Here’s a contextual breakdown pointing toward a potential “rug pull” scenario by the end of the week, driven by an internal Fair Value Gap (iFVG) rejection and wedge resistance structure:
⸻
🔺 Structure Overview: Rising Wedge and Distribution Top
• The price action is following a rising wedge, which is typically a bearish reversal pattern, especially when occurring after a strong impulse move.
• The wedge’s upper trendline has just been tagged or slightly breached, with price showing early signs of rejection (small-bodied candles, wicks).
• A parabolic curve is drawn projecting a rounded top, suggesting buyers may be exhausting into resistance.
⸻
🧩 Internal Fair Value Gap (iFVG) in Focus
• The shaded gray area below current price action marks an iFVG (Internal Fair Value Gap) – a low-volume inefficiency formed during the recent bullish rally.
• iFVGs often act as magnetic zones, pulling price back to “rebalance” before continuation or reversal.
• Price has not yet filled this inefficiency completely, indicating a likely retracement target.
⸻
📉 Projected Breakdown Path
The curve implies a rounded top formation, with the following potential sequence:
1. Minor liquidity grab just above the wedge resistance.
2. Failure to hold above resistance confirms a deviation and traps late longs.
3. Sharp drop into the iFVG zone (gray block).
4. If iFVG support fails, acceleration toward the lower wedge trendline could follow — a true rug pull scenario.
⸻
🔻 Bearish Confluence Factors
• Volume divergence or lack of sustained momentum at highs (not visible here, but implied).
• The steepness of the rally suggests FOMO-driven buying, often vulnerable to reversal.
• The price has extended significantly from the last consolidation base, creating air pockets below.
• Candle structure shows upper wicks and rejection tails, signaling supply.
⸻
🗓️ Timing Bias – Into Week’s End
• Given the tightness of the wedge and proximity to iFVG + overhead resistance, any retracement could be swift and violent, particularly if driven by macro catalyst or profit-taking.
• Expectation would be a breakdown into Thursday or Friday, aligning with common volatility windows (e.g., weekly options expiry).
⸻
🔚 Summary
• Bias: Bearish (short-term)
• Trigger: Rejection of wedge high / deviation above resistance
• Targets:
• Primary: Fill of iFVG (gray zone)
• Secondary: Breakdown to lower wedge support
• Invalidation: Sustained acceptance above wedge trendline with bullish continuation

06/24/25 Trade Journal, and ES_F Stock Market analysis EOD accountability report: -717.50
Sleep: 4.5 hours - heat waves in nyc
Overall health: meh
** VX Algo System Signals from (9:30am to 2pm)** 4/4
9:40 AM Market Structure flipped bullish on VX Algo X3! 5 pts
9:42 AM VXAlgo NQ X3 Buy Signal (failed)
11:00 AM Market Structure flipped bullish on VX Algo X3! 20pt
11:58 AM VXAlgo NQ X1 Sell Signal (failed)
What’s one key lesson or takeaway from today?
and What major news or event impacted the market today?
There are days that the algo will lose but you just gotta trust the process and execute accordingly with a stoploss.
What are the critical support levels to watch?
--> Above 6130 = Bullish, Under 6125= Bearish
Video Recaps -->https://www.tradingview.com/u/WallSt007/#published-charts

SPY/QQQ Plan Your Trade For 6-24 : Post Market UpdateThis post-market update highlights the weakening volume while my primary proprietary modeling system continues to stay BULLISH.
The markets are really quite interesting right now. Weakening volume in this Gapping uptrend, today, suggests traders are not buying into the ceasefire between Iran and Israel.
Additionally, the move in metals suggests a PANIC phase has setup in the US markets.
This type of panic phase typically leads to selling of assets and moving capital into CASH.
I suggest traders continue to prepare for a moderate melt upward trend over the next few days - but be prepared for any potential breakdown (possibly trying to FILL THE GAP).
This market appears to be running on fumes.
While I believe Trump's policies will lead to a stronger bullish price trend over the next few years, these disruptions and the potential for consumers to pull away from spending/economic activity over the second half of 2025 is still very real.
Buckle up.
At this point, hedge your trades, move some capital into CASH and prepare for bigger price volatility as we move into July 2025.
Get some.
#trading #research #investing #tradingalgos #tradingsignals #cycles #fibonacci #elliotwave #modelingsystems #stocks #bitcoin #btcusd #cryptos #spy #gold #nq #investing #trading #spytrading #spymarket #tradingmarket #stockmarket #silver

Nasdaq Surges on Ceasefire Hopes – New All-Time Highs Ahead?By analyzing the #Nasdaq chart on the weekly timeframe, we can see that the index experienced a strong rally following the ceasefire announcement between Iran and Israel, climbing as high as 22,200 so far. If the ceasefire holds and tensions continue to ease, we could see a new all-time high for the Nasdaq.
Potential bullish targets for this move are 22,400, 23,200, and 24,000.
Please support me with your likes and comments to motivate me to share more analysis with you and share your opinion about the possible trend of this chart with me !
Best Regards , Arman Shaban

MAOR HEAD N SHOULDER TOP FORMATION I AM 100 % SHORT NOW The chart posted is that on the NDX 100 .This is my view of what has formed . best of trades WAVETIMER

SPY (S&P500 ETF) - Price Bouncing Up from Support after NewsSPY (S&P500 ETF) price has bounced up from the $593 support level after recent global news (de-escalation news).
Price action has slowed and consolidated in June 2025, and the S&P500 is still maintaining a price uptrend.
The 50EMA and 20EMA Golden Cross is still active and in progress (since May 2025).
The next stock market earnings season is not for another 3 months. Inflation, interest rate news, global events, government news, corporate news will continue to affect price volatility this summer.
Resistance Levels: $604, $610, $612, $619.
Support Levels: $600, $593, $586, $579.

06/23/25 Trade Journal, and ES_F Stock Market analysis EOD accountability report: +1128.75
Sleep: 7.5 hours
Overall health: good
VX Algo System Signals from (9:30am to 2pm) 4/4
10:40 AM VXAlgo NQ X1 Sell Signal (double signal):check: 10 pt move
12:00 PM Market Structure flipped bearish on VX Algo X3! :check: 35 pt move
12:43 PM VXAlgo ES X1 Buy signal (triple signal) :check: 20 pt move
1:34 PM Market Structure flipped bullish on VX Algo X3! :check: 23 pt move
What’s one key lesson or takeaway from today?
and What major news or event impacted the market today?
Oil is trading as if the Israel/US-Iran war is over and market can be irrational lol
What are the critical support levels to watch?
--> Above 6060 = Bullish, Under 6050= Bearish
Video Recaps -->https://www.tradingview.com/u/WallSt007/#published-charts

SPY/QQQ Plan Your Trade For 6-23 : Afternoon UpdateWhat happened to the CRUSH pattern?
Everyone wants to know why the CRUSH pattern didn't show up today. Well, I keep telling all of you these SPY Cycle Patterns are based on GANN, Tesla and Fibonacci price structures. They do not take into consideration news, global events, or anything outside of PRICE.
They are predictive - meaning they attempt to predict potential price shapes/patterns weeks, months, and years in advance.
The markets, obviously, are seeking some normalcy after the Iran conflict. I thought the CRUSH pattern would have been a perfect fit for today - but obviously the markets didn't agree.
If you have been following my videos, you know I keep saying the US stock market is acting as a global hedge for risks. Traders are pouring capital into the US stock market as a way to avoid global risk factors.
Traders are also pouring capital into Gold/Silver. Demand for physical metals is through the roof right now.
Time will tell if my Excess Phase Peak pattern plays out as I expect or if we rally to new ATHs.
Obviously, this sideways rollover topping pattern could present a breakaway in either direction.
Again, my patterns are not correlated based on news or other events. They are strictly price-based.
Get some...
#trading #research #investing #tradingalgos #tradingsignals #cycles #fibonacci #elliotwave #modelingsystems #stocks #bitcoin #btcusd #cryptos #spy #gold #nq #investing #trading #spytrading #spymarket #tradingmarket #stockmarket #silver

SPY/QQQ Plan Your Trade For 6-23 : CRUSH PatternToday's CRUSH pattern suggests the markets will struggle to find any support for a rally. A CRUSH pattern is usually a large breakdown type of price bar that moves aggressively against the dominant trend.
Som, today I'm expecting some fairly large price action and I believe the markets may start a breakdown move this week as we continue to get more news related to the Israel/Iran/US conflict.
This week will be a "resettling" week in my opinion. Buyers will start to actively liquidate and reposition assets as we move deeper into this conflict. When buyers turn into sellers (to get out), the markets usually react very aggressively in trend.
Metals continue to hold up without making any big moves. I believe the increased FEAR level could play out as a moderate rally for metals over the next 15-30+ days.
BTCUSD broke down very hard (more than 6%) over the past 3-4+ days. This is a big move downward for Bitcoin and could suggest US technology stocks/sectors could also collapse on fear of a "rollover top" in the US stock market.
Smart traders will hedge and pull capital away from this potential top - just like I've been suggesting for the past 2-3+ weeks.
Oddly enough, if we do get a rollover/top this week because of the Iran conflict, it plays right into my Excess Phase Peak pattern and the predictions I've been making over the past 4+ months.
No, I don't foresee events like this Israel/US/Iran conflict. I can't see into the future.
What I can do, and continue to try to deliver, is the best analysis I can offer without becoming BIASED by indicators, comments, or other inputs.
I just read the chart and will tell you what I see as the most likely outcome.
Get some..
#trading #research #investing #tradingalgos #tradingsignals #cycles #fibonacci #elliotwave #modelingsystems #stocks #bitcoin #btcusd #cryptos #spy #gold #nq #investing #trading #spytrading #spymarket #tradingmarket #stockmarket #silver

$Entire Market - MASSIVE MOVE COMING SOONSo to keep things short, i've just seen the most massive move in my data i've ever seen in the history of my data. Moves like this indicate an extreme event in the world being priced in.
NEVER in the history of my data have i seen this kind of move in ANY stock and it's being shown in almost ALL stocks.
I think that at some point in the next 14 days we're going to have a massive 4-6 Sigma event either being rate cuts or war stuff. I don't know what it can be myself but i see the state of the world + the absolutely mind boggling move in the data and can put 1+1 together.
This combined with my AI having sold all stocks on Friday... yeah. Something is being priced in.
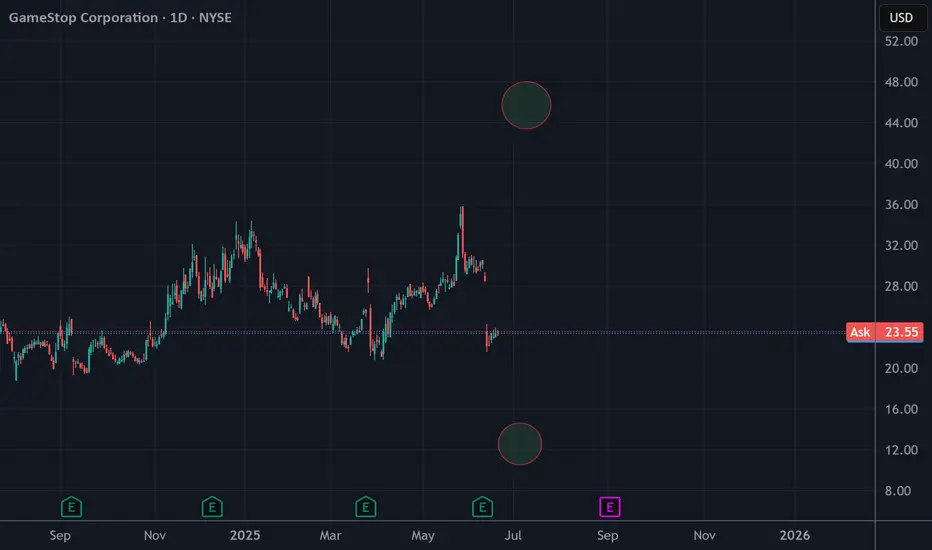
I had in fact thought this was like a GME thing cause i first saw it in GME's data but it's in fact a move in data for ALL stocks and happened on Friday. My dumbass bought GME on Friday thinking we were gonna see a move next week.
To keep things short the TLDR is:
-MASSIVE MOVE SOON (Next week - Maybe the week after)
-Likely direction is BIG DOWNS OR BIG UPs. Only huge outsized moves coming.
-How to play it: Straddle for safety. Puts for big risk big return.
I think we're dropping like -$100 bucks on SPY within a month based on this alone. Won't bet on it until my AI says to do so however. Right now it's just sold all stocks, hasn't bought puts yet or bought calls. Also something like -15 bucks on TQQQ and GME to $11. That or the exact opposite with some absolutely batshit insane ripper due to announcing to replace Jpow and doing rate cuts as soon as next week. It's either this or actual war, but anyway something's being priced in HARD and across the ENTIRE market. This kind of move is going to happen soon and quick, with this kind of insane liquidity, something is going to break...
Not gonna share future updates on the data for this event as to keep some secret and for myself to make money without affecting this trade by informing half the internet. Might eventually make it into a subscription thing on my website for those really interested but for now nah.
A Trend on Borrowed Time, A Micro ED within a Larger ED?Since mid-last month, the broader equity market has been grinding higher — but not with confidence.
The advance has been marked by choppy, overlapping price action that feels more hesitant than bullish. Yes, prices continue carving out higher highs and higher lows, but MACD momentum tells a different story. With every push upward, the MACD weakens, flashing warning signs beneath the surface. Taken through the lens of Elliott Wave theory, this unfolding pattern carries all the classic fingerprints of an Ending Diagonal — a structure that often signals a trend on borrowed time.
Key Characteristics of an Ending Diagonal:
1. Position in the Wave Structure:
A. Occurs in Wave 5 of an impulse wave or Wave C of a corrective pattern (such as a zigzag or flat).
B. Rarely, but sometimes, seen in Wave 3 of an impulse, but this is generally associated with a leading diagonal, not an ending one.
2. Structure:
A. Composed of five sub-waves, labeled (i), (ii), (iii), (iv), (v).
B. Each of these sub-waves subdivides into 3 waves (i.e., they are all corrective or "3-wave" structures, often labeled as a-b-c).
C. This gives the whole pattern a distinct 3-3-3-3-3 internal structure.
3. Price Behavior:
A. Overlapping waves: Wave 4 often overlaps with the price territory of Wave 1, which is normally a rule violation for standard impulsive structures — but it's allowed in an ending diagonal.
B. Converging trendlines: The upper and lower boundaries of the diagonal typically form converging lines (like a wedge), though they can also be parallel in some cases.
C. Diminishing momentum: Often accompanied by momentum divergence, meaning price makes a new high or low, but momentum indicators (MACD, RSI) do not confirm.
4. Implication:
A. An ending diagonal suggests the current trend is running out of steam.
B. Once complete, a sharp reversal or significant correction is expected.
In my analytical view, the byproduct of an Ending Diagonal often lures market participants into a conflicted state — cautious, yet unable to ignore the persistent upward grind. You’ve probably heard the old market adage: “Don’t fight the tape.” In this case, that mentality sets in as traders, wary but worn down, finally throw in the towel and join the advance — only for the market to seemingly punish that decision with a sharp reversal.
Many experienced traders describe their Ending Diagonal experience the same way: “The moment I finally stopped fighting the trend and got long, it was as if the market was waiting for me — and reversed hard.”
That is how I would describe this micro ED we appear to be in the final stages of what I’m counting as the micro wave v of (v) of Minor A.
For now, no key structural support levels within the Micro Ending Diagonal have been breached, so the advance can certainly stretch a little higher. But make no mistake — in my opinion, this remains one of the most dangerous, deceptive patterns to engage with.
Last week, I closed my short out-of-the-money ES call positions during the micro wave iv pullback (not shown on the above chart). Ideally, I’m looking for an opportunity to reestablish a similar position this week. From there I will reassess the larger Ending Diagonal pattern you see outlined on the chart above.

06/20/25 Trade Journal, and ES_F Stock Market analysis06/20/25 Trade Journal, and ES_F Stock Market analysis
EOD accountability report: +1437.50
Sleep: 6 hours
Overall health: hanging in there
** VX Algo System Signals from (9:30am to 2pm)**
— 6/20/2025 9:30 AM VXAlgo ES X1 Sell Signal (double sell) :check:
— 6/20/2025 10:30 AM Market Structure flipped bearish on VX Algo X3! :check:
— 6/20/2025 11:14 AM VXAlgo ES X1 Buy signal (triple buy) :check:
What’s one key lesson or takeaway from today?
and What major news or event impacted the market today?
Fed's Barkin: There is nothing urgent in the data warranting a rate cut at this point.
What are the critical support levels to watch?
--> Above 6015 = Bullish, Under 6005= Bearish
Video Recaps -->https://www.tradingview.com/u/WallSt007/#published-charts

Weekly Market Forecast: Wait To Buy S&P, NAS, & OIL!In this Weekly Market Forecast, we will analyze the S&P 500, NASDAQ, DOW JONES, Gold and Silver futures, for the week of June 22-28th.
The tensions in the Middle East take center stage, as Iran has signaled they are willing to discuss limitations on there Uranium enrichment program. This could allow outflows from safe havens and inflows to risk assets.
Keep and eye on Silver for shorts, in the near term, though.
Let's see if the market tilts its hand early next week. Monday should bring clarity.
Wait for confirmations before entering trades. A break of structure would be ideal! Enter on the pullback to that structure point.
Enjoy!
May profits be upon you.
Leave any questions or comments in the comment section.
I appreciate any feedback from my viewers!
Like and/or subscribe if you want more accurate analysis.
Thank you so much!
Disclaimer:
I do not provide personal investment advice and I am not a qualified licensed investment advisor.
All information found here, including any ideas, opinions, views, predictions, forecasts, commentaries, suggestions, expressed or implied herein, are for informational, entertainment or educational purposes only and should not be construed as personal investment advice. While the information provided is believed to be accurate, it may include errors or inaccuracies.
I will not and cannot be held liable for any actions you take as a result of anything you read here.
Conduct your own due diligence, or consult a licensed financial advisor or broker before making any and all investment decisions. Any investments, trades, speculations, or decisions made on the basis of any information found on this channel, expressed or implied herein, are committed at your own risk, financial or otherwise.

Weekly $SPY / $SPX Scenarios for June 23–27, 2025🔮 Weekly AMEX:SPY / SP:SPX Scenarios for June 23–27, 2025 🔮
🌍 Market-Moving News 🌍
🌐 Geopolitics Add to Risk Aversion
The S&P 500 is up about 0.9% so far in June, but analysts warn it’s facing a “precarious” phase amid renewed Middle East conflict and looming U.S. tariff deadlines in July–August. Elevated oil prices could fuel inflation, while fiscal and debt ceiling pressures weigh on sentiment
🎙️ Powell Heads to Capitol Hill
Fed Chair Powell will testify before Congress this week. His remarks on inflation and rate outlook—particularly regarding the Fed’s recent dot-plot revisions and monetary policy uncertainty—will be central to market direction
📈 Nike, FedEx & Micron Earnings Under Focus
Key corporate earnings (Nike, FedEx, Micron) could provide fresh insight into how tariffs and supply-chain disruptions are impacting major U.S. businesses
🛢️ Oil Prices Elevated
Oil remains range-bound at multi-week highs near $75–80/bbl following U.S.–Israel military action in Iran, which briefly spiked prices ~7–11%. Continued dependence on Middle Eastern supply may keep energy complex volatile
⚖️ NATO Summit Tightens Security Focus
NATO leaders meet in The Hague, marking an elevated global defense posture amid geopolitical uncertainty. Defense and aerospace stocks may remain pressured or volatile depending on summit outcomes
📊 Key Data Releases & Events 📊
📅 Monday, June 23
9:45 AM ET: S&P Global Flash U.S. Services & Manufacturing PMI (June)
10:00 AM ET: Existing Home Sales (May)
📅 Tuesday, June 24
10:00 AM ET: Consumer Confidence Index (June)
Testimony: Fed Chair Jerome Powell appears before Congress
📅 Wednesday, June 25
10:00 AM ET: New Home Sales (May)
📅 Thursday, June 26
8:30 AM ET: Advance Q1 GDP (Final Estimate)
📅 Friday, June 27
8:30 AM ET: Core PCE Price Index (May) — Fed’s preferred inflation gauge
⚠️ Disclaimer:
This is for educational and informational purposes only. It does not constitute financial advice. Always consult a licensed financial advisor before investing.
📌 #trading #stockmarket #economy #geopolitics #Fed #oil #charting #technicalanalysis

Stock Market Forecast | TSLA NVDA AAPL AMZN META MSFTStock Market Forecast | !nq1! !es1! SPY QQQ
Mag 7 Forecast | NASDAQ:TSLA NASDAQ:NVDA AAPL AMZN META MSFT GOOG

Big CorrectionThe S&P index.
The chart shows the potential end of the final rally from the 2009 low.
Currently, with this rally from the recent 4,800 low, we are still in a correction period that will end in late October (highs and lows are irrelevant), & We have a date coming up in August so let's see what happens there.
After this period, we will have a rally combined with uncertainty and unjustified speculative movements (bubble) that could take us to the final peak, which I expect in 2026.
This remains a possibility, but don't base your trades on it. However, caution is often good.

SPY: Expecting Bullish Continuation! Here is Why:
Balance of buyers and sellers on the SPY pair, that is best felt when all the timeframes are analyzed properly is shifting in favor of the buyers, therefore is it only natural that we go long on the pair.
Disclosure: I am part of Trade Nation's Influencer program and receive a monthly fee for using their TradingView charts in my analysis.
❤️ Please, support our work with like & comment! ❤️

Low frequency trading (LFT) vs HFTHey fellow tarders and financial mojol,
I've got some insider info that's going to blow your minds! 🤯
According to my top-secret sources (aka my pet parrot who squawks numbers at me), low-frequency trading algorithms have finally figured out the true fair price of the S&P 500. Drumroll, please... It's $550! That's right, folks, all those high-frequency trading bots are currently aiming for this magical number as we speak.
But wait, there's more! The next step in this thrilling financial adventure involves radiowaving all the way down to $400. Yes, you heard it here first. We're talking about some serious next-level trading strategies that involve actual radio waves. Who needs fiber optics when you've got good old-fashioned radio, right?
So, buckle up and get ready for the ride of your life. The market's about to take a trip back to the good old days when $550 was the dream and $400 was just a stone's throw away.
Happy trading, and remember, if your broker gives you weird looks, just tell them you're tuning into the market's frequency! 📡💸
