MAJOR TOP IS NOW IN PLACE 5th wave up from 4835 has ended 6059The chart posted is that of the sp 500 and I now have counted 5 waves up as ending based on this wave structure I will look for two things to happen a rather deep ABC if there is a bull market intact and it should decline in 3 waves back to .236/382 area from 6059 - 4835 The 4th wave or A low This MUST HOLD at .382 or The cycle has ended the 5 wave sup from march 23 low 2020 I sold longs this morning based on NAAII exposure and Now have moved to a 100 % long VERY DEEP IN THE MONEY PUTS 2027 Best of trades The WAVETIMER
Spy!

SPY/QQQ Plan Your Trade For 6-20 : Pause Bar PatternToday's Pause Bar pattern suggests the SPY/QQQ will slide into a sideways type of PAUSE in price action today. I'm not expecting much to happen and if we do see any breakaway or breakdown trending it will likely be related to news.
While we have options expiration today and a host of other things that could drive the markets, I believe the markets are struggling to find direction right now. Thus, a pause in trading would be somewhat normal after a holiday-shortened trading week.
Gold and Silver are struggling after a brief rally last week. I believe this is fear related to the Israel/Iran conflict. Metals should continue to move higher.
BTCUSD is slightly higher (forgot to cover BTCUSD in the video), but not moving into a breakaway phase.
Overall, everything is very flat in early trading today. It may stay that way with my PAUSE BAR pattern.
Get some.
#trading #research #investing #tradingalgos #tradingsignals #cycles #fibonacci #elliotwave #modelingsystems #stocks #bitcoin #btcusd #cryptos #spy #gold #nq #investing #trading #spytrading #spymarket #tradingmarket #stockmarket #silver

TSLA JUNE 20 2025 READ NOTESThis is momentum based price targeting & Tesla can easily do $390 but before that 342 is a solid resistance. From there we can get a dip and then price can continue the up move further
ANY NEWS IS TO BE AVOIDED
Now price action which is way superior is clearly suggesting the same up move.
I fact RSI is saying $400++ can come but it would be super dafe to exit around $390
If you nave any doubts then you can leave a comment.

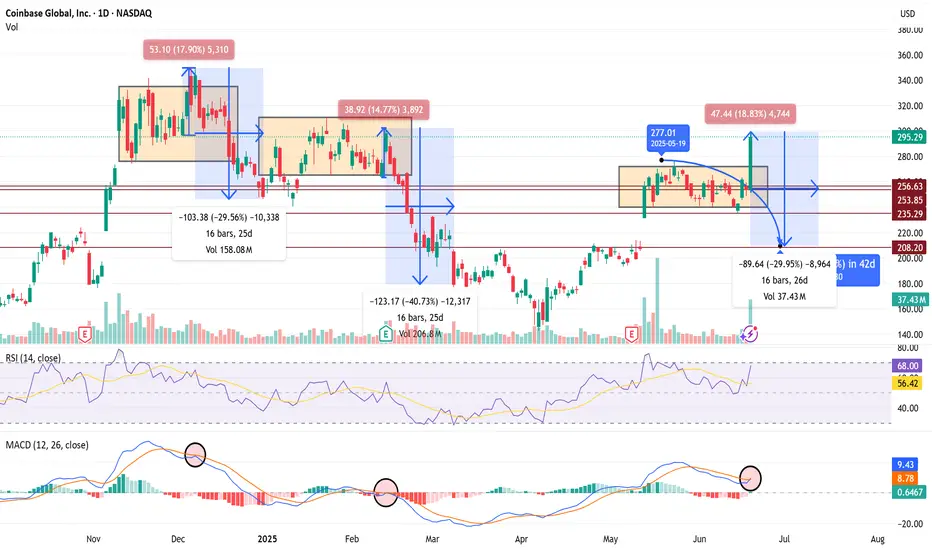
$COIN 30% Pullback Confirms if we Fakeout Recent 15%+ Rally 🧨 COIN SHORT TRADE IDEA — FAKEOUT TRAP IN PLAY
Ticker: NASDAQ:COIN
Date: June 20, 2025
Thesis: Breakout trap setup — expecting a rug pull / red reversal tomorrow to confirm.
🔍 Context
Price broke above range today with a big +18.8% candle to $295 — but...
Volume spike may signal exhaustion, not strength.
RSI = 68 → near overbought
MACD curling into a bearish cross — same signal preceded the last -30% and -40% drawdowns.
History: Same range-break setups in Dec and Feb collapsed hard (-30 to -40%) over 16–25 days.
💣 Trade Plan (Short Setup)
Entry Trigger:
🔻 Enter short if price closes below $277 tomorrow — confirms breakout trap.
Targets:
🎯 Target 1: $253 (top of old range)
🎯 Target 2: $235 (mid-range support)
🎯 Target 3: $208 (full breakdown move, matches last 2 cycles)
Stop Loss:
🛑 Above $297 (breakout highs)
Timeframe:
1–3 weeks (16–26 bars historically)
🧠 Bias
Bearish unless bulls hold $280+. If we get a big red daily candle tomorrow, fakeout confirmed — high-probability follow-through expected.
Spy chart for 6/25/25This and patience, it can change based on how we open for New York session but we will see

Nightly $SPY / $SPX Scenarios for June 20, 2025🔮 Nightly AMEX:SPY / SP:SPX Scenarios for June 20, 2025 🔮
🌍 Market-Moving News 🌍
🏦 Fed Holds Rates, Warns on Tariffs
Fed kept interest rates steady on June 19, cautioning that tariffs could stoke inflation and slow growth. Inflation projections were raised from 2.7% to 3.0%, while growth estimates were revised lower to 1.4%
🌍 Middle East Risk Drags Markets
Global stocks fell and safe-haven assets surged after U.S. futures weakened amid heightened tensions in the Israel–Iran conflict. Yields were mixed: gold weakened and bonds gained, while oil held steady near seven-week highs
📈 Treasury Yields Edge Higher
Despite safe-haven demand, U.S. 10‑year yields ticked up as markets absorbed the Fed’s updated rate outlook. The yield curve remains elevated ahead of next week’s $38 bn auction of long-dated notes
📊 Key Data Releases 📊
📅 Friday, June 20:
(No major U.S. economic reports)
Markets will be driven by Fed commentary follow-ups and geopolitical headlines over the weekend.
⚠️ Disclaimer:
This information is for educational and informational purposes only and should not be construed as financial advice. Always consult a licensed financial advisor before making investment decisions.
📌 #trading #stockmarket #economy #geopolitics #fixedincome #inflation #charting #technicalanalysis

SPY/QQQ Plan Your Trade For 6-19: GAP Reversal Counter TrendToday's pattern is a GAP Reversal in Counter Trend mode. I believe this could represent a breakdown in the ES/NQ as the US stock market is closed for the Juneteenth holiday.
Obviously, after the Fed comments yesterday (stating "uncertainty") and with the continued Israel/Iran conflict playing out, it makes sense to me that the US markets would move into a pre-weekend consolidation phase.
Even though the US stock market will be closed, the futures market will likely stay open and will carry some general market sentiment and reactions to news.
Watching Gold/Silver and Bitcoin should be very interesting today. I suspect the markets will continue to consolidate downward today - leading to a potential breakdown seeking support day on Friday.
Buckle up. We'll likely have 3-5+ days of news related to the Israel/Iran conflict and other issues over this weekend. It could be very interesting to see how the global markets move through this news.
Get some.
Happy Juneteenth
#trading #research #investing #tradingalgos #tradingsignals #cycles #fibonacci #elliotwave #modelingsystems #stocks #bitcoin #btcusd #cryptos #spy #gold #nq #investing #trading #spytrading #spymarket #tradingmarket #stockmarket #silver

$FTNT In a Wedging PatternI bought a ½ size position on June 2nd after it had tremendous volume and institutions protected it from slipping below the 50 DMA the day before. It has been nothing but sideways since and I am slightly underwater. My stop is a decisive close under the 50 DMA. I did not feel the Wed June 18th qualified as decisive.
Mark Minervini may call this a VCP (Volatility Contraction Pattern). In any event it is clearly in consolidation mode and could break either way. I will either be selling if it does not recover the 50 DMA or will be adding if / when it closes above the downward sloping upper trendline.
I thought this would be a good one for your watchlist. If you like the idea, please make it your own and follow “your” trading rules. Remember, it is your money at risk.

SPY where are we going into OPEX and last week of June tradingYesterday was almost an indecision candle on daily. Markets cheered the jobs data earlier in day with a nice green candle, however the pump faded going into FOMC, where AMEX:SPY and SP:SPX were around 600/ 6000 at 2pm. FOMC event mostly turned out to be a "non-event". While the no rate cut and 2 for 2025 were largely expected, Powell spooked the markets commenting that he expects higher inflation in months ahead due to tariffs. Off course this set of a set of comments from Trump which was expected as well.
While markets are closed today (Juneteenth) futures are open, and in after hours and now we have drifted downwards... as of this writing SPX is around 5950. Bulls lost the 9 sma yesterday and now are trying to defend the 20 sma. Tomorrow is OPEX so expect some volatility and movement to where big money is positioned.
Certainly bulls can show up and reclaim 9 ma at 6003 or if we lose 5950, the next level down is below 5800. Meanwhile JPM collar is intact... Do we go down from here. Tomorrow will be key as we will know if we have lost 20 sma or regained 9 sma and how this week candle looks like.
Bulls can charge but is there enough gas in tank to make meaningful upside move? Maybe possible pump to open next week (around 6060 was recent high), but bears are now lurking to take us down towards that 5800 level next week.
As I said earlier tomorrow will be telling and I will update over the weekend.

06/18/25 Trade Journal, and ES_F Stock Market analysis
EOD accountability report: +521.25
Sleep: 5 hours (bad sleep)
Overall health: My Ultrahuman Ring is saying I might be getting sick. 9 need to recover sleep and take care of body today and tmr. I think my lack of exercise this week is catching up to me.
**What was my initial plan? **
Looking at things premarket, things looked a bit weak as it was about sell off in the morning with bearish structure and DHC. Went in for a short at 1 min MOB but it didn't react and just broke thru, so flipped to bullish side and took it to the next resistance.
overall plan for the day was to look for chop zones to scalp b4 fomc, but that actually didnt happen until after fomc.
** VX Algo System Signals from (9:30am to 2pm)** 4/5
— 9:50 AM Market Structure flipped bullish on VX Algo X3! :check:
— 10:52 AM VXAlgo ES X1 Sell Signal :check:
— 12:10 PM VXAlgo ES X1 Buy signal (Double signal) :x:
— 12:11 PM Market Structure flipped bearish on VX Algo X3! :check:
— 1:40 PM VXAlgo ES X1 Buy signal (Double signal) :check:
Next day plan--> Above 6015 = Bullish, Under 6005= Bearish

PUT CALL GAVE A BUY SIGNAL TODAY I am looking for 6177/6183 The put/call model has given a buy signal that gives me a New record highsp500 and qqq how it has formed I am long calls at 50 % and 75 short OIL today best of trades WAVETIMER

Nightly $SPY / $SPX Scenarios for June 18, 2025🔮 Nightly AMEX:SPY / SP:SPX Scenarios for June 18, 2025 🔮
🌍 Market-Moving News 🌍
💼 Business Inventories Flat in April
U.S. business inventories held steady in April, indicating stable consumer and wholesale demand. That suggests production won't need to cut sharply in the near term, supporting GDP outlook
🏭 Industrial Production Slips
Industrial output declined 0.2% in May, signaling ongoing weakness in factory activity amid less favorable global trade conditions .
🌐 Geopolitical Pressures Persist
Heightened tension in the Middle East continues to pressure risk assets. Investors remain focused on safe-haven flows into gold, Treasuries, and defensive equities, with analysts noting the risk backdrop remains tilted to the downside
📊 Key Data Releases 📊
📅 Wednesday, June 18:
8:30 AM ET – Housing Starts & Building Permits (May)
Measures new residential construction — leading indication of housing sector health.
8:30 AM ET – Initial Jobless Claims
Tracks the weekly count of new unemployment filings — useful for spotting early labor-market weakening.
2:00 PM ET – FOMC Interest Rate Decision
The Federal Reserve is expected to hold steady. Market focus will be on any commentary that hints at future tightening or easing plans.
2:30 PM ET – Fed Chair Powell Press Conference
Investors will parse Powell’s remarks for guidance on rate paths, inflation trends, and economic risks.
⚠️ Disclaimer:
This is for educational/informational purposes only and does not constitute financial advice. Consult a licensed advisor before making investment decisions.
📌 #trading #stockmarket #economy #housing #Fed #geo_risk #charting #technicalanalysis

06/17/25 Trade Journal, and ES_F Stock Market analysisEOD accountability report: +1,337.50
Sleep: 9 hours
Overall health: Good, was averaging 40k steps the week before, now around 20k avg,
need to get it up to 25k steps min per week.
**What was my initial plan? **
Went into the market pretty neutral today with the mindset that it should be the calm before storm (fomc tomorrow), There was a string defense of 1 min MOB in the morning and that gave me the belief that early part of the day was going to be bullish so i took a few stabs at support and made my money.
** VX Algo System Signals from (9:30am to 2pm)** 4/4
— 9:34 AM Market Structure flipped bullish on VX Algo X3! :check:
— 10:30 AM VXAlgo ES X1 Sell Signal (double signal) :check:
— 11:36 AM VXAlgo ES X3 Sell Signal (double signal) :check:
— 1:00 PM Market Structure flipped bearish on VX Algo X3! :check:
Next day plan--> Above 6015 = Bullish, Under 6005= Bearish
Video Recaps -->https://www.tradingview.com/u/WallSt007/#published-charts

$TLT Rising Channel or Bear Flag?Is it time to invest in NASDAQ:TLT ? It looks positive to me. With inflation cooling down it looks like bond prices could increase, which means rates are lower. We do have a Fed Meeting coming up so there could be more volatility depending on the “Feds” messaging.
I am taking this long today with a ½ size position. I will place my stop just “below” yesterdays low of $85.46. I am going long because I see a series of higher lows and higher highs. And I have a well-defined risk level of about 1% to know if I am wrong.
If you like this idea, please make it your own. Make sure you follow your trading plan.

SPY/QQQ Plan Your Trade for 6-17: Top Resistance PatternToday's pattern suggests the SPY/QQQ will move into a type of topping pattern, attempting to identify resistance, then roll away from that resistance level and trend downward.
I suggest the news related to the conflict between Israel & Iran may continue to drive market trends with traders moving away from uncertainty near these recent highs.
Silver makes a big move higher. Gold will likely follow later this week or early next week.
BTCUSD moves into a sideways FLAGGING pattern - possibly attempting a BIG BREAKDOWN event over the next few weeks.
Overall, the markets look like they are poised for a very big move - just waiting for the GREEN LINK (GO).
Stay safe. Protect capital and HEDGE.
Get some.
#trading #research #investing #tradingalgos #tradingsignals #cycles #fibonacci #elliotwave #modelingsystems #stocks #bitcoin #btcusd #cryptos #spy #gold #nq #investing #trading #spytrading #spymarket #tradingmarket #stockmarket #silver

Nightly $SPY / $SPX Scenarios for June 17, 2025🔮 Nightly AMEX:SPY / SP:SPX Scenarios for June 17, 2025 🔮
🌍 Market-Moving News 🌍
📈 U.S. Retail Spending Holds Firm
May’s retail sales were flat month-over-month, defying expectations of a slowdown. Core retail sales (ex-autos) edged up +0.2%, signaling resilience in consumer purchases—an encouraging sign for economic momentum
🤖 Tesla’s Robotaxi Buzz Accelerates
Tesla stock surged after a weekend robotaxi video surfaced ahead of its planned Austin launch. A viral clip showed a Model Y “robotaxi” navigating traffic autonomously, sparking fresh investor enthusiasm despite safety debates
📊 BoJ Holds Rates; Dollar Edges Higher
Japan’s central bank left policy unchanged at 0.5%, maintaining its dovish bias. This lifted the dollar slightly versus the yen, drawing focus to global interest-rate divergence
📊 Key Data Releases 📊
📅 Tuesday, June 17:
8:30 AM ET – Retail Sales (May)
Consumer purchases are tracked, excluding autos. Monitor if activity stays steady despite inflation and rate pressures.
9:15 AM ET – Industrial Production & Capacity Utilization (May)
Provides insight into factory activity and plant usage—a gauge of economic health amid global slowdown concerns.
10:00 AM ET – Business Inventories (April)
Shows stock levels held by wholesalers and manufacturers. Higher inventories with weaker sales may signal slowing demand.
⚠️ Disclaimer:
This information is for educational and informational purposes only and should not be construed as financial advice. Always consult a licensed financial advisor before making investment decisions.
📌 #trading #stockmarket #economy #news #trendtao #charting #technicalanalysis

SPY & MegaCap strengthSPY saw a very strong gap up, negating most of the selling from last week.
despite rising tensions in the middle east - investors have shrugged off volatility and bought the initial dip.
This may be proving that "war" is good for stocks.
we observed a very close correlation between the indices and oil today.
As oil reversed higher - markets saw a bit of weakness. As oil fell markets rallied.
TSLA trying to break a 4 hour bullish pattern
META new Smart Glasses release causing a surge.
MSFT new all time high tap
NVDA firm with ripping semiconductors
GOOGL looking strong for continuation
AMZN moving nicely off support
AAPL lagging the mega's but positive

06/16/25 Trade Journal, and ES_F Stock Market analysisEOD accountability report: +450
Sleep: 7 hours
Overall health: Good
What was my initial plan? I knew today was contract rollovers and decided not to trade it, but after noticing that the x1 signals were working pretty good today, i decided to take some plays at the soft support and resistances.
**Daily Trade recap based on VX Algo System from (9:30am to 2pm)**
Lot of X7 buy signals (usual signal that market is bullish)
— 10:40 AM VXAlgo ES X1 Sell Signal (triple signal)
— 11:56 AM VXAlgo ES X3 Sell Signal
— 12:30 PM Market Structure flipped bearish on VX Algo X3!
— 1:20 PM VXAlgo ES X1 Buy signal
Next day plan--> Above 6010 = Bullish, Under 5965= Bearish
Video Recaps -->https://www.tradingview.com/u/WallSt007/#published-charts

Wave 5 up in a Diagonal could be hours away The chart posted is the sp 500 futures back in april 10 th I labeled the low at 5102 as wave B or 2 both called for sharp rally to as high as 6147 in which wave 1 or a x 1.168 = 3 or c for a wave B top . since then I saw the high at 5968 as the end of wave 3 top and then looked for a drop back to 5669 we saw 5667 and so far all rallies have taken a 3 wave formation in which Most but Not all times this is occurring in an ending diagonal and in each wave we saw so far .887 the preceding wave . I have traded in and out and I am waiting for a final push up to 6083/6147 midpoint 6100 to take a short position . The alt is a small series of 4/5 4/5 4/5 if this were the count we would then break ABOVE 6147 and then reach 6330 . I am waiting to confirm .Best of trades WAVETIMER

SPY/QQQ Plan Your Trade For 6-16 : Up-Down-Up PatternToday's Up-Down-Up Pattern suggests the markets will transition into a moderate upward trending price bar - which is quite interesting in the world we have today.
War and a big weekend of events, protests and other new items could drive market trends over the next few days.
Still, the SPY Cycle Pattern for today is an Up-Down-Up - which suggests last Thursday was an Up bar, last Friday was a Down bar, and today should be an Up bar.
The Gold/Silver pattern is a POP pattern in Counter-trend.
I believe the US markets are benefiting as a safe-haven for capital as the global turmoil drives global investors to seek safety and security for their capital.
That means as long as the world continues to spin out of control, the US markets and the US-Dollar will act as a moderate safe-haven for capital.
Gold and Silver should also benefit from this global chaos.
Bitcoin is benefiting from the strength of the US markets (and the technology sector) as well.
Let's see how this week start to play out. I'm waiting for some more news.
Could be very interesting this week.
Get some.
#trading #research #investing #tradingalgos #tradingsignals #cycles #fibonacci #elliotwave #modelingsystems #stocks #bitcoin #btcusd #cryptos #spy #gold #nq #investing #trading #spytrading #spymarket #tradingmarket #stockmarket #silver

Weekly $SPY / $SPX Scenarios for June 16–20, 2025 🔮 Weekly AMEX:SPY / SP:SPX Scenarios for June 16–20, 2025 🔮
🌍 Market-Moving News 🌍
🏦 Fed Holds Rates, Powell Expresses Caution
The Federal Reserve is widely expected to keep rates at 4.25–4.50%, though Chair Powell likely won’t provide fresh guidance. Markets see limited upside without stronger inflation or growth cues
💱 Dollar Strengthens on Geopolitical Risk
The U.S. dollar rose slightly as investors flocked to safe assets amid global tensions with Iran. Treasury yields eased slightly on risk-off flows
🛢️ Oil Near Multi-Week Highs on Mideast & OPEC Dynamics
Oil held near seven-week highs (~$67–70/barrel), buoyed by Iran-Israel tensions and OPEC+ output hikes (411K bpd added from May–July), offset by demand concerns .
⚠️ G7 Summit Faces Heightened Stakes
G7 finance ministers meet in Canada under pressure from Middle East escalation. Watch for policy coordination and commentary on trade, inflation, and global economic risks .
📊 Key Data Releases & Events 📊
📅 Monday, June 16
Regular markets open after Juneteenth holiday
Quiet day; oil & geopolitical headlines dominate
📅 Tuesday, June 17
8:30 AM ET – Retail Sales (May): Signals consumer spending strength/duration
8:30 AM ET – CPI (May): Confirms inflation trend post-CPI cooler reading
10:00 AM ET – Housing Starts & Building Permits (May): Gauges housing market demand
Unexpected Tesla Robotaxi Demo (Austin): Watch for surprise developments this week
📅 Wednesday, June 18
Global Central Bank Day: FOMC, BoE, BoJ policy updates; U.S. Fed will most likely hold steady
📅 Thursday, June 19 – Juneteenth Holiday – U.S. markets closed
📅 Friday, June 20
8:30 AM ET – Existing Home Sales (May): Measures U.S. housing activity
10:00 AM ET – Leading Economic Indicators (May): Early snapshot of economic momentum
⚠️ Disclaimer:
This information is for educational and informational purposes only and should not be construed as financial advice. Always consult a licensed financial advisor before making investment decisions.
📌 #trading #stockmarket #economy #news #trendtao #charting #technicalanalysis

Buy OIL & GOLD, Sell Stocks Indices When Missiles Are Flying!In this Weekly Market Forecast, we will analyze the S&P 500, NASDAQ, DOW JONES, Gold and Silver futures, for the week of June 16-20th.
When missiles start flying in the Middle East, investors become reactively risk averse. Money goes from stocks to safe havens and oil. That's it. Expect oil prices to rise, Gold to reach new highs, and the equity markets to see more sellers than buyers.
This environment may last a few days or a few weeks. Keep an ear to the news.
Enjoy!
May profits be upon you.
Leave any questions or comments in the comment section.
I appreciate any feedback from my viewers!
Like and/or subscribe if you want more accurate analysis.
Thank you so much!
Disclaimer:
I do not provide personal investment advice and I am not a qualified licensed investment advisor.
All information found here, including any ideas, opinions, views, predictions, forecasts, commentaries, suggestions, expressed or implied herein, are for informational, entertainment or educational purposes only and should not be construed as personal investment advice. While the information provided is believed to be accurate, it may include errors or inaccuracies.
I will not and cannot be held liable for any actions you take as a result of anything you read here.
Conduct your own due diligence, or consult a licensed financial advisor or broker before making any and all investment decisions. Any investments, trades, speculations, or decisions made on the basis of any information found on this channel, expressed or implied herein, are committed at your own risk, financial or otherwise.

Stock Market Forecast | TSLA NVDA AAPL AMZN META MSFTStock Market Forecast | CME_MINI:NQ1! CME_MINI:ES1! SPY QQQ
Mag 7 Forecast | NASDAQ:TSLA NVDA AAPL AMZN META MSFT GOOG
