SPY: Expecting Bullish Movement! Here is Why:
The analysis of the SPY chart clearly shows us that the pair is finally about to go up due to the rising pressure from the buyers.
Disclosure: I am part of Trade Nation's Influencer program and receive a monthly fee for using their TradingView charts in my analysis.
❤️ Please, support our work with like & comment! ❤️
Spy!

SPY (S&P500) - Price Testing Support Trendline - Daily ChartSPY (S&P500 ETF) price has just closed below $600 and is currently under a support trendline.
If price cannot breakout above the $600 and $605 resistance level this month, a pullback could occur down to the support zone.
SPY price could potentially pullback to various levels of support due to:
-USA domestic conflict
-International military conflicts
-Technical chart bearish divergence
-USA federal reserve interest rate news
-Government and corporate news
Support Levels: $595, $590, $585, $580.
Resistance Levels: $600, $605, $610, $615.
The 50EMA/200EMA Golden Cross is still on-going, and support prices of $580 and $568 have yet to be tested significantly.

06/13/25 Trade Journal, and ES_F Stock Market analysisEOD accountability report: +3825
Sleep: 5.5 hours (sleep is declining, will spend the weekend catching up)
Overall health: Good
What was my initial plan? I wanted to short 6016-6020 area in the morning but we didn't open up to that, so i just sat on sideline until we hit the 6025 , took a big short there and paid off really well.
Daily Trade recap based on VX Algo System from (9:30am to 2pm)
— 9:30 AM Market Structure flipped bearish on VX Algo X3!
— 10:30 AM Market Structure flipped bearish on VX Algo X3!
— 10:40 AM VXAlgo YM X1 Buy Signal
— 11:30 AM Market Structure flipped bullish on VX Algo X3!
— 12:21 PM VXAlgo ES X1 Sell Signal (double signal)
— 1:12 PM VXAlgo NQ X3 Sell Signal
— 1:30 PM Market Structure flipped bearish on VX Algo X3!
Next day plan--> Above 6010 = Bullish, Under 5965= Bearish
Video Recaps -->https://www.tradingview.com/u/WallSt007/#published-charts

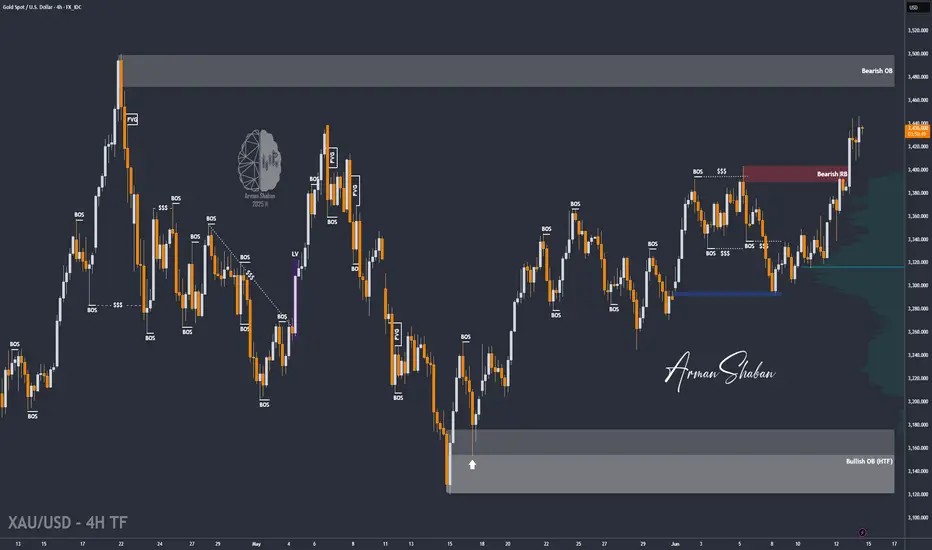
Gold Breaks $3400 – Targets $3500 Amid Tensions (READ)By analyzing the gold chart on the lower timeframe, we can see that today, following Israel's missile and airstrike attacks on Iran, gold experienced a sharp rally. As anticipated last night, gold finally managed to break through the strong $3400 resistance, surging over 600 pips to reach $3447.
Currently, gold is trading around $3438, and given the escalation in geopolitical tensions, I expect further upside movement.
The next potential targets are $3449, $3469, and possibly $3500.
⚠️ Due to ongoing conflict and extreme volatility, it's advised to avoid trading or proceed only with minimal risk exposure.
Please support me with your likes and comments to motivate me to share more analysis with you and share your opinion about the possible trend of this chart with me !
Best Regards , Arman Shaban
SPY/QQQ Plan Your Trade For 6-13 : Harami-Inside PatternToday's pattern suggests the markets may stall into a sideways price range.
After the news of Israel targeting Iran in a preemptive strike late yesterday afternoon, the markets moved dramatically lower while Gold & Silver moved higher on the news.
I, personally, see this market trend as a shift in thinking ahead of a long Father's Day weekend.
I see traders trying to position their accounts/trades for uncertainty.
I believe we could see a bit of a shift today - particularly in Metals and the QQQ/NASDAQ/BTCUSD.
Overall, I strongly suggest traders prepare for extreme volatility this weekend as any further news of a counter-strike or further military action in the Middle East could roil the markets.
Happy Friday the 13th - everyone.
Going to be an interesting day to say the least.
Get some.
#trading #research #investing #tradingalgos #tradingsignals #cycles #fibonacci #elliotwave #modelingsystems #stocks #bitcoin #btcusd #cryptos #spy #gold #nq #investing #trading #spytrading #spymarket #tradingmarket #stockmarket #silver

06/12/25 Trade Journal, and ES_F Stock Market analysisEOD accountability report: +437.50
Sleep: 6.5 hours
Overall health: Good
What was my initial plan?
market pumped heavily due to ppi data so I decided today was another oe of those days where you wait on the sideline for a better move.
1. until major levels are hit.
2. or a signal occur.
**Daily Trade recap based on VX Algo System from (9:30am to 2pm)**
10:57 AM VXAlgo ES X1 Sell Signal
2:00 PM VXAlgo NQ X3 Sell Signal
Next day plan--> Above 6010 = Bullish, Under 5950= Bearish
Video Recaps -->https://www.tradingview.com/u/WallSt007/#published-charts

Nightly $SPY / $SPX Scenarios for June 13, 2025 🔮 Nightly AMEX:SPY / SP:SPX Scenarios for June 13, 2025 🔮
🌍 Market-Moving News 🌍
🚨 Israel Strikes Iran — U.S. Markets Sell Off
Israel launched airstrikes on Iran’s nuclear and military facilities, triggering a sharp risk-off move in global markets. U.S. stock futures slid over 1%, driven by a drop in equities and a surge in safe-haven assets
🛢️ Oil Prices Surge 7–8% on Supply Fears
Brent crude jumped over 7%, reaching ~$74.65/barrel, while WTI rose nearly 8%—the strongest move since early May. The sudden energy-price spike reflects heightened fears of supply disruptions in the Middle East
💱 Dollar & Safe Havens Climb
True to form, the U.S. dollar, Japanese yen, Swiss franc, gold, and Treasuries rallied as investors moved to the safety of low-risk assets amid escalating geopolitical uncertainty
📊 Key Data Releases 📊
📅 Friday, June 13
(No scheduled U.S. economic data)
Data flow will take a backseat as markets digest geopolitical developments and await the weekend.
⚠️ Disclaimer:
This information is for educational and informational purposes only and should not be construed as financial advice. Always consult a licensed financial advisor before making investment decisions.
📌 #trading #stockmarket #geopolitics #oil #safety #charting #technicalanalysis

Volatility Incoming - But Price Will Say WhenKey levels on SPX and NDX
5905 big gamma level and hedging level for June 30 monthly and quarter expiration
DXY watching for potential bear trap and range trade
Gold, Silver, Bitcoin and others all discussed
Thanks for watching!!!

Small Stocks vs. GoldThis index represents small caps minus big caps, divided by gold. A good representation of how small companies in USA are doing related to gold (hard asset). You could argue that this is more representing of real economy and it's health.

Bulls and Bears zone for 06-12-2025Overall market is continuing to rally in general.
However, market sold off during ETH session and it's trying to recover in the morning.
Level to watch : 6017----6019

SPY/QQQ Plan Your Trade For 6-12: BaseRally In Trend ModeToday's pattern suggests the markets may attempt to identify a base and move higher (rally) off that base level.
Given the overnight price activity, I suggest the process of identifying the base level could prompt a deeper early decline in price - possibly attempting to retest 595-597 lows before finding support and attempting to rally.
As I've been warning over the past few weeks/months, I'm still seeing the Excess Phase Peak pattern playing out as a Flag Termination - rolling into a downtrend and attempting to move back towards the $480 lows as a real possibility. I've been warning and watching for the breakdown in trend - but we've not seen it yet.
Thus, we are still BULLISH until we get a confirmation of a solid breakdown. That would be a move below the 580-585 level at this point. We need to see some type of solid breakdown in price, breaking away from the FLAG setup and moving downward, before I could confidently suggest the Flag Breakdown has happened.
Gold and Silver are making a big move higher. Gold is finally starting to move back above $3400 and I believe watching Silver, Gold, & Platinum rally suggests FEAR is elevating as we move into the end of June.
I still believe Gold has a chance to rally above $4k before the end of June. We'll see if it happens.
BTCUSD is moving into a DUAL-EPP pattern. This is very interesting. Watch the video as I highlight why this could prompt a dual-stage EPP breakdown in Bitcoin over the next 20 to 50+ days.
Get some.
#trading #research #investing #tradingalgos #tradingsignals #cycles #fibonacci #elliotwave #modelingsystems #stocks #bitcoin #btcusd #cryptos #spy #gold #nq #investing #trading #spytrading #spymarket #tradingmarket #stockmarket #silver

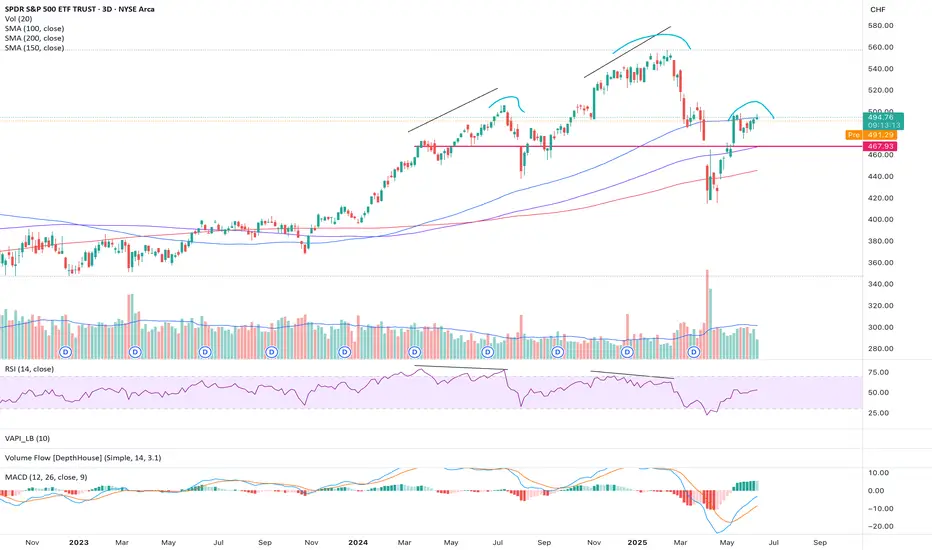
SP500 in CHF terms, bearish outlook- checking the SP500 in USD seems misleading these days
- therefore I checked it with CHF and earlier movements made more sense
- RSI bearish divergences were followed in earlier periods
- now we have a potential head and shoulders formation
- seems more likely to head south
Nightly $SPY / $SPX Scenarios for June 12, 2025🔮 Nightly AMEX:SPY / SP:SPX Scenarios for June 12, 2025 🔮
🌍 Market-Moving News 🌍
💱 Dollar Slides on Trade Truce Hopes & Fed Outlook
The U.S. dollar dropped 0.4%—its lowest level since April 22—after President Trump signaled flexibility on a July 8 trade deadline and U.S.–China talks showed renewed progress, boosting expectations for Fed rate cuts
📊 S&P Shiller CAPE Hints at Overvaluation Risk
Stocks and bonds rallied following rebound, but valuation metrics flash caution: the S&P 500 now sits in the 94th percentile of Shiller CAPE, and equity risk premium has dropped to zero. Analysts warn these levels often precede corrections
🛢️ Oil Holds at Seven-Week Highs
Oil prices remain near seven-week highs (~$66–67/barrel), supported by gradual OPEC+ output increases and hopes that easing trade tensions will aid demand
📈 CPI Cools Again, Bonds Climb
U.S. consumer inflation rose just 0.1% in May (2.4% YoY), easing expectations for tighter Fed policy. Consequently, Treasury yields softened and bond markets outperformed equities
📊 Key Data Releases 📊
📅 Thursday, June 12:
8:30 AM ET – Producer Price Index (May)
An early gauge of inflation at the wholesale level—may reinforce the cooling trend seen in CPI.
8:30 AM ET – Initial & Continuing Jobless Claims
Weekly updates on unemployment filings. Key to monitor for labor-market tightening or softening.
⚠️ Disclaimer:
This report is for educational and informational purposes only—it does not constitute financial advice. Always consult a licensed financial advisor before making investment decisions.
📌 #trading #stockmarket #economy #news #trendtao #charting #technicalanalysis

SPY SHORT FROM RESISTANCE|
✅SPY went up to retest
A horizontal resistance of 610$
Which is also an All-Time-High
So its a very strong level
Which makes me locally bearish biased
And I think that we will see a pullback
And a move down from the level
Towards the target below at 596.43$
SHORT🔥
✅Like and subscribe to never miss a new idea!✅
Disclosure: I am part of Trade Nation's Influencer program and receive a monthly fee for using their TradingView charts in my analysis.

06/11/25 Trade Journal, and ES_F Stock Market analysis
EOD accountability report: +1200
Sleep: 7 hours
Overall health: Good
What was my initial plan?
Did not wanted to trade the market today unless we had multiple signals and confirmations because CPI data had already moved the market so much.
Daily Trade recap based on VX Algo System from (9:30am to 2pm)
— 10:00 AM Market Structure flipped bearish on VX Algo X3!
— 10:00 AM VXAlgo NQ X1 Buy Signal,
— 10:30 AM Market Structure flipped bullish on VX Algo X3!
— 11:08 AM VXAlgo ES X1 Sell Signal (double signal)
— 11:48 AM VXAlgo ES X3 Sell Signal
— 12:00 PM Market Structure flipped bearish on VX Algo X3!
— 12:30 PM VXAlgo ES X1 Buy signal (double signal)
— 1:35 PM Market Structure flipped bullish on VX Algo X3!
Next day plan--> Above 6000 = Bullish, Under 5990 = Bearish
Video Recaps -->https://www.tradingview.com/u/WallSt007/#published-charts

ES Futures Play – Long Bias Despite MACD Caution (June 11, 2025)📈 ES Futures Play – Long Bias Despite MACD Caution (June 11, 2025)
Ticker: NYSE:ES | Bias: ✅ Moderately Bullish
Setup Time: Market Open | Confidence: 65%
🔍 AI Model Consensus Breakdown
📍 Price: ~6,027.25
📊 Trend: Above 20-, 50-, and 200-day MAs
📈 RSI: 64.25 – bullish but nearing overbought
📉 MACD: Bearish crossover → possible short-term pullback
📎 Bollinger Band: Price near upper band – may act as resistance
✅ Majority Long Bias (3 of 4 Models Agree)
Grok/xAI, Llama/Meta, Gemini/Google:
• Solid technical structure (higher highs/lows)
• High open interest and positive momentum
• Slight MACD concern, but bullish setup intact
• R:R ≈ 1.5:1 with upside target in 6,100 area
⚠️ Contrarian View – DeepSeek:
• Warns of overextension after a 30-day rally
• Suggests bearish MACD could drive pullback
• Recommends short targeting 5,930
📌 Recommended Trade Setup
🎯 Direction: LONG
📥 Entry: 6,027.25 (at market open)
🛑 Stop Loss: 5,980.00 (below short-term support)
🎯 Take Profit: 6,098.00 (R:R ≈ 1.5:1)
📊 Size: 1 contract
📈 Confidence: 65%
⚠️ Risk Watch
• 📉 MACD crossover = potential short-term weakness
• 🧊 Near upper Bollinger Band = possible resistance
• 💨 Volatility at open can cause whipsaw → manage risk strictly
• 🌐 Monitor news/macro events for any directional shift
📣 Are you taking the NYSE:ES long today or fading it like DeepSeek?
Drop your view ⬇️ | Follow for more AI-powered market setups.

COMPLETED 5 of 3 or C RSI bearish Non confirmation The chart is now labeled as COMPLETED . Please also take note of The HUGE difference in QQQ to QQQE and SPY to RSP . Best of trades Wavetimer 115 % short

SPY/QQQ Plan Your Trade For 6-11: Bottom-Base Rally Counter TrndToday's counter-trend Bottom-Base Rally pattern suggests the markets may attempt to find a peak and roll over into a downtrend.
The normal Bottom-Base Rally pattern is similar to the start of a moderate price base/bottom, then moving into a moderate rally phase.
In counter-trend mode this pattern would be inverted - forming a Top and then moving into a downward price trend.
I've been warning of the potential of a rollover top type of pattern in the SPY over the past few weeks - but it never really setup/confirmed.
I'll be curious to see if this counter-trend pattern, today, sets up some type of big top formation in the SPY/QQQ. It might be related to news as well.
Gold and Silver have a Gap-Stall-Revert-FLUSH pattern. This is always an interesting pattern because is suggests price is going to attempt to either gap and trend or stall and revert. My guess is we are looking at more trending in metals today.
Platinum is RIPPING higher (PL1!). Because of this, I believe Silver and Gold will attempt to follow Platinum and move to the upside today.
BTCUSD is stalling a bit. We'll see if we get any big price move in Bitcoin today. After the big rally over the past few days, it will be interesting to see if BTCUSD reverts downward or continues higher.
Overall, today's patterns suggest the markets are seeking direction. Get ready for an exciting day in the markets.
Get some.
#trading #research #investing #tradingalgos #tradingsignals #cycles #fibonacci #elliotwave #modelingsystems #stocks #bitcoin #btcusd #cryptos #spy #gold #nq #investing #trading #spytrading #spymarket #tradingmarket #stockmarket #silver

SHORT ON SPY (SPX/USD)SPY has failed to create higher highs and given us a head and shoulders pattern.
I will be selling spy to the next level of demand looking to catch 50-60 points.

Nightly $SPY / $SPX Scenarios for June 11, 2025🔮 Nightly AMEX:SPY / SP:SPX Scenarios for June 11, 2025 🔮
🌍 Market-Moving News 🌍
🤝 Cautious Optimism on U.S.–China Trade Progress
Markets responded positively to fresh developments in ongoing U.S.–China trade talks, with S&P 500 and Nasdaq closing ~0.6% higher — the third straight day of gains — on hopes of easing trade barriers
📉 Treasury Yields Climb as Auction Approaches
Bond investors grew cautious ahead of a key Treasury debt auction and incoming U.S. inflation data. The 10-year yield stayed elevated, weighing modestly on equities .
💹 Global Markets Showing Resilience
Asian and European markets tracked U.S. gains midweek, driven by trade-talk optimism, despite lingering concerns over slower global growth and debt levels .
📊 Key Data Releases 📊
📅 Wednesday, June 11:
(No major U.S. releases — focus remains on market reactions to trade talks and Treasury auctions.)
⚠️ Disclaimer:
This information is for educational and informational purposes only and should not be construed as financial advice. Always consult a licensed financial advisor before making investment decisions.
📌 #trading #stockmarket #economy #news #trendtao #charting #technicalanalysis


06/10/25 Trade Journal, and ES_F Market analysisEOD accountability report: +2575
Sleep: 9 hours
Overall health: Good
What was my initial plan?
I was neutral going into market open, I expected market to pullback a bit if we had lost 6016 but it never truly got lost.
remained neutral and just watched my levels of 6028 and 6045.
**Daily Trade recap based on VX Algo System from (9:30am to 2pm)**
— 9:30 AM Market Structure flipped bearish on VX Algo X3!
— 10:00 AM VXAlgo YM X3 Sell Signal
— 10:58 AM VXAlgo ES X1 Sell Signal
— 11:32 AM VXAlgo ES X3 Sell Signal (triple sell x3) B+ set up
— 12:00 PM Market Structure flipped bearish on VX Algo X3!
1:03 PM VXAlgo ES X1 Sell Signal
— 1:20 PM VXAlgo ES X1 Sell Signal
Next day plan--> Above 6000 = Bullish, Under 5990 = Bearish
Video Recaps -->https://www.tradingview.com/u/WallSt007/#published-charts

SPY/QQQ Plan Your Trade For 6-10 : POP PatternToday's POP pattern suggests a potential big price move will take place. Given the overnight activity on the ES (rallying higher then rolling over), I suggest today's price move may attempt to retest these overnight highs, then repeat the breakdown phase into the close.
The markets continue to try to melt upward. This trend will continue until the markets decide to break downward.
After the deep low created by the tariff news, the markets continue to try to rally to new highs. It is very likely that Q2 earnings data may push the SPY to new ATH levels before we see any big rotation in price.
The markets have a tendency to move just above recent highs, then stall and revert downward as a pullback. This move may be no different.
The continued stalling of price trying to move higher recently suggests the markets are running into moderate resistance and I believe traders are actively pulling capital away from this rally.
The trend is still BULLISH. Stay cautious of this upward move as a breakdown could happen at any time.
Gold and Silver are moving into an impressive rally phase. Silver and Platinum have moved considerably higher over the past 10+ days. I believe Gold is lagging and will make a big move higher over the next 5 to 10+ days.
Silver is targeting $41-44+. Gold should target $3400 to $3500+ near the same time.
Bitcoin made a huge rally yesterday - reaching my 110,500 upper resistance level. Now, we see if Bitcoin has the momentum to carry higher or if it will fail and rollover into a downtrend.
It seems we are right as a MAKE or BREAK level in the markets. I'm still a believer of MELT UP until it fails.
I continue to watch for technical failure - but I've not seen it happen yet.
Get some.
#trading #research #investing #tradingalgos #tradingsignals #cycles #fibonacci #elliotwave #modelingsystems #stocks #bitcoin #btcusd #cryptos #spy #gold #nq #investing #trading #spytrading #spymarket #tradingmarket #stockmarket #silver
