SPY/QQQ Plan Your Trade For 5-15 : CRUSH PatternToday's CRUSH pattern could play out as a very big downward price move if the 578-580 level is broken. CRUSH patterns are usually very large-range price bars. Yes, they can be to the upside as well (depending on recent trending).
A CRUSH pattern is usually in the opposite direction of recent trends. Thus, I believe today's CRUSH pattern will be to the downside.
Although I believe today could be very exciting for traders, I urge all traders move with caution in the early 30min to 60min of trading today. I believe the SPY/QQQ will attempt to establish a range (early trading range), then work to break away from that range.
Traders should be very cautious of getting married into a direction/position in early trading. Let the market tell you where it wants to go.
Gold and Silver appear to have setup the Ultimate Low overnight. Now, we'll see if metals can move higher throughout the rest of this week and build a base for the next phase higher.
BTCUSD seems to have started to roll over (top), but I urge traders to stay cautious of the current upward FLAGGING trend. Until BTCUSD breaks below $96-97k, I would still consider it to be trending upward.
Going to be a busy day for me. Stay safe as I'll be on the road most of the morning.
GET SOME.
#trading #research #investing #tradingalgos #tradingsignals #cycles #fibonacci #elliotwave #modelingsystems #stocks #bitcoin #btcusd #cryptos #spy #gold #nq #investing #trading #spytrading #spymarket #tradingmarket #stockmarket #silver
SPDR S&P 500 ETF (SPY)

Gold Market Update: Bears will target 3150 USD🏆 Gold Market Mid-Term Update
📉 Gold Drops: Prices dip as risk appetite grows and profit-taking kicks in.
🤝 U.S.-China Deal: 90-day tariff pause boosts USD, pressures gold.
📊 Tech Watch: Key support levels eyed by traders for entry points.
🔮 EUROTLX:4K Forecast?: Analysts still see path to $4,000 amid uncertainty.
⚠️ Recession Signal: Oil-gold gap hints at slowdown—bullish for gold.
🏠 Investment Shift: Gold now 2nd-best long-term U.S. investment (after real estate).
🌍 BRICS Buying: Emerging nations hoard gold to ditch dollar.
🛡️ $3,200 Holds: Gold maintains key support despite volatility.
📈 JP Morgan Bullish: EUROTLX:4K gold possible even with growth.
💰 Live Price: Gold at $3,253.40 (+0.52%) today.
📊 Technical Outlook Update
🏆 Bull Market Overview
▪️pullback in progress still
▪️3300 USD cleared by the BEARS
▪️market gapped down at open
▪️3300 is heavy resistance for now
▪️Compression on lower timeframes
▪️Flag on Flag Bearish pattern
▪️short-term expecting more losses
⭐️Recommended strategy
▪️Short Sell Rips/Rallies
▪️TP Bears 3150 USD

May 14th Trade Journal & Stock Market AnalysisEOD accountability report: +452
Sleep: 6 hour, Overall health: 👍
Been super chillax, having some great trading days 😄
Daily Trade recap based on VX Algo System
9:30 AM Market Structure flipped bearish on VX Algo X3!
10:37 AM SMH/Chip Stock Sell Signal X10
1:00 PM Market Structure flipped bearish on VX Algo X3!
2:34 PM Market Structure flipped bullish on VX Algo X3!
3:01 PM VXAlgo YM X1 Sell Signal
3:30 PM Market Structure flipped bearish on VX Algo X3!
Next day plan--> Under 5875 = Bearish with X7 sell signal, Over 5900 = Clearly bullish breakout
Video Recaps -->https://www.tradingview.com/u/WallSt007/#published-charts

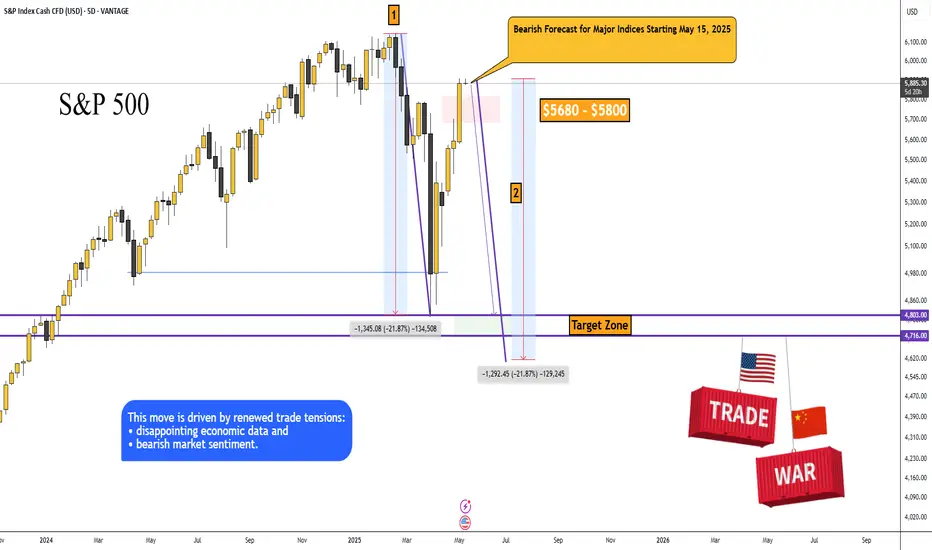
SP500: Bearish Forecast for Major Indices Starting May 15, 2025Bearish Forecast for Major Indices Starting May 15, 2025
The S&P 500, Dow Jones, Nikkei 225, and other major indices are poised to begin a significant decline, potentially as early as today, May 15, 2025, targeting a retest of the price lows from April 7, 2025, and possibly lower (S&P 500: ~4,802.20, Dow Jones: ~36,611.78, Nikkei: ~30,340.50).
This movement is driven by renewed trade tensions, disappointing economic data, and pervasive bearish market sentiment.
1. Fundamental Factors Driving Potential Decline
1.1. Renewed Uncertainty in Trade Policy
· The rally in indices on May 12–13, 2025, was fueled by optimism surrounding a temporary U.S.-China tariff reduction agreement (a 90-day truce) announced after talks in Switzerland on May 11, 2025. However, as of May 15, 2025, investor confidence may be waning due to a lack of tangible progress in ongoing U.S.-China trade negotiations.
Trigger for May 15: Recent reports highlight conflicting statements from the Trump administration, with earlier promises of new trade deals (e.g., a U.K. deal on May 8) followed by uncertainty. A Reuters report from May 14, 2025, notes that U.S. Trade Representative Jamieson Greer and Treasury Secretary Scott Bessent are meeting with Chinese officials, but no new agreements have been confirmed. If today’s talks yield no positive outcomes or if President Trump escalates rhetoric (e.g., reinstating higher tariffs), markets could plummet, as seen in early April when tariffs triggered a 15% drop in the S&P 500.
· Trade war fears disproportionately impact export-heavy indices like the Nikkei, which is sensitive to yen appreciation and U.S.-China tensions, and the Dow Jones, with its significant exposure to multinational corporations. A breakdown in negotiations could drive indices toward the April 7 lows as investors price in higher costs and slower global growth.
1.2. Disappointments in Economic Data
· CPI Reaction: The April 2025 Consumer Price Index (CPI), released on May 14, 2025, reported inflation at 2.3% annually, below the expected 2.4%. While initially viewed as positive, markets may have anticipated an even lower figure to justify Federal Reserve rate cuts. The modest S&P 500 gain (+0.7%) and Dow’s decline (-0.6%) on May 14 suggest investor skepticism about further inflation cooling.
· Producer Price Index (PPI) Release on May 15: The PPI for April 2025, scheduled for release at 8:30 AM ET (2:30 PM CEST) on May 15, 2025, is a pivotal event. If the PPI indicates persistent wholesale inflation—potentially driven by tariff-related cost pressures—it could signal rising consumer prices ahead, diminishing hopes for Fed policy easing and triggering a sell-off. A higher-than-expected PPI could echo the market’s reaction to mixed economic data in early April, when GDP contraction fears pushed indices lower.
· Consumer Sentiment: The University of Michigan Consumer Sentiment Index for May 2025, released on May 14, 2025, likely showed continued weakness (April’s reading was 52.2, a multi-year low). If the May figure, reported yesterday, declined further, it could amplify concerns about reduced consumer spending, negatively impacting corporate earnings and pushing indices downward.
1.3. Concerns Over Federal Reserve Policy
· On May 7, 2025, Fed Chair Jerome Powell highlighted heightened economic risks, citing “elevated uncertainty” due to trade policies. Markets are pricing in 75 basis points of rate cuts for 2025, with the first cut expected in July.
· Trigger for May 15: If today’s PPI data or other economic indicators (e.g., Initial Jobless Claims, also due at 8:30 AM ET) point to persistent inflation or economic weakness, expectations for rate cuts could fade, increasing borrowing costs for companies and pressuring equity valuations. This scenario would mirror April 7, when recession fears and tariff impacts drove the S&P 500 below 5,000.
2. Technical Analysis
· The initial impulse move saw a decline of approximately -21.87%, with a second impulse of similar magnitude (marked on the chart). Currently, markets are aligned for a simultaneous decline across asset classes: oil, cryptocurrencies, and major indices like the S&P 500, Dow Jones, Nikkei, and others.
· Previous analysis concluded that this is a correction preceding a broader decline in indices, driven by trade wars, geopolitical conflicts, and U.S. economic indicators. I believe a recession is already underway.
Price Targets for S&P 500 Decline:
➖ Retest of the April 7, 2025, low: $4,803.00
➖ Secondary target: $4,716.00
3. Market Sentiment and Behavioral Factors
3.1. Fragile Optimism Post-Rally
· The S&P 500’s 22% rally from April lows and the Dow’s 15% recovery were driven by trade truce optimism and strength in technology stocks (e.g., Nvidia, Palantir). However, Bloomberg reported on May 14, 2025, that Wall Street’s rebound is “showing signs of exhaustion” due to trade war risks and fears of an economic slowdown. This fragility could lead to profit-taking today if negative news emerges.
· The Dow’s weakness on May 14 (down 0.6% compared to the S&P 500’s 0.7% gain) highlights vulnerabilities in specific sectors (e.g., healthcare following UnitedHealth’s 18% drop), which could spread to broader markets.
3.2. Global Market Correlation
· Asian markets, including the Nikkei, exhibited mixed performance on May 14, with China’s CSI 300 up slightly (+0.15%) and India’s Nifty 50 down 1.27%. If Asian markets open lower on May 15 due to overnight U.S. declines or trade-related news, it could create a feedback loop, intensifying global selling pressure.
4. Mini Evidence-Based Framework for the Forecast
4.1. Catalysts for Today’s Decline (May 15, 2025)
PPI Data (8:30 AM ET): A higher-than-expected PPI could signal persistent inflation, reducing the likelihood of Fed rate cuts and triggering a sell-off. Consensus anticipates a 0.2% monthly increase; a reading above 0.3% could be bearish.
Trade Talk Updates: Negative commentary from U.S. or Chinese officials (e.g., no deal reached in Geneva) could reignite trade war fears, mirroring the April 7 sell-off.
Initial Jobless Claims (8:30 AM ET): An unexpected rise in claims (e.g., above 220,000 compared to the prior fmadd211,000) could signal labor market weakness, amplifying recession fears.
4.2. Global Scenario for S&P 500
· I anticipate a wave-like decline with intermittent corrections. I wouldn’t be surprised if the S&P 500 falls below 4,700, potentially reaching 4,200. Extreme caution is warranted this year.
· There’s even a theory that, starting in 2025, the U.S. dollar could lose 50% of its purchasing power.
Idea:
4.3. Oil and Geopolitical Outlook
I expect oil (Brent) to decline to the $50+/- range, from which an upward trend may begin, potentially tied to future military conflicts:
· Europe vs. Russia
· India vs. Pakistan
· Iran vs. Israel
US10 YR Yield Weekly Chart Analysis: NFAUpdate: May 15, 2025
-As per my last update(April 5, 2025) about the gap between March 24th candle and March 31st candle that any candle body close above that gap will invert that gap from resistance to support and Upside target will be Jan 13, 2025 candle High
- We had a candle body close above that gap and now its acting like support.
-Now i am expecting the bullish trend to continue and long term upside target is Jan 13, 2025 candle High and Short term upside target is April 7, 2025 candle high

Nightly $SPY / $SPX Scenarios for May 15, 2025 🔮 Nightly AMEX:SPY / SP:SPX Scenarios for May 15, 2025 🔮
🌍 Market-Moving News 🌍
📊 Producer Price Index (PPI) Release Today
The Bureau of Labor Statistics will release the April PPI data at 8:30 AM ET. This report will provide insights into wholesale inflation trends, following the recent Consumer Price Index data that showed inflation easing to a four-year low.
🛍️ Walmart ( NYSE:WMT ) Earnings Report
Walmart is set to release its earnings today, offering a glimpse into consumer spending patterns amid ongoing economic uncertainties. Investors will be watching closely for any indications of how inflation and trade policies are impacting retail performance.
👟 Foot Locker Acquired by JD Sports ( NASDAQ:JD )
JD Sports has officially acquired Foot Locker ( NYSE:FL ) for $1.6 billion ($24 per share). The deal aims to consolidate market share in the sportswear and athletic retail sector, with JD expanding its U.S. footprint. Foot Locker shares surged 67% premarket following the news.
💻 Nvidia ( NASDAQ:NVDA ) Faces AI Export Rule Implementation
The U.S. government's AI Diffusion Rule comes into effect today, potentially restricting Nvidia's chip sales to certain foreign markets. This regulatory change could influence Nvidia's stock performance and has broader implications for the tech sector.
📊 Key Data Releases 📊
📅 Thursday, May 15:
8:30 AM ET: Producer Price Index (PPI) for April
10:00 AM ET: Manufacturing and Trade Inventories and Sales for March
⚠️ Disclaimer:
This information is for educational and informational purposes only and should not be construed as financial advice. Always consult a licensed financial advisor before making investment decisions.
📌 #trading #stockmarket #economy #news #trendtao #charting #technicalanalysis


Bulls and Bears zone for 05-14-2025ETH session markets trending higher, could traders continue this week's rally or need to be cautious.
Levels to watch: 5912---5914
SPY/QQQ Plan Your Trade For 5-14 : Carryover PatternToday's pattern suggests the SPY/QQQ may attempt to stay somewhat elevated. The Carryover pattern is essentially a pattern saying, "expect more of the same type of trending today".
I would suggest the SPY/QQQ are somewhat extended and may pause a bit today.
I shared a chart I created back on March 23, 2025 that I found very interesting - showing a big rally in late-April/early-May. If that chart continues to be accurate - it suggests the markets may attempt a reversion move to the downside over the next 20-30+ days.
Time will tell if my predictions play out accurately or not.
Gold is moving into new BEARISH trending on the GOLD Cycle Patterns. After an extended consolidation phase in metals, this shift in the trend models was going to happen at some point.
Now, we need to see if Gold/Silver can hold above recent support or not. Even though I believe Gold/Silver are poised for another big rally, the disruptions related to the global economy and tariffs seems to have taken some of wind out of the sails of the metals rally (for now).
Bitcoin continues to lead the SPY/QQQ. Keep an eye on what BTCUSD does over the next 7-15+ days as I believe it will lead the US markets in trending (still).
Get some.
#trading #research #investing #tradingalgos #tradingsignals #cycles #fibonacci #elliotwave #modelingsystems #stocks #bitcoin #btcusd #cryptos #spy #gold #nq #investing #trading #spytrading #spymarket #tradingmarket #stockmarket #silver

AAPL LOOKING BULLISH 14TH MAY 2025Aapl is looking good to go long at current price as every demand is being respected and price is looking to go deeper into tbe supply zone.
So I will be going long with STOCKS ONLY.
If you any doubts do let me know in the comments below

SPY Broke The Sine-Wave Center - Not GoodWe see the 3 tiny arrows—proof that price was rejected by those who knew.
The Trend Barrier, once solid support, cracked without resistance. Price dropped right back into the Medianline set.
The small pullback? Totally expected—just like the Medianline rules suggest. Then came the brutal drop, textbook-style, straight to the Centerline.
The springboard move back up to the U-MLH and the Trend Barrier? No surprise—if you understand the Medianline Framework. Because this is just P2.
Also—watch the white line. That’s what I call the Sine Wave. Why does it matter? Because the center point (where the red pullback arrow is) often gets breached in a fake move... right before price reverses hard. From P2: down, down, down... lower than P1.
AND THAT SHOULD SCARE THE HELL OUT OF YOU!
…if I’m right 😈
But if it fails?
Then we’re looking at a monstrous V-shape recovery—one that could send the indexes skyrocketing.
So there you have it.
What’s your direction?
Let me know—and tell me why! §8-)

Upper Band Holds Post-Breakout - Classic Trend Signal in PlayDéjà vu? Not quite - but today’s session feels a lot like yesterday’s.
We’ve got a fresh mechanical bear trigger from a late-day Tag ‘n Turn setup. But much like the previous session, price action is telling us a different story.
Let’s walk through what I’m looking for.
---
SPX Market Briefing
Yesterday’s session started with a bearish bias. But by the end of the day, the market voided the setup via the hedge trigger - and since I wasn’t positioned bearish, it was a clear signal to flip bullish.
Same playbook again today.
I entered yesterday bullish and didn’t babysit the charts. Today, I’m starting with a bearish mechanical trigger, but futures are holding up. There’s also a post-breakout continuation in play that’s clinging to the upper Bollinger Band - a strong sign of bullish trending momentum.
Bollinger himself suggested this as one of the most reliable signs of strength.
So what’s the move?
Bearish trigger? Yes.
Bear entry? Not yet.
I’ll defer bearish entries unless price breaks below the 5880 area, with a v-shaped entry.
If price stays above 5910, I’ll resume bullish activity as needed.
This is shaping up to be another go/no-go decision day - no need to guess, no need to jump early.
Let price make the choice. I’ll respond when it does.
GEX Analysis Update
5900 is looking like the key GEX level again.
---
Expert Insights:
Mistake: Taking every mechanical setup without confirming price action
Fix: Use price structure (like Bollinger Band holds) to confirm trend integrity
Mistake: Jumping in without clear invalidation levels
Fix: Predefine bull/bear flip zones - today: 5880 and 5910
Mistake: Over-monitoring slow sessions
Fix: No need to stare at charts - mechanical setups do the heavy lifting
---
Rumour Has It…
Bollinger Band Declared Emotional Support Tool
Sources say traders have begun using the upper Bollinger Band like a weighted blanket. “As long as we’re above it,” one trader whispered from beneath a desk, “I feel safe.”
Psychologists confirm it's become a market-wide security blanket, replacing support/resistance zones in all therapy sessions.
This is entirely made-up satire. Probably!
Breaking scoops courtesy of the Financial Nuts Newswire-because who needs sanity?
---
Fun Fact
John Bollinger designed his bands in the early 1980s - not just to spot reversals, but also to identify sustained breakouts.
When price hugs the upper band after a breakout, it’s often signalling continuation, not exhaustion. It’s a feature of trend momentum, not a warning of collapse.
Today’s chart is textbook.
The system gives us the setup. But the context? That’s where discretion adds juice to the edge.

SPY BULLISH BREAKOUT|LONG|
✅SPY is trading in an
Uptrend and the index
Made a bullish breakout
Of the key horizontal level
Of 580.00$ and the breakout
Is confirmed so we will be
Expecting a further move up
LONG🚀
✅Like and subscribe to never miss a new idea!✅
Disclosure: I am part of Trade Nation's Influencer program and receive a monthly fee for using their TradingView charts in my analysis.

S&P 500 Index Most Bullish Signal In 15 YearsThis is why it is very clear, certain, that the stock market, the S&P 500 Index (SPX) is set to grow in the coming months. Last week produced the highest volume session, on the bullish side, since April/May 2010, that's 15 years. Back then, when this signal showed up, this index went to grow for years non-stop.
The SPX also produced the strongest weekly session in several decades, maybe the strongest week ever, and a bounce happened (support found) exactly at the 0.618 retracement Fib.
This is all we need to know. When the bulls enter the market and do so with force, it is because the market is set to grow. The correction produced decline of 21%. This is pretty standard. The fact that the correction happened really fast, it means that it will also have a fast end.
The low is in. The correction is over. The S&P 500 Index is set to grow.
You can be certain. If you have any doubts, just ask the chart.
Namaste.

Nightly $SPY / $SPX Scenarios for May 14, 2025🔮 Nightly AMEX:SPY / SP:SPX Scenarios for May 14, 2025 🔮
🌍 Market-Moving News 🌍
🇺🇸 U.S.-China Tariff Reductions Implemented Today
The U.S. and China are set to enact significant tariff reductions today, lowering U.S. tariffs on Chinese goods from 145% to 30% and China's tariffs on U.S. goods from 125% to 10%. This 90-day agreement aims to ease trade tensions and has already spurred a market rally, with the S&P 500 gaining 3.3% on Monday.
📉 Inflation Hits Four-Year Low
U.S. inflation eased to 2.3% in April, marking a four-year low. This unexpected decline has alleviated concerns about the impact of recent tariffs and may influence the Federal Reserve's monetary policy decisions.
📈 S&P 500 Turns Positive for 2025
The S&P 500 has erased its year-to-date losses, turning positive for 2025. This shift is attributed to easing inflation and the recent U.S.-China trade agreement, which have bolstered investor confidence.
💼 Nasdaq to List New ETFs
The Nasdaq Stock Market will begin listing three new Russell Investments ETFs today, expanding investment options for market participants.
📊 Key Data Releases 📊
📅 Wednesday, May 14:
5:15 AM ET: Speech by Fed Governor Christopher Waller
10:00 AM ET: Business Formation Statistics for April
⚠️ Disclaimer:
This information is for educational and informational purposes only and should not be construed as financial advice. Always consult a licensed financial advisor before making investment decisions.
📌 #trading #stockmarket #economy #news #trendtao #charting #technicalanalysis

COIN ~ Inverse Head & Shoulders Breakout -- Key Levels- Hello traders! COIN made a massive move today, breaking out of a beautiful Inverse Head & Shoulders pattern. So whats next?
- There are significant resistance levels approaching between $267 and $302 (including the Inverse H&S target level) which could potentially make for a good intraday short trade opportunity.
- Watch for a quick reversal from these levels in the coming days, if you're quick you may be able to catch a short trade.
- Theres no gaurantee that price will bounce from these levels, however this zone will certainly act as significant resistance in the short term.
~ Thanks everyone and best of luck in your trading journey!

MAJOR TURN NEW UPSIDE IN ELLIOT WAVE 6350 target I have moved from a Bear to a BULL based on the the alt wave count at 4835 support I will pull 4835 as minor and major wave 4 of the 5th wave I can count it three ways and once we break above 5945/6010 I get min targets of the old high at 6147 at that point it will mark Ax 1.618 or wave 1 x .1618 both reach 6147 That should be seen as an issue But if we break above 6180 I will get a target of 6250 and a second target of 6351 see chart for projection . I have covered shorts from 5799 here at 5903 and moved to a net long at 100 % I will add to a 125 % long on a buy stop at 6010 . Best of trades WAVETIMER

SPY/QQQ Plan Your Trade For 5-13 : Rally 111 PatternToday's RALLY pattern suggests we will see continued upward price trending in the SPY/QQQ (and possibly BTCUSD).
I believe the continued positive news/announcements by the Trump administration is adding fuel for the current rally phase in the US markets. It is hard to ignore his tactics (like them or hate them). He is able to get things done in a way that many believe is disruptive.
Still, from what I'm hearing, the Chinese trade deal is a very broad and advantageous deal that somewhat "resets" the disparity the US has experienced for the past 20+ years with China. Overall, that is a very positive advancement in global trade.
Now, we'll have to see how the markets react to this news and is the hype is as good as the final trade deal.
Overall, the US markets are still climbing up the current FLAGGING formation (still BULLISH).
I see another Island (GAP) type of price move, which may prompt some consolidation - we'll see how things play out.
Gold and Silver are setting up double/triple bottoms across support.
BTCUSD is rallying higher within a similar FLAG formation to the SPY/QQQ.
In my mind, the markets are back to nearly where they were prior to the tariffs and early breakdown in late-February 2025. This is the "make or break" time for the markets.
Either the SPY continues higher and attempts to break above resistance - or it will start to fail over the next 5-10+ days and break downward.
Buckle up... and GET SOME.
#trading #research #investing #tradingalgos #tradingsignals #cycles #fibonacci #elliotwave #modelingsystems #stocks #bitcoin #btcusd #cryptos #spy #gold #nq #investing #trading #spytrading #spymarket #tradingmarket #stockmarket #silver

US500 - Let the Bulls Strive!Hello TradingView Family / Fellow Traders. This is Richard, also known as theSignalyst.
📈US500 has been overall bullish trading within the rising channel marked in red.
Moreover, the blue zone is a strong support and structure!
🏹 Thus, the highlighted blue circle is a strong area to look for buy setups as it is the intersection of support and lower red trendline acting as a non-horizontal support.
📚 As per my trading style:
As #US500 approaches the blue circle zone, I will be looking for bullish reversal setups (like a double bottom pattern, trendline break , and so on...)
📚 Always follow your trading plan regarding entry, risk management, and trade management.
Good luck!
All Strategies Are Good; If Managed Properly!
~Rich
Disclosure: I am part of Trade Nation's Influencer program and receive a monthly fee for using their TradingView charts in my analysis.

SPY/SPX: FOMC. Do we get rate cuts or do we even get a hike?!TA on SPY but I also like playing SPX.
Was seeing this as either a rising wedge, and if play (with FOMC etc.) can touch and retest
551.41 then back move back up to test 562.81 and to out at 567.85 IF market reacts well to FOMC, maybe ATH?
If not, we actually fulfill that rising wedge to 543.54 with a small gap to touch/retest at 534.54
I may sit sidelines until FOMC to catch the move and waves. Always wait for the set up to come to you! One of the rules I try to keep following but I break.
Let me know what you think. Will continue to update as it the week progresses.
Again, do your own DD. Not financial advice.

May 12th Trade Journal & Stock Market Analysis May 12th Trade Journal & Stock Market Analysis
EOD accountability report: +778.75
Sleep: 6 hour, Overall health: 👍
Just arrived to BKK, and adjusting to the new place.
day 5 of taking the morning pill stacks consistency and noticing the lions mane working pretty effectively with the new supplements.
trading has been very clear and easy.
Daily Trade recap based on VX Algo System
— Yesterday at 9:30 AM Market Structure flipped bearish on VX Algo X3
Yesterday at 1:00 PM Market Structure flipped bullish on VX Algo X3!
— Yesterday at 1:21 PM VXAlgo ES X1 Sell Signal
— Yesterday at 1:30 PMVXAlgo ES X7 Sell signal,
3:37 PM Market Structure flipped bearish on VX Algo X3!
— Yesterday at 3:50 PM VXAlgo ES X1 Buy signal (triple buy)
Next day plan--> Under 5875 = Bearish with X7 sell signal, Over 5900 = Clearly bullish breakout
Video Recaps -->https://www.tradingview.com/u/WallSt007/#published-charts

$IWM, small caps, not YET giving the "all clear"AMEX:IWM is the lone index still not in the clear 🚩 — backtesting its 200dma today and tagging the weekly mid-BB , just like in '22. Will it matter by week's end? If not, the bull is likely back across the board 🐂
This week's #CPI (Consumer Price Index) and #PPI (Producer Price Index) prints could significantly influence market direction across major indices — AMEX:SPY , NASDAQ:QQQ and AMEX:IWM — especially with rate cut expectations in flux. 🧵Here's how:
1. Hot CPI or PPI (above expectations):
AMEX:SPY : Likely to pull back as sticky inflation pressures broader S&P names, especially rate-sensitive sectors like real estate and utilities.
NASDAQ:QQQ : Could see sharper downside—tech stocks (many of which are high duration assets) are highly sensitive to interest rate expectations.
AMEX:IWM : Likely the hardest hit. Small caps suffer from tighter financial conditions and depend more on domestic borrowing costs.
🟥 Result: Bearish across the board, with small caps underperforming.
2. Cool CPI or PPI (below expectations):
AMEX:SPY : Broad lift, particularly in consumer discretionary and financials.
NASDAQ:QQQ : Strong rally—mega cap tech loves the prospect of lower yields.
AMEX:IWM : Outperforms if cooling inflation suggests easing ahead, since it's more leveraged to rate cycles and domestic growth.
🟩 Result: Bullish, with small caps possibly leading a relief rally.
3. In-line CPI/PPI :
Markets may stay choppy or consolidate, with AMEX:SPY and NASDAQ:QQQ more stable.
AMEX:IWM remains at risk of drifting lower unless there’s a strong dovish narrative from the Fed or other macro catalysts.
With small caps already lagging, this week’s inflation data could either validate its bearish divergence or spark a rotation rally if inflation
AMEX:SPY NASDAQ:QQQ TVC:VIX $ES_F $NQ_F $RTY_F TVC:TNX NASDAQ:TLT TVC:DXY #Tariffs #Stocks

$HII Earnings Beat and Breakout ContinuationI have been long this name since April 17th. I held through earnings as it has been a slow but steady gainer.
Revenue did fall about 2% YOY. However, this is a good candidate for the new ship building initiative.
If you like this idea, please make it your own and be sure to follow "your" rules of trading. If you like this idea or any others I publish (and they are not always right) follow me on X where I post more often.
Huntington Ingalls Industries Beat Expectations
Thursday, May 1, 2025 at 7:15 AM ET
Huntington Ingalls Industries (HII) reported earnings of $3.79 per share on revenue of $2.73 billion for the first quarter ended March 2025. The consensus earnings estimate was $2.90 per share on revenue of $2.79 billion. The Earnings Whisper number was $3.00 per share. The company beat expectations by 26.33% while revenue fell 2.53% compared to the same quarter a year ago.
The company said it continues to expect 2025 revenue of $11.80 billion to $12.20 billion. The current consensus revenue estimate is $11.95 billion for the year ending December 31, 2025.
HII is a global, all-domain defense partner, building and delivering the world’s most powerful, survivable naval ships and technologies that safeguard our seas, sky, land, space and cyber.
