SPY/QQQ Plan Your Trade For 4-25 : Inside Breakaway patternToday's Pattern is an Inside Breakaway pattern. I suggest this pattern could play a pivotal role in how the markets setup for the May 2 Major Bottom pattern I'm expecting.
You'll see in this video how any move to the upside could present a broadening of the consolidation range - resulting in even bigger price volatility going forward.
Yet, I believe the markets will stall and roll a bit downward/sideways today. Possibly resulting in a move back into the lower consolidation range as we ROLL off resistance.
As I suggested last weekend, I see no reason to assume the markets are "cleared for take-off" yet. Tariffs and political concerns are still driving uncertainty.
I think we are seeing Q1 earnings inflate the markets while the fundamental elements of the global markets are still somewhat unsettled.
I urge traders to HEDGE any open trades going into this weekend. If the markets don't make any clear moves today, hedge any positions you hold into next week.
Gold & Silver are showing signs of minor panic selling. I see that as traders wanting to retest the $3300/$33 levels for Gold/Silver.
I still believe Gold/Silver will skyrocket higher. But, probably not going to happen today.
BTCUSD is making an interesting move higher. Potentially invalidating the previous EPP pattern and/or setting up a very broad consolidation range.
It will be interesting to see how BTCUSD continues to trend over the next few months.
Remember, I'm hopefully helping all of you find ways to improve your trading and find better results.
Get some..
#trading #research #investing #tradingalgos #tradingsignals #cycles #fibonacci #elliotwave #modelingsystems #stocks #bitcoin #btcusd #cryptos #spy #gold #nq #investing #trading #spytrading #spymarket #tradingmarket #stockmarket #silver
SPDR S&P 500 ETF (SPY)

April 25, 2025 - Trump’s Tango, Tech, and Insider DramaHello everyone, it’s April 25, 2025. We’re closing in on Trump’s 100-day mark back in the White House, and if there’s one word to sum up his impact on markets: chaos. With 137 executive orders signed already, he’s turned global markets into a high-stakes rollercoaster though this week saw signs of recovery, confidence remains fragile, and volatility is still running the show.
The main trigger? You guessed it: Trump and his tariff diplomacy. After weeks of U-turns, threats, and NYSE:TWTR meltdowns, he’s finally announced that talks with China have begun. That was enough to send the AMEX:SPY up 2%, pull the CME_MINI:NQ1! out of correction territory (+2.74%), and ignite a 5.63% jump in the Philadelphia Semiconductor Index, even though it’s still miles below its all-time high.
OANDA:XAUUSD is sitting at $3,332, BLACKBULL:WTI hovers around $63.21, and INDEX:BTCUSD has skyrocketed to $93,200. Not bad for a week that started in total disarray.
Now here’s where things get fishy: US indices started climbing before Trump’s announcement—classic “somebody knew something.” Insider trading? Just your average Thursday. And while Trump claims talks are underway, the Chinese side played coy, denying any ongoing negotiations. Either someone’s lying, or the talks are happening over dim sum in DC.
Beyond geopolitics, NASDAQ:GOOG crushed earnings expectations and added a juicy dividend and GETTEX:70B in buybacks, exploding 6% after-hours. Meanwhile, NASDAQ:INTC flopped—flat profits, poor outlook, and a CEO trying to turn cost-cutting into a growth story. The market wasn’t buying it: down 5.7% after-hours.
NYSE:NOW , though, is living its best life. Strong results, AI momentum, and federal contracts boosted shares 15%. Other names like NASDAQ:PEP , NYSE:PG , and NASDAQ:AAL warned on the future thanks to—you guessed it—political and economic uncertainty.
On the macro front, ECONOMICS:USIJC (US jobless claims) ticked higher, inflation seems to be cooling, and if next week’s PCE and employment data confirm the slowdown, the Fed might just blink and cut rates in May. Market hopes are pinned on Powell holding steady—unless, of course, Trump decides to live-tweet through it.
Futures are up 0.37% ( CME_MINI:ES1! ) this morning, signaling optimism—possibly misplaced—in Trump’s “friendly” overtures toward China. Let’s just say we’re one golf game away from another market tantrum.
Enjoy your weekend, stay alert, and cross your fingers for a quiet Sunday tweet-wise.

The Bear Is Dead. Long Live the Bull.From Fakeout to Full Send - SPX Flips Bullish
You could almost hear the financial media pop champagne today.
“Markets Surge Amid Easing Trade Tensions” they yelled.
“Global confidence returns!” they assured.
And sure, that’s a cute story.
But for us, Wednesday’s bear push now looks like a feint. A setup. A spring.
By Friday, the bull had not only taken the ball - it ran with it.
That V-shaped reversal pattern on the daily chart? It’s live. And it’s loud.
Technically, it’s now pointing to a projected upside of 6106.
That’s not just some random number. That’s the prior range high zone coming back into focus.
And in case you needed a reminder…
The bear is dead. Long live the bull. (until it isn't)
---
SPX Market View - Bullish Flip Confirmed
Wednesday gave us a classic tease.
Bearish energy. A flicker of downside. But it fizzled fast.
Then came Thursday - and with it, a clean sweep into Friday.
The V-shaped daily reversal triggered.
Price pushes off the lows
Sentiment flipped
And a new upside target emerged at 6106
It’s not just technical fluff. This level marks a structural return to the previous range highs - a natural magnet for bullish continuation.
Meanwhile, I’ve done a bit of chart housekeeping myself.
After two months of letting bias sneak in and lines and notes multiply like rabbits, I’ve hit the reset button.
🧹 Clean charts. Clean mind. Just the essentials.
The direction has changed - and I’m treating it with fresh eyes.
One line I am keeping?
5400. It’s been the pivot point for weeks. A battle-tested zone. It now serves as the bull’s first major checkpoint.
If price respects that level on any dip, it’s game on.
And if we breach it? That’s when the doubt returns.
---
💡Expert Insights: Common Trading Mistakes & How to Avoid Them
MISTAKE: Letting cluttered charts and old bias cloud current decisions.
FIX:
Regularly clean your charts — strip them down to what matters.
Use setups that speak for themselves (like the V-shape).
Don’t bring yesterday’s opinion into today’s trade.
A new direction demands a new perspective. And as price shifts, so must your lens.
---
🗞️Rumour Has It…
BREAKING:
Powell Declares Bull Market, Blames Moon Phase for Midweek Bear Tease
Financial news outlets were caught scrambling when the SPX reversed higher through thursday despite Wednesday’s doom-and-gloom.
“Clearly the moon was in retrograde,” Powell reportedly muttered, while clutching a Fibonacci ruler.
In other news, China's trade delegation released a statement saying, “We’re not sure what’s happening either.”
(This section is entirely made-up satire. Probably.)
---
🤯Fun Fact - The Original “Clean Chart” Addict Was… Jesse Livermore
Before indicators, algos, and triple-screen madness, Jesse Livermore – the OG speculator – was famous for trading from price and price alone.
In fact, he refused to use charts with clutter.
He would manually draw his price levels, log his trades by hand, and sometimes go days without placing a trade – waiting for the market to tip its hand.
His trading edge?
Patience.
Price action.
And a clean, unobstructed read.
One of his favourite tricks?
He’d mentally mark key inflection levels (like your 5400) and wait until price either exploded past or rejected hard before acting.
So next time you reset your chart – you’re not just decluttering…
You’re channelling Livermore.

Nightly $SPY / $SPX Scenarios for April 25, 2025🔮 🔮
🌍 Market-Moving News 🌍
📉 Procter & Gamble Cuts Outlook Amid Consumer Pullback: P&G shares declined after the company lowered its full-year earnings guidance, citing reduced consumer spending due to economic uncertainty and higher tariffs. CFO Andre Schulten noted significant consumer hesitation, linking it to volatility in mortgage rates and declining stock markets affecting retirement savings.
📊 Durable Goods Orders Surge, Core Spending Stagnant: March durable goods orders jumped 9.2%, driven by a spike in aircraft demand. However, core capital goods orders, excluding aircraft, rose only 0.1%, indicating cautious business investment amid ongoing tariff uncertainties.
🏠 Existing Home Sales Decline Sharply: Existing home sales fell 5.9% in March to an annual rate of 4.02 million units, reflecting affordability challenges associated with high mortgage rates and economic uncertainty.
📊 Key Data Releases 📊
📅 Friday, April 25:
🗣️ Fed Governor Neel Kashkari Speaks (5:00 PM ET):
Remarks may provide insights into the Federal Reserve's perspective on current economic conditions and monetary policy direction.
⚠️ Disclaimer: This information is for educational and informational purposes only and should not be construed as financial advice. Always consult a licensed financial advisor before making investment decisions.
📌 #trading #stockmarket #economy #news #trendtao #charting #technicalanalysis

SPX on threshold of bullish breakout? I am cautiously bullishNations may be lining up to kiss Trump's a??? but SPX has come to kiss a confluence of trendline resistance as well as POC
Also markets we approaching month end. You only need to look at the past month ends and see what happens to the price, yes they tend to reverse very often if not always, specially if the prices are below 200 ema as it is now.
I would be watching how the market behaves next week. Soft economic data are pointing to weaker economy and the underlying problem of highly leveraged Hedge Funds remain. I wonder if they begin to deleverage some more at this level.
Any future decline would be a good entry point

April 24 Trade Journal & Stock Market AnalysisApril 24 Trade Journal & Stock Market Analysis
EOD accountability report: -400
Sleep: 4 hour, Overall health: bad
X7 signal this morning somewhat told us we were going to bullish direction, but my mindset just wasn't there today, had bad sleep and things going on and ended up locking up account early. I just read a book about it recently but I think I need to really cut bad influences out of my life when im dealing with money.
**Daily Trade Signals based on VX Algo System**
** 7:00 AMVXAlgo ES X7 Buy signal**
10:43 AM VXAlgo ES X1 Sell Signal (caught 10 pt)
1:12 PM VXAlgo NQ X1 Sell Signal (10 pt)
3:10 PM VXAlgo NQ X3 Sell Signal (2x signal, failed)
3:30 PM Market Structure flipped bearish on VX Algo X3! (canceled out& failed)
Next day plan--> Bullish over $5500

$GOOG Possible Demand Zone 155-143 Targeting 178 By earning!One of worst weekly candles and 3 bearish soldiers pattern made it extremely bearish but now entered the demand zone between 155 to 143 expecting accumulation into this range then possible bottom by mid of April then moving higher after earning targeting upper gap but we keep the target more secure by targeting 178 as closing trade. 161-164 is strong resistance . so the idea bye with weakness and accumulate during coming days with stop loss below 140 approx. Earning estimate 1.6 which is a drop from 2.4 last quarter by 30% - P/E at 19.98 EPS at 8.12 - Average analyst rating at 215 (+60$) from last close at 156. these fundamental make this idea is much likely to succeed. Good luck - please like and share . thanks

Pull back SPYBought some puts for 04/29 strike 439. Too much resistance above, looks like is going to be a rejection. Tight SL at 550.

SPY/QQQ Plan Your Trade Update : EPP Flag Setup CompleteI created this video to highlight the current EPP Flag setup in the SPY/ES.
It is my opinion that the market are about ready to ROLL OVER into a downward trend because of this current EPP setup.
Once the FLAG forms (in this case a BULLISH FLAG), the next phase is a BREAKDOWN INTO CONSOLIDATION.
It is my belief the current FLAG will prompt a breakdown in price - moving into a lower consolidation range.
I'm highlighting this EPP pattern to help everyone learn how to use them more efficiently.
Get ready. If I'm right, we're going to see a big move downward over the next 2-4+ days.
Get some...
#trading #research #investing #tradingalgos #tradingsignals #cycles #fibonacci #elliotwave #modelingsystems #stocks #bitcoin #btcusd #cryptos #spy #gold #nq #investing #trading #spytrading #spymarket #tradingmarket #stockmarket #silver

ES how to trade longs!On the 1-hour ES chart we identified an hourly oversold condition against our JLines bands and flagged a long plan this morning (see the 2:39 PM alert). We held the JLines 60 min curl as support, pulled the trigger near 5,375, and rode the move up to 5,475+ for a clean win.
Setup Details
Timeframe: 1 hour
Signal: Hourly JLines curl held in oversold zone
Entry: ~5,375 region
Target: 5,700 area
Outcome: Target reached, +100 handles
This is our repeatable process—spot the JLines support in an oversold zone, plan the entry, and lock in the move.

April 24, 2025 - Not getting fired (yet)Hello everyone, it’s April 24, 2025, welcome back to another wild episode of “Trumponomics: The Market Edition.” For the second day in a row, global markets are on the rise, and yes, it’s all thanks to the Trump playbook: slap tariffs everywhere, terrify the market, escalate tensions, then toss out a gesture of peace and voilà — rally mode engaged.
The key word this morning? Relief. Relief that Trump might chill out on China, and Powell isn’t getting fired (yet). But let’s not pop the champagne too soon — anyone betting against a weekend plot twist from Trump hasn’t been paying attention.
In the US, the Fed’s Beige Book (a.k.a. the economy’s mood diary) painted a picture that’s… let’s say “limp but not lifeless.” Only 5 of the 12 Fed districts saw growth, and even that was more “walker with tennis balls” than Olympic sprint. Inflation? Creeping in slowly, with companies sharpening their price-hike pencils just in case Trump cranks up the tariff heat again. Employment? Not awful, but nothing to brag about. And uncertainty? It was mentioned 80 times in the report. That’s not a joke.
Meanwhile, auto sales are up — not because the economy’s booming, but because Americans are panic-buying ahead of expected price surges from more tariffs. Business travel is tanking, and tourism’s taking a nosedive. Welcome to the “Not-quite-a-crisis-but-definitely-not-fine” States of America.
As for OANDA:XAUUSD , after a brief flirtation with $3,500, it’s cooled down to $3,337. BLACKBULL:WTI is holding at $62.86. And INDEX:BTCUSD ? It’s back in the spotlight at $92,000 and climbing — yes, people are talking about it again, which should tell you something about the vibe out there.
On the politics front, Trump hinted that the tariff moratorium could be revoked for some countries, and he’s back to pestering Powell to cut rates. Classic. Meanwhile, Wall Street is just trying not to get whiplash. NYSE:BA numbers came in better than feared, and NASDAQ:NVDA supply chain via INX looks solid despite wild swings.
Today’s economic calendar includes durable goods data and jobless claims in the CME_MINI:ES1! are down 0.2% — looks like investors are just bracing for the next Trump curveball.
TL;DR: Markets are riding the Trump-coaster, gold cooled off, crypto’s surging, and America’s economy is wobbling but still upright — for now. Keep your helmets on.

SPY - support & resistant areas for today April 24 2025These are Support and Resistance lines for today, April 24, 2025, and will not be valid for the next day. Mark these in your chart by clicking grab this below.
Yellow Lines: Heavily S/R areas, price action will start when closing in on these.
White Lines: Are SL, TP or Mid Level Support and Resistance Areas, these are traded if consolidation take place on them.
SPY/QQQ Plan Your Trade for 4-24 : Carryover PatternToday's Carryover pattern suggests we'll see similar price action today to what we saw yesterday.
We will very likely see a little support in early trading today, followed by a moderate meltdown-type trend.
I'm not expecting much to happen today - but we could get some news or other data that may prompt some type of bigger move in the markets.
Yesterday evening, I shared an "Update" video with everyone. In that video, I highlighted some of my active trades.
I've gotten a few messages from followers asking if I can share more data related to my trades. I'm sorry, but that won't happen in these FREE Plan Your Trade videos.
I shared some of my trades yesterday to highlight how I had moved into a moderate Short/PUT position, trying to stay ahead of the bigger market trend.
In other words, I'm not chasing the nickels. I'm setup to try to profit from the DOLLARS.
Gold and Silver may stay somewhat muted over the next 48 hours. But, I do expect them to try to melt upward.
BTCUSD appears to be setting up a BULL TRAP. I, personally, don't trust this upward price move because it is counter to the EPP price structure. I could be wrong.
But right now, I just don't trust the upside move in BTCUSD, knowing the SPY/QQQ should move into a deeper MAJOR LOW in early May.
Again, these videos are designed to help you build your skills and find your own style of trading.
I really do hope all of you are benefiting from my continued work to deliver these videos.
GET SOME...
#trading #research #investing #tradingalgos #tradingsignals #cycles #fibonacci #elliotwave #modelingsystems #stocks #bitcoin #btcusd #cryptos #spy #gold #nq #investing #trading #spytrading #spymarket #tradingmarket #stockmarket #silver

Narrative Noise vs. System ClarityApparently, the market was “uncertain” today.
Somewhere between Trump retracting his Powell shade, the Fed playing PR dodgeball, and tariffs being simultaneously on and off the table… headlines were doing what they do best: explaining yesterday with confidence.
But the chart?
The chart spoke first.
We came into the session ready for bullish confirmation.
Instead, we got a clean rejection of 5400, with early signs of downside pressure before lunch.
This is why we follow price, not PR.
Today’s action didn’t invalidate the bull bias completely, but it sure made the case that bears aren’t done just yet.
Let’s unpack what we saw and where we’re headed next.
---
Additional images mentioned can be seen on my main blog
---
SPX Market Outlook - Structure Rejected, Futures Rolling
While the headlines continue to spin post-news confusion, the price action remains our guide.
Yesterday, we came into the session prepared for a bullish continuation, but 5400 acted as a firm barrier once again.
The daily chart showed a clear rejection, and despite the bullish lean in the morning, the structure leaned bearish by session’s end.
Now, as I write this before the cash open, overnight futures are pushing lower, indicating potential follow-through.
That doesn’t confirm anything just yet - but it does tilt the bias.
Here’s what I’m watching:
5400 = still key resistance
5300 = GEX flip level - will reassess bearish view if we break and hold below it
5000 remains the target for the Wolfe pattern continuation
Upper Bollinger tag is in - another technical sign of short-term exhaustion
No bear pulse bar yet, but a clean V-shaped reversal is visible on the chart
ADD remains near bull extreme - offering more bear potential than bull in the short term
Bias remains bearish below 5300, and I’ll reassess to add in below that level.
---
GEX Analysis Update
5500 - 5400 - 5350 all look interesitng levels
5300 is the current flip point
---
Expert Insights: React to Price, Not PR
❌ Mistaking news for a setup
Narratives are seductive. They come with headlines, urgency, and lots of confident pundits.
✅ Stick to the chart
Price told us today’s story long before CNBC tried to.
5400 rejection. No pulse bar. Bullish exhaustion on ADD.
That's not confusion. That's confirmation — if you're paying attention.
---
Rumour Has It…
Trump was overheard saying, “Maybe Powell’s alright. Maybe.” Dow gained 0.3% and then shrugged.
5400 is reportedly suing for emotional damages after being rejected for the third time this month.
A Wolfe Wave ghost briefly appeared on the chart, waved, and vanished near 5300.
(This section is entirely made-up satire. Probably.)
---
Fun Fact - News Always Arrives After Price
Markets don’t wait for clarity.
They move first, then the headlines scramble to explain why.
The pattern is timeless:
Price shifts.
Smart traders react.
Media catches up.
Retail says, “Oh, THAT’S why.”
Yesterday was no exception.
So if the news says “flat and uncertain,” but the chart shows a failed breakout, don’t wait for a CNBC blessing to press the button.
The system already said what it needed to say.

US500 Day Trade Setup: Liquidity Pools, Gaps & What’s Next?The US500 (S&P 500) 4-hour chart recently showed a gap up, followed by a strong move into the previous range highs. This price action likely triggered buy stops and tapped into buy-side liquidity above the prior swing highs. After this liquidity sweep, the market has pulled back and is now consolidating just above a visible gap, which sits slightly below the current price level.
From a Wyckoff perspective, this resembles an upthrust after distribution, where price runs stops above resistance before reversing. The current pullback suggests a potential test of the gap area, which often acts as a magnet for price, especially if there’s unmitigated liquidity left behind.
Using ICT (Inner Circle Trader) concepts, the recent move above the range high can be seen as a raid on buy-side liquidity, followed by a retracement. The gap below current price represents an imbalance, and ICT traders often look for price to revisit such inefficiencies before resuming the trend.
🌐 Fundamental & Sentiment Backdrop
Recent data shows the S&P 500 has experienced a sharp correction in April, with a monthly drop of about 5.75% from the previous month, but it remains up 6.8% year-over-year (YCharts). The market has been volatile, with sentiment shifting due to macroeconomic concerns, including renewed trade tensions (notably new tariffs), a mixed earnings season, and questions about the Federal Reserve’s next moves (IG).
Wall Street analysts have recently revised their year-end targets lower, citing increased risks from tariffs and slowing earnings growth (Yahoo Finance). The VIX is elevated (28.45), and the put/call ratio is above 1, indicating heightened hedging and caution among market participants (YCharts).
🏦 Wyckoff & ICT Concepts in Play
🏗️ Wyckoff: The recent rally into the highs and subsequent pullback fits the upthrust after distribution narrative. If the market fails to reclaim the highs, a move back into the gap (potentially as a sign of weakness) is likely.
💧 ICT: The gap below current price is a clear area of interest. If price trades down to fill this gap, watch for a reaction—either a bounce (if demand steps in) or a continuation lower if the gap fails to hold.
💡 Day Trade Idea (Not Intra-day)
Scenario: If price trades down to fill the gap just below the current level (around 5,300–5,320), monitor for a bullish reaction (such as a strong daily close, a bullish order block, or a clear rejection wick).
Trade Plan:
🕵️♂️ Wait for price to fill the gap and show a bullish daily signal.
🎯 Enter a day trade long at the next day’s open if confirmation is present (e.g., a bullish daily candle close or a break above the previous day’s high).
🛑 Place a stop loss just below the gap or the most recent swing low.
📈 Target the previous high near 5,400 for a day trade, or consider scaling out if momentum continues.
Alternative: If price fails to hold the gap and closes below it on the daily chart, consider a day trade short the following day, targeting the next liquidity pool below (e.g., 5,200).
⚠️ Disclaimer
This analysis is for educational purposes only and does not constitute financial advice. Trading involves risk, and you should do your own research or consult with a professional before making any trading decisions. Past performance is not indicative of future results.

$PLTR Trade: Buy $90.86 , Target $101.35Beep Beep. Hope everyone is taking care of their trading accounts during this volatile phase in the markets. I noticed an identical setup on the weekly from back in August 24' and I'm looking to take advantage. We have a trend reversal on the Tom Demark sequential that helps identify trend exhaustion through a 9 Count. Currently on a 2 Count, we're testing the gap while simultaneously testing the 10WMA at 90.86.There is also a weekly gap at 101.35 ... Entry would be the 10WMA. Target the weekly Gap. Trade is as follows:
Trade Idea - Swing NASDAQ:PLTR $95 Calls 4/25
Entry - 10 WMA @ $90.86
Target - Gap on Weekly at $101.35

SPY/QQQ Plan Your Trade Update For 4-23 : Rally-111 PatternToday's pattern really showed up pre-market.
Where was the rally today? It happened before the US markets opened for business.
The SPY/QQQ had already moved up into my upper resistance area on strong buying overnight.
I knew I had to run my father around most of the day, so I booked my profits this morning and tried to catch one little SPY rally (that didn't work out).
So, I started taking some positions for next week's potential downtrend, and I thought, "How much risk am I taking on these trades if the markets continue to move upward?"
I realized I would be taking about $1000 to $1400 in total risk, but my expiration date is near May 16. So my target for any profit really needs to be before May 10th or so.
If the markets do what I expect, I'll be sitting back, watching my profits grow as the markets trend downward into my May 2 Major Bottom (I hope).
I created this video to highlight the now partially confirmed inverted EPP pattern that setup the Ultimate High in early trading today.
Now that we've completed the inverted EPP pattern, we should be looking for the ES/SPY/QQQ to move downward, shift into a sideways/upward price flag. Then, break down into the new Consolidation phase.
Essentially, if my EPP patterns play out well, I timed my move away from longs/calls and into shorts/puts almost perfectly. Now, I just need to sit back and wait for the markets to make a move.
This is what trading is all about. You can't kick the markets to do what you want them to do. You have to learn to take what the markets give you and fall in line with market trends.
When you do that well, profits start to fall into your lap (if you are patient).
Follow along as I break down these market trends and learn how to develop your own skills.
GET SOME.
#trading #research #investing #tradingalgos #tradingsignals #cycles #fibonacci #elliotwave #modelingsystems #stocks #bitcoin #btcusd #cryptos #spy #gold #nq #investing #trading #spytrading #spymarket #tradingmarket #stockmarket #silver

April 23 Trade Journal & Stock Market Analysis April 23 Trade Journal & Stock Market Analysis
EOD accountability report: +2325 on Eval, didn't trade funded
Sleep: 10 hour, Overall health: :check:
— 9:00 AM Market Structure flipped bullish on VX Algo X3!
— 11:30 AM Market Structure flipped bearish on VX Algo X3!
— 12:30 PM VXAlgo ES X1 Buy signal (triple buy signal) B+ set up
— 1:33 PM VXAlgo YM X1 Sell Signal (triple sell signal) B+ set up
— 1:55 PM Market Structure flipped bullish on VX Algo X3!
— 2:30 PM Market Structure flipped bearish on VX Algo X3!
— 3:31 PM VXAlgo ES X1 Buy signal (double signal)
Next day plan--> Short 48m MOB
Video Recap -->

Nightly $SPY / $SPX Scenarios for April 24, 2025🔮 Nightly AMEX:SPY / SP:SPX Scenarios for April 24, 2025 🔮
🌍 Market-Moving News 🌍
🇪🇺 European Banks Brace for Tariff Impact: European banks are facing a challenging outlook as U.S. tariff hikes raise recession fears. Analysts anticipate slower revenue growth and increased loan loss provisions, with institutions like BNP Paribas expected to report earnings reflecting these pressures.
✈️ Airline Industry Faces Booking Declines: European airlines report a 3% drop in planned summer trips, with leisure travel down 8% compared to 2024. Economic concerns and rising travel costs, particularly among Gen Z travelers, are contributing factors. Airlines like Ryanair and Air France-KLM are considering fare adjustments to maintain demand.
👗 Kering's Revenue Drops Amid Gucci Struggles: Luxury group Kering reported a 14% decline in Q1 revenue, with flagship brand Gucci experiencing a 25% drop. The company attributes the downturn to ongoing brand challenges and macroeconomic factors affecting consumer spending in key markets.
📊 Key Data Releases 📊
📅 Thursday, April 24:
📦 Durable Goods Orders (8:30 AM ET):
Forecast: +2.1%
Previous: +0.9%
Measures new orders for manufactured durable goods, indicating manufacturing sector health.
📈 Initial Jobless Claims (8:30 AM ET):
Forecast: 222,000
Previous: 215,000
Reflects the number of individuals filing for unemployment benefits for the first time, signaling labor market trends.
🏠 Existing Home Sales (10:00 AM ET):
Forecast: 4.14 million
Previous: 4.26 million
Indicates the annualized number of existing residential buildings sold, providing insight into housing market conditions.
⚠️ Disclaimer: This information is for educational and informational purposes only and should not be construed as financial advice. Always consult a licensed financial advisor before making investment decisions.
📌 #trading #stockmarket #economy #news #trendtao #charting #technicalanalysis

CHIP SECTOR TO CRASH SMH The chart posted is the SMH we are now in the final 5th wave and it is a classic 5th wave Diagonal in the 5th wave wave to form a double top into fib cycle peak .From here we should see a major break down in All chip stocks into Oct 2025 but we should see the first leg down low march 10/20th 2025 this should be a Very Bearish action world wide see spy and qqq as well . This is the warning to All traders EXIT INTO RALLIES THE BEST OF TRADES WAVETIMER

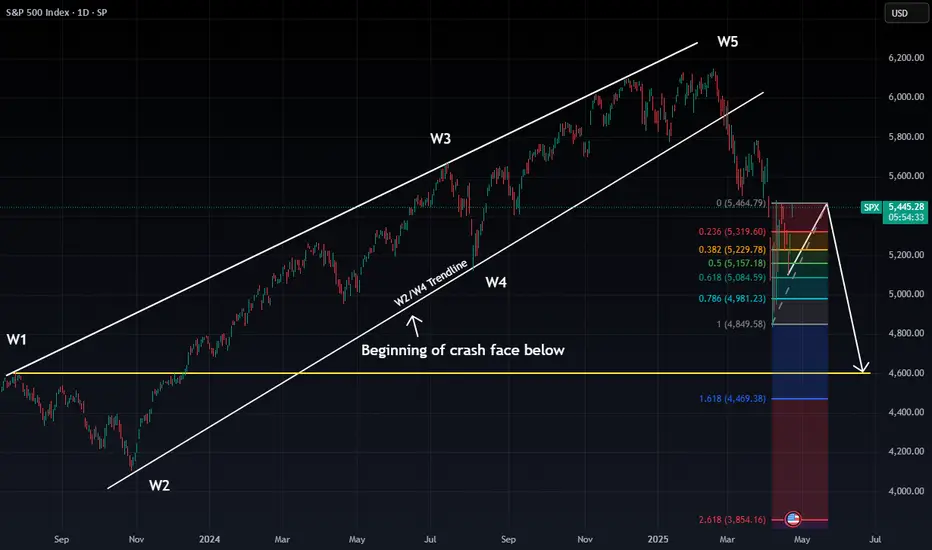
PIVOTAL DAY AHEAD FOR $SPX: Will We Reclaim the Highs or Begin tTechnical Breakdown: We’re at a critical junction for the S&P 500. After completing a 5-wave structure, SP:SPX is teetering near a decision point. Two potential paths are now unfolding:
Bullish Scenario (🟢):
A daily close above 5386 would invalidate the current bear thesis.
This opens the door to a push toward the 90–100% Fib retracement zone (5685–5750).
Short-term traders may look to ride the momentum if 5485 is broken cleanly.
Bearish Scenario (🔴):
A rejection at current levels, coupled with a close below 5386 and a gap-fill back down, confirms the bearish triangle setup.
If this plays out, we’re targeting a drop to the 4600–4400 range based on the 1.618 and 2.618 Fibonacci extensions and broken trendline dynamics.
This aligns with the Elliott Wave breakdown (W5 peak, now in corrective ABC structure).
🧩 Macro Context:
High inflows to safe havens like gold suggest rising fear.
Volatility is elevated, and liquidity is thinning post-earnings season.
💥 Conclusion: Tomorrow’s close is not just another candle – it’s a potential macro trigger. Either we confirm a final leg higher in this cycle, or the bearish wave unfolds in full.
⏳ Watch 5386 closely.
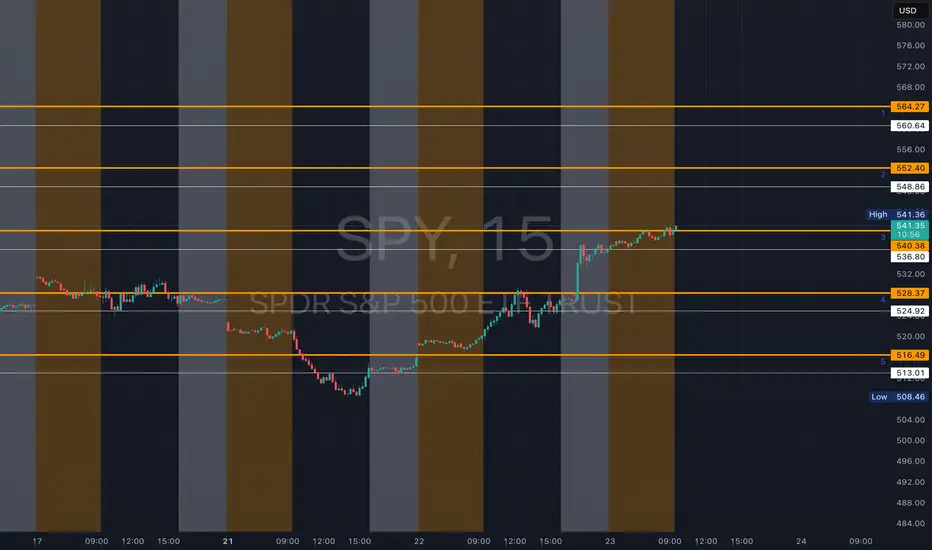
SPY - support & resistant areas for today April 23 2025These are Support and Resistance lines for today, April 23, 2025, and will not be valid for the next day. Mark these in your chart by clicking grab this below.
Yellow Lines: Heavily S/R areas, price action will start when closing in on these.
White Lines: Are SL, TP or Mid Level Support and Resistance Areas, these are traded if consolidation take place on them.
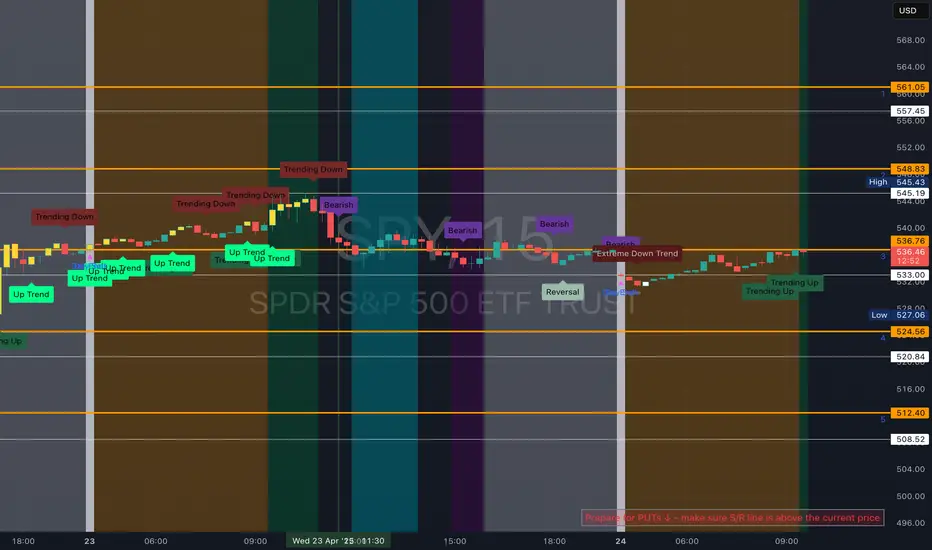
SPY/QQQ Plan Your Trade For 4-23 : Rally-111 PatternToday's RALLY pattern suggests the SPY/QQQ will continue to push higher, possibly breaking upper resistance near $550/493.
As I suggested in this video, I believe the upward price trend bias will continue into Friday (4-25) and suddenly shift into a BEARISH price trend/bias early next week.
The May 2-5 Major Bottom cycle low, my research predicts, will happen and should prompt a fairly strong downward price trend as we near the end of April and head into early May.
Gold and Silver will likely consolidate a bit over the next 24-48 hours. So, this is a great time to pick lower entry price levels for LONGS/CALLS.
Ultimately, I'm still expecting Gold to rally above $3750 before the end of May and attempt to target $4500++ before the end of June.
BTCUSD is moving into a potential "INVALIDATION" phase. Although I'm currently estimating the probability of that invalidation at about 20-30%, it is still a valid price trend.
I believe BTCUSD will shift into a downward price trend as the markets continue to unwind excesses through the May, July, and October lows, according to my cycles.
The big opportunity for traders over the next 48 hours is playing the upward trend bias in the SPY/QQQ - then moving into a mode of preparation for next week's breakdown/downward price trend in the SPY/QQQ.
So, play it smart. Follow the chart and don't try to be a superhero.
Play what is in front of you and prepare for the bigger price swings headed into next week and beyond.
Get some.
#trading #research #investing #tradingalgos #tradingsignals #cycles #fibonacci #elliotwave #modelingsystems #stocks #bitcoin #btcusd #cryptos #spy #gold #nq #investing #trading #spytrading #spymarket #tradingmarket #stockmarket #silver
