April 22st Trade Journal & Stock Market Analysis** April 22st Trade Journal & Stock Market Analysis**
EOD accountability report: +325
Sleep: 3 hour, Overall health: tired
**Daily Trade Signals based on VX Algo System**
— 9:00 AM Market Structure flipped bullish on VX Algo X3!
10:20 AM VXAlgo NQ X1 Sell Signal
10:30 AM VXAlgo ES X1 Sell Signal
10:51 AM VXAlgo ES X1 Sell Signal
11:20 AMVXAlgo ES X1 Sell Signal (Triple signal) C+ set up
1:12 PM VXAlgo NQ X3 Sell Signal (Double X3 signal)
1:30 PM Market Structure flipped bearish on VX Algo X3!
3:00 PM Market Structure flipped bullish on VX Algo X3!
3:10 PM VXAlgo ES X1 Sell Signal (Triple signal) C+ set up
SPDR S&P 500 ETF (SPY)


SPY/QQQ Plan Your Trade Update For 4-22 : EPP StructuresThis video highlights why the Excess Phase Peak pattern is so important for traders to understand and follow.
Imagine being able to see into the future and to be able to plan/project price action in a way that is like putting together building blocks (or Leggos).
That is what the Excess Phase Peak pattern represents for all traders.
Once you understand it and learn to use it, you'll see how it presents very clear opportunities for you to plan and execute fantastic trades in any market.
Fibonacci Price Theory, Energy Cycles, & The Excess Phase Peak patterns are really the core structures of price.
Elliot Wave is fantastic for "after the fact" type of analysis. IMO, you don't really know how the EW count is truly structured until after the current major wave structure is complete (meaning you are 2-3 waves into the new (counter-trend) structure.
Watch this video and try to think about how I'm taking the EPP patterns to learn to plan out opportunities for price based on STRUCTURE - not indicators or averages.
This is how the markets work.
Pay attention and GET SOME.
#trading #research #investing #tradingalgos #tradingsignals #cycles #fibonacci #elliotwave #modelingsystems #stocks #bitcoin #btcusd #cryptos #spy #gold #nq #investing #trading #spytrading #spymarket #tradingmarket #stockmarket #silver

Approaching the 200-Week SMA – AgainHistory doesn’t repeat… but it sure does rhyme.
If all you did was buy the S&P 500 every time it touched the 200-week moving average, you would’ve: ✔️ Bought 2011, 2016, 2018, 2020, 2022… 💰 Absolutely cleaned house.
Now in 2025, we’re approaching the same level again. That SMA has acted like a trampoline for the last 15 years — will it bounce once more?
🧠 Food for thought as fear builds and the market cools.
Let’s see if the buyers step in where they always have. 👀

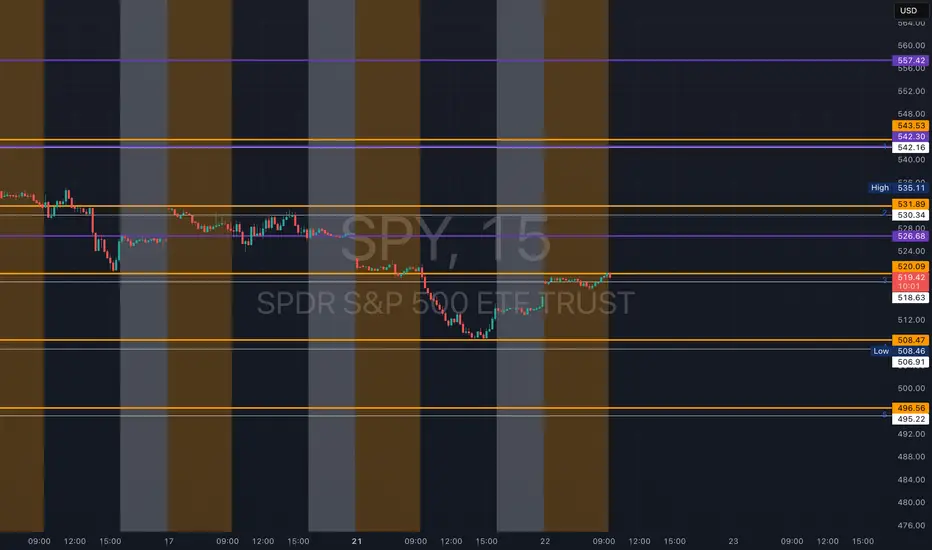
SPY - support & resistant areas for today April 22 2025These are Support and Resistance lines for today, April 22, 2025, and will not be valid for the next day. Mark these in your chart by clicking grab this below.
Yellow Lines: Heavily S/R areas, price action will start when closing in on these.
White Lines: Are SL, TP or Mid Level Support and Resistance Areas, these are traded if consolidation take place on them.
SPY Plan Your Trade For 4-22 : Breakaway In Counter TrendToday's pattern suggests the markets are moving in a counter-trend mode and that we may see a Breakaway type of price bar.
The current trend is Bearish. Thus, I believe the current Counter-Trend is Bullish.
As many of you already know. I picked up some Calls off the lows yesterday after noticing a complete EPP pattern (Ultimate Low) setup about 75 minutes before the end of the regular trading day on 4-21.
My opinion, overall, is that we are still stuck within a consolidation phase. But that doesn't mean we can't see the SPY/QQQ move higher (toward the upper consolidation high) or roll back downward (toward the lower consolidation low).
I do believe we are moving into a moderate upward price trend over the next 3-4+ days where price will attempt to retest the 525-535+ level on the SPY, then ROLL into a top and start a sharp downtrend.
This volatility presents an incredible opportunity for traders. Staying ahead of these trends is key to improved success.
The SPY Cycle Patterns are fairly clear. We've moved into consolidation, and the price is very volatile. The Counter Trend pattern today may setup a 3-4+ day minor rally in the SPY/QQQ.
But, ultimately, I believe the SPY/QQQ will roll downward into the May Cycle lows - just as I have been predicting for the past 45+ days.
Don't get greedy. Play the immediate trend and learn to identify the EPP patterns on 5-minute charts.
Today should be a very good day for traders.
Get some.
#trading #research #investing #tradingalgos #tradingsignals #cycles #fibonacci #elliotwave #modelingsystems #stocks #bitcoin #btcusd #cryptos #spy #gold #nq #investing #trading #spytrading #spymarket #tradingmarket #stockmarket #silver

S&P 500: This Pattern Could EmergeThey say recession is imminent...
This is how it can emerge on the S&P 500 chart
in shape of Head & Shoulders
Its visual speculation, so let's leave it here and return in 2026-2032
to check if it played out

Plan Your Trade Update For 4-21 : Waiting For The EPP SetupThis video is, hopefully, going to help many of you learn to use the Excess Phase Peak (EPP) pattern more efficiently.
For months, I've been trying to teach all of you to use this pattern to efficiently identify and trade some of the biggest price moves.
Remember, price only does TWO THINGS - TREND or FLAG.
These components are essential to the EPP pattern setup.
First, price must TREND into a peak or trough.
Second, price must pullback from the peak or trough.
Third, price must move into a SIDEWAYS/FLAGGING formation.
Forth, price must break away from the sideways/flagging formation and attempt to TREND into the new consolidation phase.
Fifth, once the new consolidation phase starts, price will trend and flag within the consolidation range for a period of time - before...
Sixth, price will attempt to break up or down to the Ultimate High/Low.
This chart of the ES/SPY will show you how I used my analysis to "front-load" my positions before the Easter holiday weekend.
I've been telling all of you the markets would likely attempt to move a little bit higher, trying to target 525-535 (if we are lucky). Then, price would roll into a topping formation and move downward towards my May 3-6th low (estimate).
Last Thursday, I decided to throw on two positions to protect against any big news that may cause the markets to collapse over the holiday weekend.
I picked up :
4 SDS CALL options @ $23 expiring on May 16
3 XLF PUT options @ $47 expiring on May 16
Both of those trades worked out perfectly this morning. I booked 2 of the XLF and 2 of the SDS for profits near 1030 AM PT. Lovely.
Next, in between phone calls and loading up my car for a short trip, I noticed a beautiful EPP pattern setting up in the ES, and that EPP pattern has already reached what I believe to be the Ultimate Low.
I tried to get into 2 SPY Call options @ $512 and held my breath to see if I timed the entry well.
NOT.
I took a $280+ loss on those two Calls.
I waited a bit longer to see what price did, and after the price setup a base below $510 on the SPY, I loaded up on two more SPY Calls @ $510 and two SSO calls @ $67 about 70-80 minutes before the end of trading.
The way I looked at it, I already had my downside trades placed from last Thursday, and I just added some upside exposure while my downside trades were profitable.
I didn't know if the SPY would rally or not, but the EPP Ultimate Low setup suggested NOW is the time to buy.
So, I kept both downside and upside trades active to protect my account overnight.
The SPY rallied into the close, and I ended up making some nice profits off that EPP Ultimate Low.
Now, I'm going to wait to see what happens tomorrow morning and try to BOOK my upside trades in profits while letting my longer-term downside trades play out into early/mid May.
This is trading. The entire purpose of trading, like I trade, is to position for the best opportunities and try to catch the GIFTS the market throws at you as often as possible.
Nothing is guaranteed, but price ultimately shows us everything we need to know.
Watch this video to see if you understand the EPP Ultimate Low that prompted me to buy my CALLS today.
If so, then you are starting to GET IT, and that is a very big step towards improving your trading skills.
Get some.
#trading #research #investing #tradingalgos #tradingsignals #cycles #fibonacci #elliotwave #modelingsystems #stocks #bitcoin #btcusd #cryptos #spy #gold #nq #investing #trading #spytrading #spymarket #tradingmarket #stockmarket #silver

Nightly $SPY / $SPX Scenarios for April 22, 2025 🔮
🌍 Market-Moving News 🌍:
🚗 Tesla's Q1 Earnings on Watch: Tesla is set to report Q1 earnings after market close. Analysts expect EPS of $0.58 on $23.4B revenue. Investors are focused on delivery guidance, cost-cutting measures, and updates on the robotaxi program and Optimus robot. CEO Elon Musk faces pressure to refocus on Tesla amid concerns over his political engagements.
📉 Market Volatility Amid Tariff Concerns: U.S. markets remain volatile due to ongoing trade tensions. The S&P 500 has declined 14% from its February high, with investors closely monitoring corporate earnings for insights into the economic impact of recent tariffs.
📊 Key Data Releases 📊
📅 Tuesday, April 22:
🏠 Existing Home Sales (10:00 AM ET):
Forecast: 4.20 million
Previous: 4.38 million
Provides insight into the housing market's health and consumer demand.
📘 IMF Global Financial Stability Report (10:15 AM ET):
The IMF will release its latest assessment of global financial markets, focusing on systemic risks and financial stability.
⚠️ Disclaimer: This information is for educational and informational purposes only and should not be construed as financial advice. Always consult a licensed financial advisor before making investment decisions.
📌 #trading #stockmarket #economy #news #trendtao #charting #technicalanalysis

SPY repeat of ladle patternJust presenting what I see. Prices likely to be pulled back up to the LVN looking at good buy volume at close. However the days volume wasn't great because of the Europe holiday
Holidays ar common for whipsaw prices. With european markets open today, I wont be surprised if the market head back up for a day or two watch out for the resistance line
Safe trading

Noise, S&P Scenario, Gold BubbleThank you to the tradingview community for engaging and supporting my content.
After another rough start to the week, we have a bit of a crossroads ahead for the S&P
1) We revisit the April 7 lows and poke lower with bear trap opportunities
2) We hold Monday April 21 lows and grind back up to gap fill and revisit 5400-5500 resistance
3) We go nowhere with a lot of intraday volatility and noise (between the April 7 low and the April 9 high)
The markets are on high alert
DXY
Gold
Bitcoin
US Bonds vs Treasuries (yields rising)
Trump is more vocal about threatening the FED or firing Powell and the concern is truly unprecedented
Trade War pause is still ongoing, China is being vocal as well to make sure countries don't simply line up to support the US. For all of this to calm down, US and China have to play nice. China is likely able to hold the line longer than the US in the near-term
Thanks for watching!!!

Tears of Liberty. Lets Make America Sell Again.Over the past decade, the U.S. stock market has significantly outperformed global stock markets excluding the United States. This divergence in returns has been one of the defining features of global investing since 2015, with U.S. equities—especially large-cap technology stocks—driving much of the outperformance.
Annualized Returns (2015–2025)
AMEX:SPY , S&P 500 Index(U.S.):
The S&P 500 delivered an average annualized return of 13.8% over the past ten years.
NASDAQ:ACWX , MSCI All World ex U.S. (Rest of World):
Global stocks outside the U.S. returned an average of 4.9% annually over the same period
Year-by-Year Breakdown
Year | SPX | World ex U.S. | U.S. Surplus
2024 23.9% 4.7% +19.2%
2023 23.8% 17.9% +5.8%
2022 -19.6% -14.3% -5.4% (!)
2021 26.6% 12.6% +14.0%
2020 15.8% 7.6% +8.2%
2019 30.4% 22.5% +7.9%
2018 -6.6% -14.1% +7.5%
2017 18.7% 24.2% -5.5% (!)
2016 9.8% 2.7% +7.1%
2015 -0.7% -3.0% +2.3%
Key Drivers of Performance
U.S. Outperformance
The U.S. market’s dominance was driven largely by the rapid growth of technology giants (such as Apple, Microsoft, Amazon, and Alphabet), which benefited from strong earnings growth, global market reach, and significant investor inflows.
International Underperformance
Non-U.S. markets faced headwinds such as multiply choking sanctions and tariffs, slower economic growth, political uncertainty (notably in Europe), a stronger U.S. dollar, and less exposure to high-growth technology sectors.
Valuation Gap
By 2025, U.S. stocks are considered relatively expensive compared to their international counterparts, which may offer more attractive valuations going forward.
Recent Shifts (2025 Trend):
As of early 2025, international stocks have started to outperform the S&P 500, with European and Asian equities seeing renewed investor interest. Factors include optimism over economic recovery in China and strong performance in European defense and technology sectors.
Long-Term Perspective
Historical Context
While the past decade favored U.S. equities, this has not always been the case. For example, during the 2000s, international stocks outperformed the U.S. following the dot-com bust.
Market Weight
The U.S. accounts for roughly 60% of global stock market capitalization and about 25% of global GDP, so its performance has a substantial impact on global indices.
Conclusion
From 2015 to 2025, the U.S. stock market delivered nearly triple the annualized returns of global markets excluding the U.S., primarily due to the outperformance of large-cap technology stocks.
While this trend has persisted for most of the decade, early 2025 shows signs of a potential shift, with international equities beginning to close the performance gap. Investors should remain aware of valuation differences and the cyclical nature of global market leadership.
The main technical chart for U.S./ ex U.S. ratio indicates the epic reversal is in progress.

April 21st Trade Journal & Stock Market Analysis**April 21st Trade Journal & Stock Market Analysis**
EOD accountability report: +9335.75
Sleep: 8 hour, Overall health: tired
**Daily Trade Signals based on VX Algo System**
9:37 AM Market Structure flipped bearish on VX Algo X3
12:01 PM VXAlgo ES X1 Buy signal,
2:16 PM VXAlgo ES X1 Buy signal (double signal)
3:05 PM VXAlgo NQ X3 Buy Signal
3:31 PM Market Structure flipped bullish on VX Algo X3!

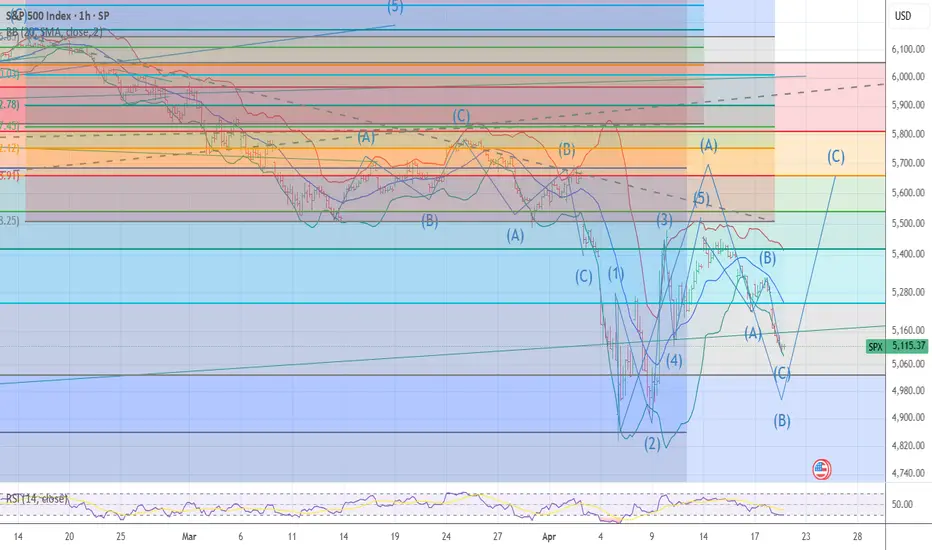
I am CALLING A BOTTOM TODAY I MOVED95% long 5109/5079 today The chart posted is the sp 500 I called for a sharp decline back to 5100 it has formed a ABC down I look for a sharp rally back to 5644/5669 Now before the next leg down today is wave Blow ,Best of trades WAVETIMER
Europe Vs US Break Out!This chart suggests huge long-term implications after breaking for the 2nd time this 16-year downtrend. EU since Trump took office has outperformed the US by 23%!
More than half of that has occurred since the ambush on Zeleneskyy in the Oval Office.
While no new high has been made yet to confirm, it is noteworthy that money may be flowing toward the EU more than the US for a decade or more.
EU has a much lower debt to GDO at 80% than the US at 125%. Stock valuations are much more attractive than in the US. So much so that I labeled the EU as a value trap. Not anymore!
The biggest obstacle right now is how much would a US recession impact the EU. Even if it does, I expect the EU to perform much better than the US. As such this chart should continue to outperform.
I have another post up you may want to follow.

$2.29 to $20.00 in massive +773% $UPXI while overall market redDoes it get any better than this? Finding a power runner stock of the day in early premarket which turns out to run $2 to $20 in about 2 hours while the rest of the market drops to new lows of the year?
NASDAQ:UPXI

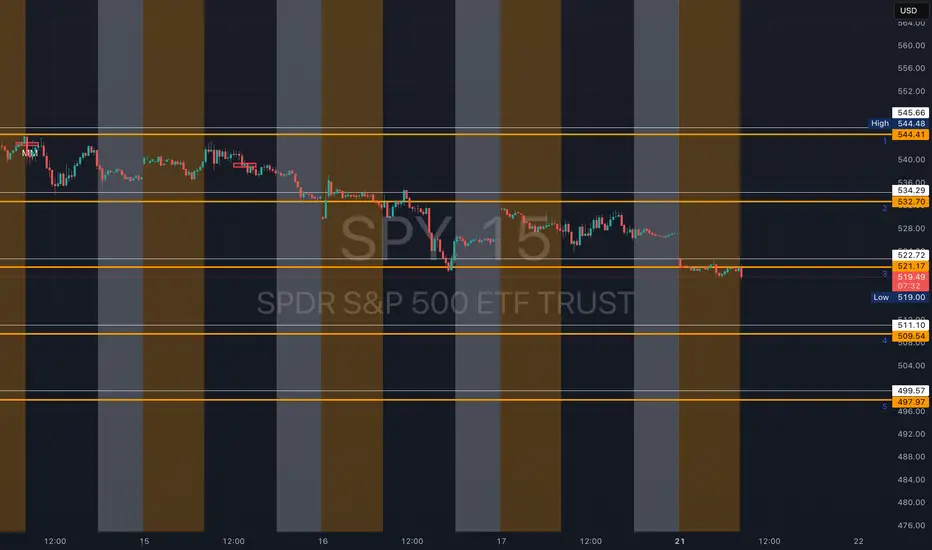
SPY - support & resistant areas for today April 21 2025These are Support and Resistance lines for today, April 21, 2025, and will not be valid for the next day. Mark these in your chart by clicking grab this below.
Yellow Lines: Heavily S/R areas, price action will start when closing in on these.
White Lines: Are SL, TP or Mid Level Support and Resistance Areas, these are traded if consolidation take place on them.
SPY/QQQ Plan Your Trade For 4-21 : Inside Breakaway PatternToday's Inside Breakaway pattern may not show up as I would expect.
An Inside Breakaway pattern suggests the OPEN will be within the Body range of the previous bar - I don't see that happening today.
The Breakaway portion of the pattern is much more likely to happen today with Gold/Silver moving much higher and BTCUSD moving slightly higher today. It appears Safe-Haven assets are THE THING right now.
That would suggest the US Dollar and US-Dollar based assed would continue to fall (move downward) as devaluation and contraction in the global economy continues to play out.
If you watched my video (posted late last night), you already know my data suggests there is almost no reason for the markets to mount a rally right now. The only thing I can see that would drive a big rally from these lows would be some incredible news that the world is immediately going back to somewhat normal in terms of GCB spending and Global Trade. I don't see that happening.
I know there are a lot of emotions related to these Tariff wars and global trade. Heck, almost anything that goes on in the world right now is full of emotions.
I urge all traders to STEP BACK. Think of the markets like an engine that runs on the quality of AIR, FUEL, SPARK, LUBRICATION, STRUCTURAL MECHANICAL PARTS, & INTAKE/OUTPUT CAPACITY.
If you start to think about the markets (global markets) as a big engine, while thinking of individual economies (by country) as smaller engines, it starts to make a little more sense (at least in my mind).
Every country runs its own engine (see the components above). If some of those components are failing, then that country's economy will falter a bit.
And that faltering economy may put additional pressure on the global economy/engine.
It takes a lot to destroy a functional economy. I mean A LOT. War, Total Destruction of government/law/society. Maybe even some type of internal conflict.
But, even then, the economy will still have roots and will fall back to core elements.
So, don't worry about all of these people telling you "the world is going to CRASH in the next 2 years because of Trump". That is highly unlikely.
What is more likely is that the world will "re-settle expectations" related to future growth and output. Strengthening economies where needed and building up the core elements of global trade/economies over many months.
So, if you are worried or don't know what to do right now, move your positions into CASH and wait it out a bit.
There will be lots of opportunities for you to pick the right time to start trading again.
There is no reason why you have to try to FORCE the markets to adhere to your wants (they never do that anyway).
Just wait it out, keep learning, and plan/time your trade efficiently.
Get some...
#trading #research #investing #tradingalgos #tradingsignals #cycles #fibonacci #elliotwave #modelingsystems #stocks #bitcoin #btcusd #cryptos #spy #gold #nq #investing #trading #spytrading #spymarket #tradingmarket #stockmarket #silver

Post-Easter Drift: Markets Hit the Snooze ButtonMonday will be the first proper day back in the saddle after a long Easter weekend.
The chocolate coma has almost worn off. Markets will be waking up. Kind of.
These post-holiday opens are notoriously sluggish. Volume’s light. Direction takes a while to reveal itself. And everyone’s pretending to care about macro while waiting for real price action to show up.
But we’ve already got our map.
And the Wolfe Wave that paid us last week? Still unfolding.
I’m sitting tight with a fresh cup of caffeine, watching the 5400 level as our bull/bear toggle… and waiting to see if Trump rage-tweets another black swan into existence before the bell rings.
We’re not here to chase headlines.
We follow the system that pays.
--
SPX analysis 22 April 2025
The Wolfe Wave setup we traded last week hasn’t invalidated and still has room to run. The projected target near 5000 remains in play, and we’re well within the structure for a continued grind lower.
The swing income trade is live. And because this is options – not directional heroism – we don’t need the full drop to get paid. But a fast tag of 5000 will certainly do us a favour on timing.
On the GEX front, things remain bearish:
5400 = resistance + gamma flip level
5250 = highest negative gamma magnet this week
No bullish flips yet, and no major hedging pressure being relieved
That leaves our plan unchanged:
Bear bias holds under 5400
Swings remain on
Be ready to reassess if we bounce or overshoot key levels
Business as usual. Let price confirm. Let the system trigger.
Patience to profits.
---
Expert Insights: (Trading Mindset for Today)
The strategy is simple:
Wait for the setup. Place the trade. Walk away.
The temptation today will be to force something just because it’s the first day back.
Don’t. You’re not paid to predict. You’re paid to follow the rules.
A calm trader with a plan outperforms a hyper trader with opinions.
Common Trading Mistake & How to Avoid It
❌ Confusing movement with opportunity
Just because the market opens doesn’t mean it’s ready to trade.
✅ Let the setup come to you
Rule-based trading means you wait for confirmation – not caffeine.
Fun Market Fact – When Gamma Gets Negative…
Did you know that negative gamma magnifies market moves?
Here’s how it works:
Dealers hedge in the same direction as price
That creates more volatility, not less
Which means… wild swings are more likely when GEX is negative
This is why we’re watching 5250 this week – it’s where gamma says “this way, please” (and dealers cry quietly behind the screens).
---
Rumour Has It…
Trump’s latest tweet simply read: “ SP:SPX = Sad. Bears win.” Futures dipped 0.3% before recovering.
5400 is now being described as “psychological resistance” – which means nobody has a clue but it sounds clever.
GEX models reportedly enrolled in therapy after being ignored all weekend.
(This section is entirely made-up satire. Probably.)

SPY -Europe closed. Jap deal failure. Big move todayEurope market being closed major traders from europe will be absent. This will allow big move in the USA market today. Also Japanese deal failure will sink the market
Market has again somewhat formed a Head-Shoulder pattern. Target for the week 498

SPY/QQQ Plan Your Trade For The Week Of April 20-25 : CautionI want to thank all of you for the great comments and questions over the past few months.
I'm very impressed by all of you and how well many of you are picking up my techniques to improve your trading results.
This video is more of a Pre-Week review - telling you why I expect the markets to trade/trend a certain way over the next 5 to 25+ days (or longer).
Additionally, I want to remind all of you my research goes much deeper (behind the scenes) than what you see in these Plan Your Trade videos.
I know many of you rely on my morning videos and some of you have messaged me about how important my videos are in helping you prepare for the day's price range/trend.
Ultimately, I started doing these Plan Your Trade videos to highlight my SPY Cycle patterns and to prove my research is accurate and helpful. Obviously, if my technology/techniques were failures, I would be hearing about it from lots of people by now.
But that is not the case. It appears my SPY Cycle Patterns and other techniques/tools are very well appreciated and are really helping traders learn to build better skills for greater success.
And that is what this is all about.
Remember, I've been lucky enough to rub shoulders with some of the greatest traders/minds on the planet for the past 35+ years. Sometimes, we would sit down for Coffee and share ideas. Sometimes, they would hire me to explore something they thought was important (coding/research). At other times, we would simply show up at an event together and chat about life and the markets.
I was lucky.
I got into this industry in the late 1980s (a long time ago) and have continued to learn new things and build my skills over the past 35+ years.
Now, I'm trying to share some of that knowledge with all of you so you can carry this information forward and make a real difference in your life (finding success while trading).
One of the biggest things I continue to try to teach all of you is PATIENCE.
Right now, the markets are in a unique phase (consolidation in a downward trend). You are going to have to learn to WAIT for the best trade setups and try not to force the markets do to what you want.
If you are not sure what to trade, sit on the CASH until you see a better opportunity.
OK. This week, after Easter, should be fairly quiet. Tax day and Easter usually fall fairly close to one another. This year, they were on the same week.
The markets are usually very flat near Tax Day - so don't expect much in terms of trending.
Volatility is still elevated. So, we may see some wild price action this week. Trade smaller amounts if you are still unsure about direction/setups.
Get some...
#trading #research #investing #tradingalgos #tradingsignals #cycles #fibonacci #elliotwave #modelingsystems #stocks #bitcoin #btcusd #cryptos #spy #gold #nq #investing #trading #spytrading #spymarket #tradingmarket #stockmarket #silver

A Broader Market Review...As we have all seen within the last month or so, the U.S. equity markets have been getting the worst ass whooping since 2020. And as much as we'd like to forget that absolute disaster, it does bring to thought the idea of buying general market funds (such as AMEX:SPY , NASDAQ:QQQ , or AMEX:DIA ) to gain a nice entry into the next bull market, whenever that may be. However, not everything is all smooth sailing. The unfortunate part of this market downturn is that no amount of technical astrology fortune-telling analysis could have predicted the market's reaction to the tariffs being levied on foreign nations. So we need to put our big-boy pants on and look at the market as if it isn't some automatic wealth generating pattern that points north-east all day long.
Let's start with the tariffs. Firstly, we know there has been a 90 day pause on all conforming countries most notably leaving out China. It's not like that's anything special, just almost all our crap is made there. Unfortunately, we are observing what may be the greatest economic error of our lifetimes.
For those who are lost, foreign governments DO NOT pay for the tariffs in the way we are told. The U.S. Government levies the tariffs on the exporter (Chinese companies in this case), who then pass it on to the buyer of the goods (think Walmart, Target, Apple, etc.), who then pass those charges onto YOU... Enjoy!
So with an attempt at a full blown trade war, which the U.S. cannot win nor even has the industrial strength or infrastructure to compete, we can expect the markets to completely do a Bald Eagle courtship nosedive into new lows as observed a few weeks ago. But what will the Creature from Jekyll Island think of this?
Well miraculously, Fed chairman Jerome Powell claimed that the Fed will NOT allow the tariffs to exacerbate inflation into new highs. Get that, the Federal Reserve will not allow economic movements that raise prices on an importing nation ( that's the United States by the way), to raise prices anymore. While he's at it, how about we just get no inflation ever since it's just that simple?
And as if that wasn't enough, Donald Trump called for Jerome Powell to lower rates for some reason, saying that Powell was too late on his economic movement at the Fed. As it turns out, our plan for strengthening the economy is to.... weaken the dollar? Not sure why that's the case but at least we will be able to borrow more money at a cheaper price, as if the United States doesn't already have a debt problem. The Fed lowering rates would of course open the possibility of getting yet another wave of quantitative easing which will most likely be observed further down the road. Another round of QE, along with rate cuts, will of course send the equity markets to new highs on top of a weaker dollar.
Speaking of a weaker dollar, we should lastly talk about the TVC:DXY which measures the comparative strength of the U.S. Dollar to other currencies. As it turns out in this scenario, the dollar is getting weaker and weaker every day, meaning that people are running from U.S. Debt like it's the plague. If we were going to get a weaker dollar, at least could we have a higher market to offset our inevitable losses? I guess not...
Here is the TVC:DXY 1D looking back into late 2024.
Lastly for what to expect out of the market. If the trade situation will all the tariffs and this neo-cold war cool down, we might see some tariff pauses or lowering which will of course fire the market into new highs. However, if the situation doesn't cool, our debt yields rise, the market is going to go south faster than a Canadian in December. On a positive note, macroeconomic events move slowly, so it should be clear when a turnaround is coming...

Weekly $SPY / $SPX Scenarios for April 21–25, 2025🔮 🔮
🌍 Market-Moving News 🌍:
🇺🇸 Tariff Fallout Deepens: Markets remain volatile as President Trump's recent tariff policies continue to unsettle investors. The S&P 500 is down 14% from its February peak, with recession fears escalating. Economists now estimate a 45% chance of a downturn within the next year, up from 25% previously.
🚗 Tesla's Anticipated Earnings: Tesla is set to report Q1 earnings on Tuesday. Options pricing suggests a potential 9.3% stock movement post-report. Investors are keenly awaiting updates on AI initiatives, including the robotaxi network and the Optimus humanoid robot.
🛢️ Oilfield Services Under Pressure: Halliburton, Baker Hughes, and SLB will release earnings this week amid declining oil prices and tariff-induced cost pressures. Analysts warn that sustained crude prices below $60 could lead to a 20% drop in domestic oilfield activity.
📊 Key Data Releases 📊
📅 Monday, April 21:
No major economic data releases scheduled.
📅 Tuesday, April 22:
🏠 Existing Home Sales (10:00 AM ET):
Forecast: 4.20 million
Previous: 4.38 million
Provides insight into the housing market's health and consumer demand.
📅 Wednesday, April 23:
📊 S&P Global Manufacturing & Services PMI (9:45 AM ET):
Forecast: Manufacturing 49.5; Services 51.0
Previous: Manufacturing 49.2; Services 50.8
Indicates the economic health of the manufacturing and services sectors.
📈 New Home Sales (10:00 AM ET):
Forecast: 675,000
Previous: 662,000
Measures the number of newly constructed homes sold, reflecting housing market trends.
📘 Federal Reserve Beige Book (2:00 PM ET):
Provides a summary of current economic conditions across the 12 Federal Reserve Districts.
📅 Thursday, April 24:
📉 Durable Goods Orders (8:30 AM ET):
Forecast: -0.5%
Previous: 1.3%
Reflects new orders placed with domestic manufacturers for delivery of factory hard goods.
📈 Initial Jobless Claims (8:30 AM ET):
Forecast: 230,000
Previous: 223,000
Indicates the number of individuals filing for unemployment benefits for the first time.
📅 Friday, April 25:
📊 University of Michigan Consumer Sentiment Index (10:00 AM ET):
Forecast: 76.5
Previous: 77.2
Assesses consumer confidence in economic activity.
⚠️ Disclaimer: This information is for educational and informational purposes only and should not be construed as financial advice. Always consult a licensed financial advisor before making investment decisions.
📌 #trading #stockmarket #economy #news #trendtao #charting #technicalanalysis
