Nightly $SPY / $SPX Scenarios for April 3, 2025🔮 🔮
🌍 Market-Moving News 🌍:
🇺🇸📈 President Trump's 'Liberation Day' Tariffs Implemented: On April 2, President Donald Trump announced a series of new tariffs, referred to as "Liberation Day" tariffs, aiming to address trade imbalances. These include a baseline 10% tariff on all imports, with higher rates for specific countries: 34% on Chinese goods, 20% on European Union products, and 25% on all foreign-made automobiles. The administration asserts these measures will revitalize domestic industries, though critics warn of potential price increases for consumers and possible retaliatory actions from affected nations.
📊 Key Data Releases 📊
📅 Thursday, April 3:
📉 Initial Jobless Claims (8:30 AM ET):
Forecast: 225,000
Previous: 224,000
Measures the number of individuals filing for unemployment benefits for the first time during the past week, providing insight into the labor market's health.
📈 Trade Balance (8:30 AM ET):
Forecast: -$76.0 billion
Previous: -$131.4 billion
Indicates the difference in value between imported and exported goods and services, reflecting the nation's trade activity.
🏢 ISM Services PMI (10:00 AM ET):
Forecast: 53.0
Previous: 53.5
Assesses the performance of the services sector; a reading above 50 suggests expansion.
⚠️ Disclaimer: This information is for educational and informational purposes only and should not be construed as financial advice. Always consult a licensed financial advisor before making investment decisions.
📌 #trading #stockmarket #economy #news #trendtao #charting #technicalanalysis
SPDR S&P 500 ETF (SPY)

Using The CRADLE Pattern To Time/Execute TradesThis simple video highlights one of my newest pattern definitions - the Cradle Pattern.
In addition to the many other patterns my technology identified, this Cradle Pattern seems to be a constant type of price construct.
I'm sharing it with all of you so you can learn how to identify it and use it for your trading.
Ideally, this pattern represents FLAGGING after a trend phase.
It is a consolidation of price within a flag after a broad trending phase.
It usually resolves in the direction of the major trend, but can present a very solid reversal trigger if the upper/lower pullback range is broken (see the examples in this video).
Learn it. Use it.
Price is the ultimate indicator.
Learn to read price data more efficiently to become a better trader.
Get some.
#trading #research #investing #tradingalgos #tradingsignals #cycles #fibonacci #elliotwave #modelingsystems #stocks #bitcoin #btcusd #cryptos #spy #gold #nq #investing #trading #spytrading #spymarket #tradingmarket #stockmarket #silver

SPY/QQQ Plan Your Trade Update Update For 4-2 : ConsolidationThis quick update shows why I believe the SPY/QQQ will struggle to make any big move as long as we stay within the 382-618 "Battle Zone".
The SPY continues to rally up into this zone and stall out. If the SPY stays within this zone, I believe the markets will simply roll around in a tight range and go nowhere today.
Thus, I published this article to warn traders not to expect any big trends until we breakout - away from this Fibonacci "Battle Zone".
You can't kick the markets to make it go anywhere. And, unless you are trading very short-term swings in price - you are probably better off sitting on the sidelines waiting for a broad market trend to establish.
This is a warning. As long as we stay in the Fibonacci "Battle Zone", price will struggle to build any major trend.
So, play your trades accordingly - or just take a break from trading while you wait for the markets to roll out of the "Battle Zone".
Get some.
#trading #research #investing #tradingalgos #tradingsignals #cycles #fibonacci #elliotwave #modelingsystems #stocks #bitcoin #btcusd #cryptos #spy #gold #nq #investing #trading #spytrading #spymarket #tradingmarket #stockmarket #silver

SPY/QQQ Plan Your Trade For 4-2 : GAP Reversal Counter TrendToday's pattern suggests price may attempt to move downward in early trading, trying to find support near recent lows, then potentially roll a bit higher.
I do expect price to move into a downward price trend - attempting to break below the 549 price level and targeting the 535-545 target Fib level this week.
Today, Thursday, and Friday are all GAP/Breakaway types of patterns. So we should be entering an expansion of price trend and I believe that trend will be to the downside.
Gold and Silver are nearing a Flag Apex level. Very exciting for a potential breakout rally driving Gold up above $3250 and Silver up above $36.
I personally believe there is nothing stopping Gold and Silver in this rally phase until Gold reaches levels above $4500. GET SOME.
BTCUSD had a very interesting spike low. I still believe BTCUSD will roll downward - targeting the $76-78k level, then break downward towards the $60k level. Time will tell.
The rest of this week should be very exciting with the Breakaway and GAP patterns.
Get some.
#trading #research #investing #tradingalgos #tradingsignals #cycles #fibonacci #elliotwave #modelingsystems #stocks #bitcoin #btcusd #cryptos #spy #gold #nq #investing #trading #spytrading #spymarket #tradingmarket #stockmarket #silver

Wall Street vs GoldZilla. The End of 'Irrational Exuberance' Era"Irrational exuberance" is the phrase used by the then-Federal Reserve Board chairman, Alan Greenspan, in a speech given at the American Enterprise Institute during the dot-com bubble of the 1990s. The phrase was interpreted as a warning that the stock market might be overvalued.
Origin
Greenspan's comment was made during a televised speech on December 5, 1996 (emphasis added in excerpt)
Clearly, sustained low inflation implies less uncertainty about the future, and lower risk premiums imply higher prices of stocks and other earning assets. We can see that in the inverse relationship exhibited by price/earnings ratios and the rate of inflation in the past. But how do we know when irrational exuberance has unduly escalated asset values, which then become subject to unexpected and prolonged contractions as they have in Japan over the past decade?
Greenspan wrote in his 2008 book that the phrase occurred to him in the bathtub while he was writing a speech.
The irony of the phrase and its aftermath lies in Greenspan's widely held reputation as the most artful practitioner of Fedspeak, often known as Greenspeak, in the modern televised era. The speech coincided with the rise of dedicated financial TV channels around the world that would broadcast his comments live, such as CNBC. Greenspan's idea was to obfuscate his true opinion in long complex sentences with obscure words so as to intentionally mute any strong market response.
The phrase was also used by Yale professor Robert J. Shiller, who was reportedly Greenspan's source for the phrase. Shiller used it as the title of his book, Irrational Exuberance, first published in 2000, where Shiller states:
Irrational exuberance is the psychological basis of a speculative bubble. I define a speculative bubble as a situation in which news of price increases spurs investor enthusiasm, which spreads by psychological contagion from person to person, in the process amplifying stories that might justify the price increases, and bringing in a larger and larger class of investors who, despite doubts about the real value of an investment, are drawn to it partly by envy of others' successes and partly through a gamblers' excitement.
The main technical graph represents a value of S&P500 Index in Gold troy ounces (current value 1.81 at time of writing this article), indicates that effusive Bull stock market goes collapsing.
--
Best wishes,
Your Beloved @PandorraResearch Team 😎

March Was Boring. April Could BiteMarch Was Boring. April Could Bite | SPX Analysis 02 April 2025
At the risk of sounding like a scratched CD (or whatever the Spotify kids call repetition), yes – I’m still bearish.
Some might say I’m stubborn.
I say I just know a pattern when I see one.
And while March was about as exciting as watching paint dry in slow motion on a frozen chart... April's already teased a shift. Tuesday’s 0-DTE win added a bit of grease to the gears – finally. Movement. Profit. Action.
But I’m not celebrating yet.
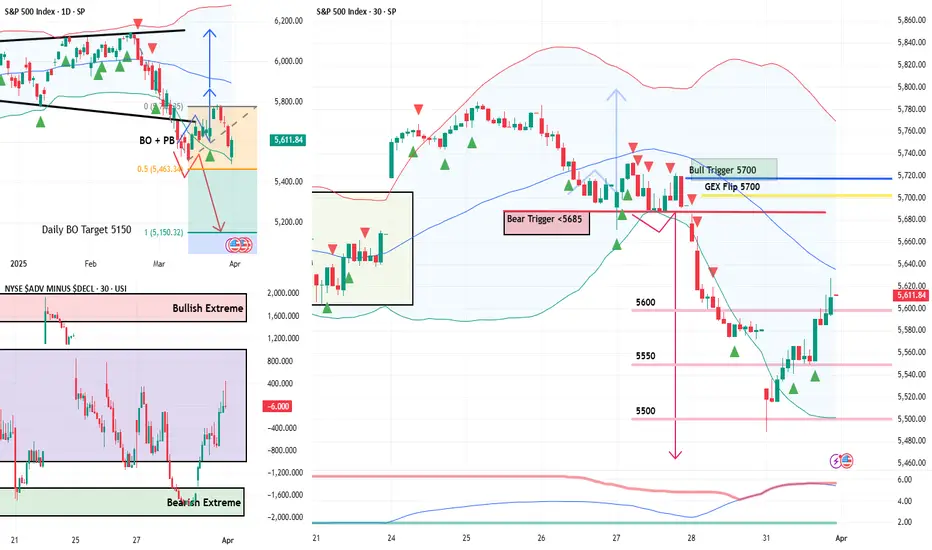
My stance is clear: bullish above 5700, bearish below. Until we break out, I’m scanning for pulse bar setups, especially if price cracks below 5500 – that’s where things get spicy.
And with Friday’s NFP looming on the calendar, the market may be about to wake up and pick a direction.
I know which way I’m leaning.
Bear slippers are still on.
---
Why April Could Be a Whole New Beast
Here’s the rundown:
March = sideways snoozefest.
April = already triggered a 0-DTE win.
My trigger line for flipping bull remains 5700 – it’s the GEX flip, flag failure, and no-go zone.
I’m watching for bearish pulse bars, ideally on:
Morning setups
Under 5500
With volatility in play
Should we crack those levels with strong momentum, I’ll look to compound into existing bear swings, leaning on the mechanical setups that’ve done the job before.
This week’s X-factor?
Friday’s Non-Farm Payroll report.
Could be a nothing-burger.
Could be the matchstick that lights the whole thing up.
Either way, I’ll be ready.
---
Expert Insights – Don’t Let Boredom Trade for You
One of the most common trader traps?
Forcing trades when the market isn’t doing anything.
Here’s how to avoid it:
✅ Patience is a position.
Waiting for clarity is a valid strategy.
I didn’t force anything through March – and I’m better for it.
✅ Setups still work – just less frequently.
Your system isn’t broken… the market was just asleep.
✅ The pros aren’t hunting trades every day – they’re waiting for the ones worth taking.
That’s how the SPX Income System works – clear triggers, no second-guessing.
---
Fun Fact - April: Historically Strong… Unless March Fails First
The month of April is historically one of the strongest for the S&P 500, averaging gains of 1.5% since 1950.
But guess what?
Most of that strength happens after a strong March.
When March is slow or bearish… April tends to flip the script.
So don’t be surprised if volatility roars back this week – just be ready.
---
Video & Audio Podcast
Coming Soon on main blog...
Happy trading,
Phil
Less Brain, More Gain
…and may your trades be smoother than a cashmere codpiece
---
p.s. Ready to stop scratching your head and start stacking profits?
If you want to trade with clarity – not confusion – then it’s time to get serious about structure.
Join the Fast Forward Mentorship – trade live, twice a week, with me and the crew. PLUS Monthly on-demand 1-2-1's
Or watch the free training to see the SPX Income System in action.
No fluff. Just profits, pulse bars, and patterns that actually work.
Links In Bio

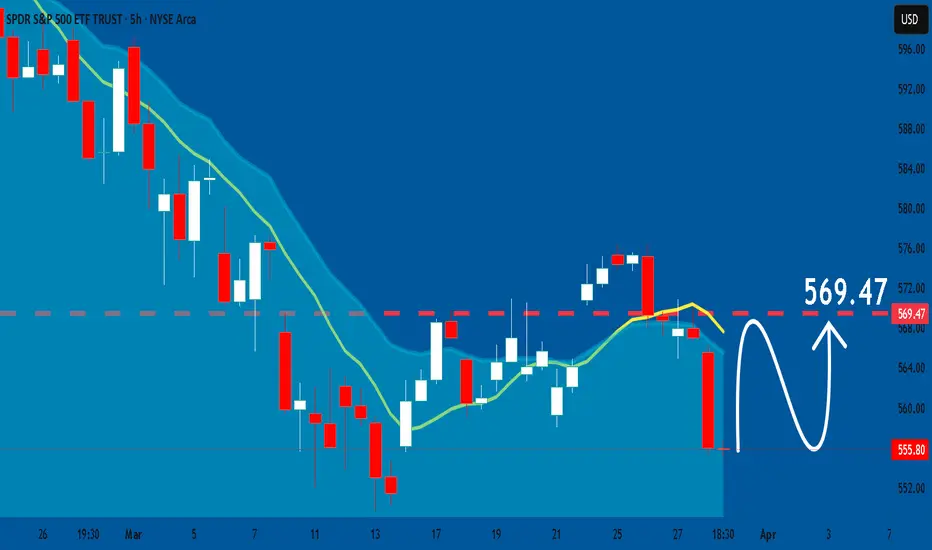
SPY Divergence - Bullish Comeback?SPY is showing quite a significant bullish divergence on the Daily timeframe. This appears to concur with a potential double-bottom formation. We also see the RSI beginning to poke up through it's moving average:
Alongside this we see a Rug Pull target on the 4h timeframe of the ES1! S&P futures ticker.
Rug-pull events on this ticker have seen a great degree of accuracy over the past few years, as seen below:
This rug-pull target alongside strong divergence on the higher timeframes indicates a high probability the markets will trend towards the upside in the near future.

Nightly $SPY / $SPX Scenarios for April 2, 2025 🔮 🔮
🌍 Market-Moving News 🌍:
🇺🇸📈 President Trump’s 'Liberation Day' Tariff Announcement: President Donald Trump is set to announce new reciprocal tariffs on April 2, aiming to align U.S. import duties with those imposed by other countries on American goods. This move is expected to impact various sectors, including automotive and manufacturing, and may lead to market volatility as investors react to potential shifts in trade policies.
📊 Key Data Releases 📊
📅 Wednesday, April 2:
🏭 Factory Orders (10:00 AM ET):
Forecast: 0.6%
Previous: 1.7%
Indicates the dollar level of new orders for both durable and non-durable goods, reflecting manufacturing demand.
⚠️ Disclaimer: This information is for educational and informational purposes only and should not be construed as financial advice. Always consult a licensed financial advisor before making investment decisions.
📌 #trading #stockmarket #economy #news #trendtao #charting #technicalanalysis

FULL MOON and SPYHello traders! One of the great legends, OSHO, explains that if the moon has enough power to cause turbulence in the oceans, then why can't it affect human beings thinking and behaviors when the human body is made up of roughly 60% water? OSHO further explains that in history many people have been enlightened and many become mentally disturbed on days like a FULL MOON, and he explained that there must be a connection between planets positions and human behaviors.
Now, if it comes to trading SPY based on the moon phases, then I have backtested a few full-moon dates, and I have found something interesting that makes me think of incorporating a full-moon strategy while trading SPY/SPX or any other major index. I am not promoting astrology or abnormal ideas, but I want to share my research with you all because I found a connection and patterns in the behavior of SPY and the full moon. You are not forced to think about astrology in trading, but having knowledge and the ability to see patterns in the world can help you build your intuitive thinking and deep subconscious knowledge.
This year, taking Los Angeles as a reference, full moon dates were on Jan 13, Feb 12, and March 13. On January 13, the price showed a bullish run all day with low and high points of about 575.36 and 581.69, respectively. The similar bullish run was observed on February's full moon day, i.e., on 12th February, when SPY showed a low of 598.41 and a high of 604.52, making the market bullish all day. In contrast, we have observed a sharp decline in SPY on March 13, 2025 (full moon), which could seem to invalidate the full-moon strategy, but in the long run, SPY and the SPX Index remain bullish most of the time.
Carefully observing previous year (2024) full-moon dates, I have found that SPY opened 4 times gap-up on full moon dates (May 23 2024, July 21 2024 (market off but gap-up next session), October 17 2024, December 15 2024 (market off but gap-up next trading session). 5 times out of 12 were classified as bullish to strongly bullish: January 20 2024 (Bullish after 11:00 AM PST), March 25 2024 (sideways market but bullish overall), April 23 2024 (Bullish), August 19 2024 (bullish), and September 18 2024 (bullish after 9:00 AM PST). The market remains gap-down and bearish two times on February 24 2024, and on November 15 2024.
Now, since I have found that the SPX Index remains bullish on most of the FULL MOON dates, and the chances of a gap-up opening on or the next day of the FULL MOON (in case the market is closed on the FULL MOON) are very high based on the results obtained from the PY 2024 and 2025 previous months. The next FULL MOON is on Saturday, 12th April 2025, and the market is closed on this date; therefore, on 14th April 2025, if the market repeats itself, then I can expect SPY to open gap-up, and it would be interesting to see if FULL MOON really has the power to influence the stock market. Let’s give it a try, and on 11th April, 2025, if the market gives signs of huge buying pressure, then I will be buying some calls expiring April 14th, 2025, to test the full moon strategy.
I am the only writer of this article, so there are high chances that I might have made some mistakes while publishing. Therefore, I would be happy to see if you can correct me if I'm wrong or if you can share your own knowledge and insights about the relationship between MOON and SPY. Thoughts and comments?

Daily Trade Recap based on VX Algo SystemEOD accountability report: +$446.25
Sleep: 10 hour, Overall health: Meh
**Daily Trade Recap based on VX Algo System **
9:30 AMVXAlgo ES 10M Sell Signal
2:57 PM VXAlgo NQ 10M Buy Signal

SPY/QQQ Plan Your Trade For 4-1-25 : Temp Bottom PatternToday's pattern suggests the SPY/QQQ will attempt to find temporary support near recent lows or a bit lower.
I'm not expecting much in terms of price trending today. I do believe the downward price trend will continue today with the SPY attempting to move down to the 548-550 level trying to find support.
The QQQ will likely attempt to move downward toward the 458-460 level trying to find the support/base/bottom level today.
Gold and Silver are in a moderate consolidation phase that I believe is transitioning through a Flag-Trend-Flag-Trend-Flag-Trend type of phase. Ultimately, the trend will continue to push higher through this phase as metals have moved into the broad Expansion phase. This phase should see gold attempt to move above $4500+ before the end of May/June 2025.
BTCUSD is rolling within the 0.382 to 0.618 Fibonacci price levels related to the last price swing. I see this middle Fib level and the "battle ground" for price. I expect price to stall, consolidate, and roll around between these levels trying to establish a new trend.
Thus, I believe BTCUSD will move downward, attempting to move back down to the $78,000 level.
Nothing has really changed in my analysis except that we are experiencing a 48-96 hour consolidation phase before we move back into big trending.
Play smart. Position your trades so that you can profit from this rolling price trend and prepare for the bigger price move downward (targeting the bigger base/bottom near April 15, 2025).
Get some.
#trading #research #investing #tradingalgos #tradingsignals #cycles #fibonacci #elliotwave #modelingsystems #stocks #bitcoin #btcusd #cryptos #spy #gold #nq #investing #trading #spytrading #spymarket #tradingmarket #stockmarket #silver

Don’t Let a Green Candle Fool YouDon’t Let a Green Candle Fool You | SPX Analysis 01 April 2025
We got the “boing” – but not the bounce that changes anything meaningful.
Monday opened like a trap door - gap down, quick poke near 5500, and then a full day of rallying that had CNBC anchors high-fiving like they just called the bottom of the century.
Except… they didn’t.
We’ve seen this act before. One-day rallies that puff up like a balloon, then vanish. And just like before, I’m not chasing a single green candle or headline optimism. I’m not a bull until 5700 is reclaimed - simple as that. That’s the bear flag failure point, the GEX pivot, and my personal line in the sand.
So while the crowd celebrates a maybe-double-bottom, I’m keeping my slippers firmly on the bear side of the wardrobe. And if Monday proved anything, it’s this…
Sometimes, the trades you forget about end up being the ones that pay.
This Bounce Doesn’t Fool Me – Here's Why I’m Still Short
Let’s call it what it is: a rally inside a bearish structure. Until we break the top of that structure, it’s just noise.
Here’s what really matters:
Monday gapped down, dropped toward 5500, and then staged a rally.
Everyone’s calling “double bottom!” - but I’ve seen more convincing bottoms on a bowling ball.
These reversal days have been common lately – I counted five in the last six weeks.
We’re still under 5700, which is the GEX flip, the flag failure, and the bullish invalidation.
That means I’m still riding:
Bear Swing #1 – opened last week, still on.
New aggressive shorts – 10-min bearish Tag ‘n Turn below 5500 only.
Bonus: A Forgotten Trade Hit Target on Monday
You’ll love this.
I had a bearish swing from around 20 March. Honestly, I forgot about it. Wrote it off. It was gathering dust in the corner of my options book.
Then, boom – Monday open… "Order Filled".
Target hit. Gap did the job. Payout in the pocket.
It’s a reminder every trader needs:
“It ain’t over until expiration… and sometimes not even then.”
GEX Analysis Update
Whole and half numbers acting as support and resistance
Expert Insights: Avoid These Rookie Mistakes
❌ Mistake #1: Getting Sucked Into Green Candles
Just because the market bounced doesn’t mean it’s time to flip bull. Watch the levels, not your feelings.
❌ Mistake #2: Cancelling Too Early
The Trade’s Not Over Just Because You’re Bored
Most traders kill good trades because they get impatient.
They cancel too soon. They “manage the trade” to death. Or worse, they chase a green candle and flip bias on a whim.
Here’s what Monday reminded us:
✅ Let the trade breathe.
That bear swing from 20 March? Forgotten. Ignored. Hit target anyway.
✅ Stick to your plan, not your mood.
The market rallied. But did it change the structure? No. Still below 5700. Still bearish bias.
✅ A good trade doesn’t need your babysitting.
Set the rules. Place the trade. Walk away. Check back later with a smile.
The traders who win are the ones who stop trying to outsmart their own system.
---
Fun Fact
In 1999, a 15-year-old stock trader named Jonathan Lebed made over $800,000 pumping penny stocks from his bedroom... before the SEC came knocking.
Moral of the story? Markets will always reward confidence, consistency, and a little bit of cunning – but it’s the trader who sticks to a rule-based system who lasts beyond the headlines.
Nightly $SPY / $SPX Scenarios for April 1, 2025🔮 🔮
🌍 Market-Moving News 🌍:
🇺🇸📈 ISM Manufacturing PMI Release: The Institute for Supply Management (ISM) will release its Manufacturing Purchasing Managers' Index (PMI) for March. A reading below 50 indicates contraction in the manufacturing sector, which could influence market sentiment.
🇺🇸🏗️ Construction Spending Data: The U.S. Census Bureau will report on February's construction spending, providing insights into the health of the construction industry and potential impacts on related sectors.
🇺🇸📄 Job Openings Report: The Job Openings and Labor Turnover Survey (JOLTS) for February will be released, offering a view into labor demand and potential implications for wage growth and consumer spending.
📊 Key Data Releases 📊
📅 Tuesday, April 1:
🏭 ISM Manufacturing PMI (10:00 AM ET):
Forecast: 49.5%
Previous: 50.3%
Assesses the health of the manufacturing sector; a reading below 50% suggests contraction.
🏗️ Construction Spending (10:00 AM ET):
Forecast: 0.3%
Previous: -0.2%
Measures the total value of construction work done; indicates trends in the construction industry.
📄 Job Openings (10:00 AM ET):
Forecast: 7.7 million
Previous: 7.7 million
Provides insight into labor market demand by reporting the number of job vacancies.
⚠️ Disclaimer: This information is for educational and informational purposes only and should not be construed as financial advice. Always consult a licensed financial advisor before making investment decisions.
📌 #trading #stockmarket #economy #news #trendtao #charting #technicalanalysis

SPY/QQQ Plan Your Trade EOD Update : Rejecting The BreakdownDoes this big rejection bar mean the selling trend is over?
I doubt it.
In my opinion and experience, big rejection bars like this reflect a critical price level where the markets will attempt to REVISIT in the near future.
Normally, when we get a big rejection bar, like today, we are testing a critical support/resistance level in price and you can see the difference between the SPY, DIA and QQQ charts.
The QQQ price data is already below the critical support level and barely trying to get back above the rejection level. Whereas the SPY and DIA are still above the rejection lows.
I see this as a technology driven breakdown and because of the continued CAPTIAL SHIFT, we may move into a broader WAVE-C breakdown of this current trend.
I see the SPY already completing a Wave-A and Wave-B. If this breakdown plays out like I expect, we'll see a bigger breakdown in price targeting $525-535, then possibly reaching $495-505 as the immediate ultimate low.
If you follow my research, there is a much lower level near $465-475 that is still a likely downward target level, but we'll have to see how price reacts over the next 2+ days before we can determine if that level is still a valid target.
Watch for more support near recent lows tomorrow, then a potential breakdown in the SPY/QQQ/DIA.
Get some.
#trading #research #investing #tradingalgos #tradingsignals #cycles #fibonacci #elliotwave #modelingsystems #stocks #bitcoin #btcusd #cryptos #spy #gold #nq #investing #trading #spytrading #spymarket #tradingmarket #stockmarket #silver

INVERSE CUP AND HANDLE $TSLA TO $120 The inverted cup and handle, also known as the upside-down cup and handle pattern, is a bearish chart formation that can occur in both uptrends and downtrends. Unlike the traditional bullish cup and handle pattern, this inverse pattern features two key components: the "cup," which forms an inverted U-shape, and the "handle," a brief upward retracement following the cup.
Sell NASDAQ:TSLA right now with fact check:
brand reputation risk, high competition, loss of EV market leadership, cyber truck/ product recalls, declining sales with lower margin, stock volatility concern, insider selling, investors buy it based on expected future earnings rather than its current profitability.
+ Head and shoulder/ inverse cup and handle, P/E ratio 79.8-161.23 (overpriced), falling knife, dead cat bounce, the lowest target estimate stands at $120.00, below the 50-day, 100-day, and 200-day moving averages, MACD indicator is -19.8, bearish signals.
+ potential stagflation, tariff war, slow economic growth, inflation, rising public debt, geopolitical tensions, ai bubble, and more

SPY/QQQ Plan Your Trade For 3-31 : Carryover PatternToday's pattern suggests the SPY/QQQ will attempt to carryover Friday's selling trend.
I do believe the SPY/QQQ will attempt to find some support as we move into a Temp Bottom pattern tomorrow. So be aware that the SPY/QQQ may attempt to find support near 535-540/450-455 over the next few days.
I would also urge traders to not get very aggressive in terms of trying to pick a bottom in this downtrend.
In my opinion, I don't see any reason why anyone should be buying into this breakdown unless you are prepared to take a few big lumps. Just wait it out - wait for a base/bottom to setup.
Gold and Silver are moving higher and I believe this trend will continue for many weeks/months.
BTCUSD should continue to move downward - trying to establish the Consolidation Phase range.
As we move into trading this week. Be aware that Tuesday/Wednesday of this week are more ROTATION type days. They may be wide-range days - but they are still going to be ROTATIONAL.
Get some.
#trading #research #investing #tradingalgos #tradingsignals #cycles #fibonacci #elliotwave #modelingsystems #stocks #bitcoin #btcusd #cryptos #spy #gold #nq #investing #trading #spytrading #spymarket #tradingmarket #stockmarket #silver

Bear Hedge Trigger Hit - It’s Risk-Off This WeekBear Hedge Trigger Hit - It’s Risk-Off This Week | SPX Analysis 31 Mar 2025
Well, it’s officially the start of a new week... and the end of the month. A time when markets often go a bit boing-boing as portfolio managers do their monthly “window dressing.” But let’s not get distracted by the glitter - Friday’s price action just ripped the rug out from under the bulls.
My SPX slippers barely had time to get comfy before I was forced to swap them for spiked bear boots. Again.
Friday’s break through my bear hedge trigger flipped the script, and now I’m locked into bear mode until the charts convince me otherwise. And right now? They’re not even trying.
---
Bear Flag Breakdown: What the Charts Are Screaming 🐻
Let’s break it down trader-to-trader...
Friday’s move confirmed the break of a textbook bear flag.
My target for this bear swing now sits at 5140, and unless we break above 5700, the bear case remains fully intact.
Short-term? I'm bearish through 5500, watching 5555 as a gamma inflection point which could accelerate the bear move.
Here’s what makes this particularly spicy:
Overnight futures are down nearly 1% - not the Monday morning bounce you’d expect if bulls were in charge.
GEX is stacked with puts - if we breach 5555, market makers may accelerate the drop by hedging and reducing positive gamma exposure.
Momentum is gaining. And it feels like we’ve seen this film before...
🎞️ Rewind to 2022…
Remember that slow grind lower in 2022 where every bounce got sold, and traders kept trying to “buy the dip” only to get steamrolled?
Yeah. This move is shaping up the same way.
A pattern break. A bearish continuation. And if we follow the 2022 script... buckle up. The bears may just be getting started, and the rest of the year could get nasty.
---
Expert Insights: Avoid These Bear Market Mistakes
🔻 Mistake #1: Trading What You Hope Will Happen
Stop “buying the dip” because you want it to bounce. Trade what’s in front of you.
🔻 Mistake #2: Using the Wrong System for This Environment
Bullish systems don’t work in bear trends. You need a mechanical system that thrives on volatility (like mine).
---
Fun Fact
In 2018, the S&P 500 plunged nearly 20% in December alone, marking one of the worst year-end sell-offs in history. The culprit? A mix of Fed tightening and market-wide panic.
🧐 Fast forward to today… and while the catalyst may differ, market structure patterns have a funny way of rhyming, don’t they?

SPY divergenceI see a lot of divergence in the SPY.
Looks like a push into trend-line support for me then we add tier 3 buys.

$KRE CRASH COMING ... Not yet tho..we'll find out..Regional Banks seem to be heading on a slippery path identical to the most previous crash pattern back when they needed all the loan Bailouts. Now that all the loans have stopped, I'm sure some banks may be heading towards loan restructuring perhaps, maybe defaults, I'm not sure honestly. I just know that the chart never lies and I've been watching and waiting for a long while. I predicted the first crash back then and I currently have no doubts with the current chart ahead of me. As always, I will do my best to provide the best insight possible into these speculations. Currently we have the Daily breaking trend and the bar count getting close to the previous 141 bars. The only difference is that we bounce off the 100% retracement. If we continue to lose the 1.27, we'll be headed for the 1.61..... updates soon.

SPY: SPY looking a bit like scary hour? Continuous tariff new’s scaring the market. Many continue to say Bearish then some say Bullish.
Looking like it can retest the demand zone I see at the 1M at 584.83 but today 3/30 on AH looks like things may be gapping down already.
What are your thoughts?

Weekly $SPY / $SPX Scenarios for March 31 – April 4, 2025🔮 🔮
🌍 Market-Moving News 🌍:
🇺🇸📈 Anticipated U.S. Jobs Report: The March employment data, set for release on Friday, April 4, is expected to show a slowdown in job growth, with forecasts predicting an increase of 140,000 nonfarm payrolls, down from 151,000 in February. The unemployment rate is projected to remain steady at 4.1%. This report will be closely monitored for signs of economic momentum and potential impacts on Federal Reserve policy.
🇺🇸💼 President Trump's Tariff Announcement: President Donald Trump is scheduled to unveil his "reciprocal tariffs" plan on Wednesday, April 2, dubbed "Liberation Day." The announcement is anticipated to include a 25% duty on imported vehicles, which could significantly impact the automotive industry and broader market sentiment. Investors are bracing for potential volatility in response to these trade policy developments.
🇺🇸📊 Manufacturing and Services Sector Updates: Key indicators for the manufacturing and services sectors are due this week. The ISM Manufacturing PMI, scheduled for Tuesday, April 1, is expected to show a slight contraction with a forecast of 49.5%, down from 50.3% in February. The ISM Services PMI, set for release on Thursday, April 3, is projected at 53.0%, indicating continued expansion but at a slower pace. These reports will provide insights into the health of these critical sectors.
MarketWatch
📊 Key Data Releases 📊
📅 Monday, March 31:
🏭 Chicago Business Barometer (PMI) (9:45 AM ET):
Forecast: 45.5
Previous: 43.6
Measures business conditions in the Chicago area, with readings below 50 indicating contraction.
📅 Tuesday, April 1:
🏗️ Construction Spending (10:00 AM ET):
Forecast: 0.3%
Previous: -0.2%
Indicates the total amount spent on construction projects, reflecting trends in the construction industry.
📄 Job Openings (10:00 AM ET):
Forecast: 7.7 million
Previous: 7.7 million
Provides insight into labor demand by measuring the number of job vacancies.
📅 Wednesday, April 2:
🏭 Factory Orders (10:00 AM ET):
Forecast: 0.6%
Previous: 1.7%
Reflects the dollar level of new orders for both durable and non-durable goods, indicating manufacturing demand.
📅 Thursday, April 3:
📉 Initial Jobless Claims (8:30 AM ET):
Forecast: 226,000
Previous: 224,000
Measures the number of individuals filing for unemployment benefits for the first time, providing insight into labor market conditions.
📊 Trade Balance (8:30 AM ET):
Forecast: -$123.0 billion
Previous: -$131.4 billion
Indicates the difference between exports and imports of goods and services, reflecting the nation's trade activity.
📅 Friday, April 4:
💵 Average Hourly Earnings (8:30 AM ET):
Forecast: 0.3%
Previous: 0.3%
Measures the change in earnings per hour for workers, indicating wage inflation.
⚠️ Disclaimer: This information is for educational and informational purposes only and should not be construed as financial advice. Always consult with a professional financial advisor before making investment decisions.
📌 #trading #stockmarket #economy #news #trendtao #charting #technicalanalysis

The Greatest Opportunity of Your Life : Answering QuestionsThis video is an answer to Luck264's question about potential price rotation.
I go into much more details because I want to highlight the need to keep price action in perspective related to overall (broader) and more immediate (shorter-term) trends.
Additionally, I try to highlight what I've been trying to tell all of you over the past 3+ years...
The next 3-%+ years are the GREATEST OPPORTUNITY OF YOUR LIFE.
You can't even imagine the potential for gains unless I try to draw it out for you. So, here you go.
This video highlights why price is the ultimate indicator and why my research/data is superior to many other types of analysis.
My data is factual, process-based, and results in A or B outcomes.
I don't mess around with too many indicators because I find them confusing at times.
Price tells me everything I need to know - learn what I do to improve your trading.
Hope you enjoy this video.
Get Some.
#trading #research #investing #tradingalgos #tradingsignals #cycles #fibonacci #elliotwave #modelingsystems #stocks #bitcoin #btcusd #cryptos #spy #gold #nq #investing #trading #spytrading #spymarket #tradingmarket #stockmarket #silver

SPY: Bulls Will Push
The price of SPY will most likely increase soon enough, due to the demand beginning to exceed supply which we can see by looking at the chart of the pair.
Disclosure: I am part of Trade Nation's Influencer program and receive a monthly fee for using their TradingView charts in my analysis.
❤️ Please, support our work with like & comment! ❤️