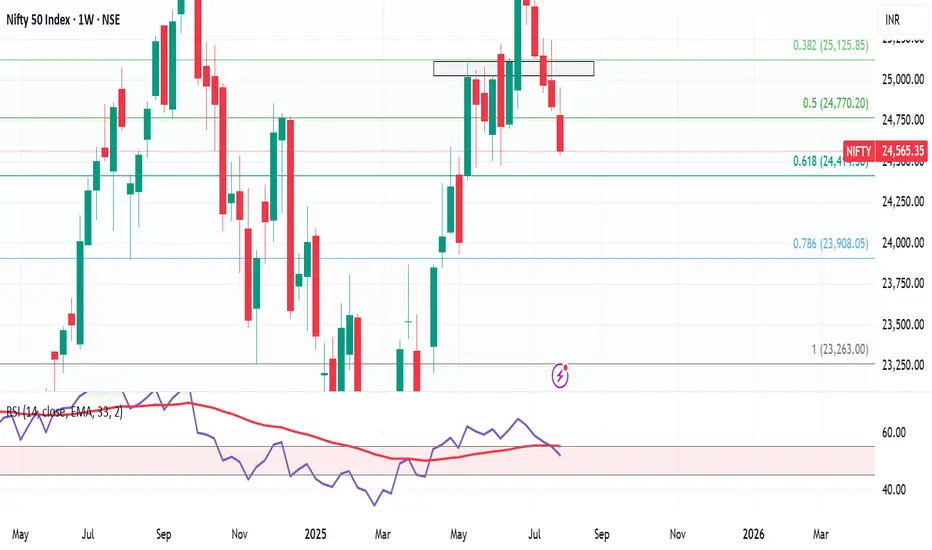
Weekly Market Wrap – Nifty Slides, Global Sentiment WeakensNifty ended the week on a bearish note, closing at 24,565, down 270 points or nearly 1.1% from last week's close. It touched a high of 24,956 and a low of 24,535, perfectly respecting the range I shared last week: 25,300–24,400.
As I highlighted earlier, the inverted hammer formation gave the bears an upper hand—and the index corrected 1.74% from the recent highs. My view continues to favor caution, with the expected trading range for the upcoming week at 25,000–24,100.
Key Levels to Watch:
Support Zone: 24,400 (key bounce area), followed by 24,100 / 23,900 in case of further breakdown.
Resistance Zone: Upside capped near 25,000.
If the market holds 24,400 around 6th–7th August, expect a short-term bounce. However, if this level is breached, expect dips to 24,100 or 23,900, which could offer short-covering opportunities.
Global Cues:
The S&P 500 also had a rough week, closing at 6,238, down 2.5% week-on-week. This decline sparked a wave of selling across global markets. The 6,200 level is crucial—if it holds, we might see a rebound globally, including in Indian equities. Below that, 6,100 remains the breakout retest zone, which I believe should provide some cushion.
💡 Strategy Going Forward:
Focus on stocks showing relative strength in this falling market—they’ll likely lead the rally once sentiment turns.
Avoid chasing rallies, and watch for signs of bottoming out near key support zones.
Keep an eye on global indices like the S&P 500 and Dow Jones, as their stability will dictate near-term direction for Indian markets.
Stay sharp, stay prepared. Let the bears have their moment, but be ready to pounce when the tide turns.
Spy500
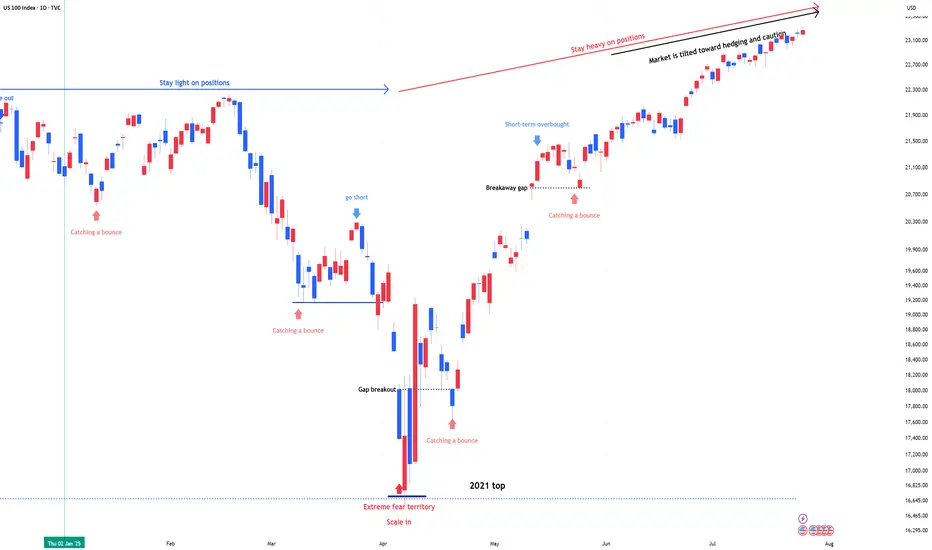
NDX & SPX , Stay heavy on positionsNDX & SPX , Stay heavy on positions (QLD, TQQQ)
Despite downside volatility, the trend remains intact. I’m maintaining the same view as before—this is still a zone to stay heavy.
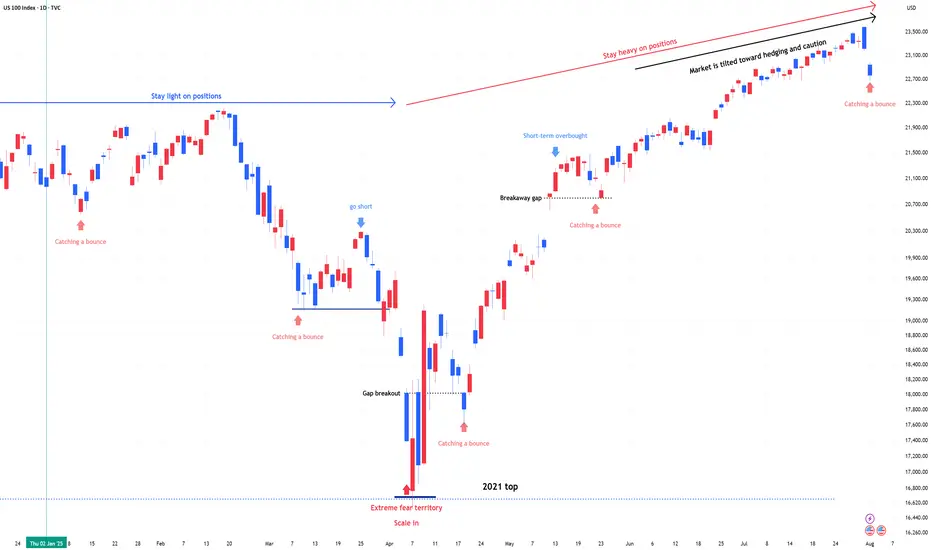
NDX & SPX , Stay heavy on positionsNDX & SPX , Stay heavy on positions (QLD, TQQQ)
Market sentiment is currently tilted toward betting on downside volatility, which ironically supports the case for the stock market to continue its upward trend.
ES Weekly Recap & Gameplan – 27.07.2025🧭 Market Sentiment
The overall sentiment remains bullish, supported by:
• Declining inflation figures
• Trump’s pivot toward aggressive rate cuts
This shift reinforces a risk-on environment across U.S. indices.
🔙 Previous Week Recap
• ES continued its price discovery journey
• Price ran the 4H swing liquidity and shifted market structure
• A clean 1H demand zone was established post-MSS, leading to a strong move toward new ATH
• A bullish trendline has also formed as a visual representation of this momentum
• I anticipated a deeper retracement last week but adjusted my execution based on the ICT SMT concept — see previous week’s ES plan for details
📊 Technical Analysis
Looking forward:
• My expectation is a continued bullish price discovery
• Watching for price to tap into and potentially deviate below the Daily Fair Value Gap (D-FVG)
• This zone also aligns with the 0.5 Fibonacci equilibrium level, which I consider a discounted entry zone
• Confluence of liquidity + trendline + FVG + Fib makes this an ideal location for new long setups
⚙️ Setup Trigger & Trade Plan
Entry Strategy:
• Wait for a clear 1H–4H market structure shift
• Look for demand zone formation within the discount zone
• Execute long trades after confirmation and retracement into this zone
Trade Management:
🎯 Target: New All-Time Highs
⛔ Stoploss: Swing low beneath 1H–4H demand structure
🗨️ If you found this analysis helpful, don’t forget to like and drop a comment below — I’d love to hear your thoughts and setups for the week!
📥 Follow me for more weekly breakdowns and real-time updates throughout the trading week.

NVIDIA: Stay heavy on positionsNVDA position size is adjusted in line with US market signals for underweight or overweight allocations. During panic phases, 2x leverage ETFs are on the table
Stay heavy on positions.

SPY PRICE ACTION 16 JULY 2025This is the price action of spy at its very best as always. I have clearly discussed the important levels & have also discussed the momentum as well.
Feel free to leave your comment
NOTE:I AM NOT TRADING SPY

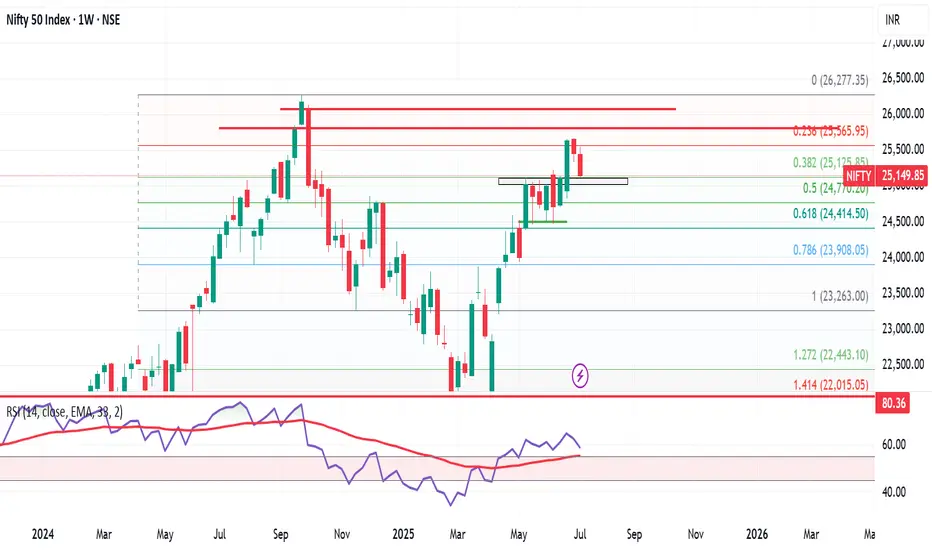
Nifty at Make-or-Break Zone: What to Expect Next Week Markets eMarkets ended the week under pressure, with the Nifty 50 closing at 25,149, down 312 points from the previous week. The index traded within a tight band, hitting a high of 25,548 and a low of 25,129 — perfectly respecting the 25,900–25,000 range mentioned in last week’s analysis.
Now, Nifty finds itself at a crucial support level near 25,000. A rebound from this zone could trigger a short-term rally towards 25,500–25,600, which will act as immediate resistance. However, traders should proceed with caution, as the monthly chart remains neutral to bearish, indicating that this could just be a temporary bounce rather than a sustained uptrend.
Looking ahead, expect Nifty to trade within a range of 24,700 to 25,600. A breakdown below 24,700 could open the gates for deeper cuts, while a breakout above 25,600 needs to be backed by strong volume and participation to confirm a trend reversal.
Sector Watch: Reliance Shines Amidst Caution
Among the large caps, Reliance Industries stands out as the only stock showing strength on the monthly chart, while other heavyweights and key sectors continue to lack momentum. This narrow leadership is a red flag for broader market sustainability.
Global Markets: S&P 500 at a Crossroads
Globally, the S&P 500 closed at 6,259, down slightly from last week. What’s more important is the formation of a Doji candle — a classic sign of indecision. A move above 6,300 could lead to upside targets of 6,376 / 6,454 / 6,500, which would likely boost sentiment in global and Indian equities.
However, if the index slips below 6,150, it would mark a failed breakout, potentially triggering a global correction — a risk that Indian markets can't ignore.
Final Word
We’re at a critical juncture. While technicals suggest a potential bounce in Nifty from 25,000, the lack of confirmation on higher timeframes and uncertain global cues call for prudence over aggression.
👉 I’ll be staying out of the market this week. The setup doesn’t offer a favorable risk-reward, and in trading, patience is often the best position.
Let the charts speak. We’ll act accordingly.
TESLA PRICE ACTION 7 JULY 2025I have clearly explained the price action for Tesla. I have tried my best to explain why you should not be aggressive here.
I have also discussed the stops
NOTE:DO NOT BUY CALLS

SPY (S&P500 ETF) - Daily Golden Cross and All-Time-High PriceSPY (S&P500 ETF) price has reached all-time-highs in July 2025, after a SMA Golden Cross printed on the daily chart.
SPY is still in a price uptrend since May 2025, however a higher-low pullback has not occurred for the past two weeks.
Resistance levels: $625, $630, $635, $640.
Support levels: $622, $617, $614, $611.
A significant reversal or bearish candle pattern has not occurred yet on either the daily or weekly charts.
The Stochastic RSI indicator has reached overbought levels, both on the Daily chart and Weekly chart.
Stock market earnings season begins in July 2025, trade deal negotiations and new tariffs are in progress this week. Volatility could increase this month due to these news catalysts.

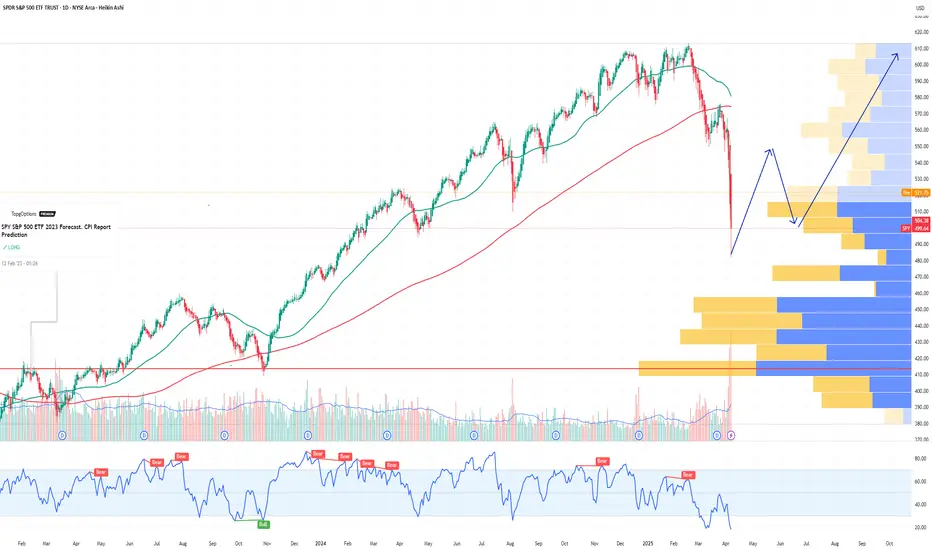
SPY S&P 500 ETF Potential W-Shaped Recovery Forming We may be witnessing the formation of a W-shaped recovery on the SPY (S&P 500 ETF) – a classic double-bottom structure that often signals a strong reversal after a period of correction or volatility. Let’s dive into the technicals and what this could mean in the sessions ahead.
🔍 The Technical Setup:
SPY recently tested key support around the $485-$500 zone, bouncing off that area twice in the past few weeks. This gives us the left leg of the W and the first bottom. After a modest relief rally to ~$520, we saw another pullback – but this second dip failed to break below the first bottom, a hallmark of the W-pattern.
As of today, SPY is starting to reclaim ground toward the $517-$520 resistance zone. If bulls can push through this neckline area, especially with volume confirmation, we could see a breakout that targets the $530-$535 area in the short term.
🔑 Key Levels to Watch:
Support: $490-$500 (double-bottom support zone)
Neckline/Resistance: $530
Breakout Target: $550 (previous highs)
Invalidation: A break below $490 with volume could invalidate the W-recovery idea and shift bias bearish.
📊 Momentum & Volume:
RSI is climbing back above the 50 level – bullish momentum building.
MACD shows a potential crossover forming, hinting at a shift in trend.
Watch for increasing buy volume as SPY approaches the neckline – that’s where the bulls will need to step up.
🧠 Macro & Earnings Angle:
Don’t forget – we’re entering a heavy earnings season and rate cut expectations are still a wildcard. A dovish tone from the Fed and strong corporate results could be the fuel that sends SPY higher to complete this W-shaped recovery.
🧭 Final Thoughts:
This is a high-probability setup if neckline resistance is broken cleanly. Wait for confirmation before going heavy – fakeouts are common in double-bottom scenarios. If we do get the breakout, we may be looking at a broader market rebound going into summer.
🔔 Set alerts near $525. A confirmed breakout could mean the bulls are back in charge.
SPY (S&P500 ETF) - Price Bouncing Up from Support after NewsSPY (S&P500 ETF) price has bounced up from the $593 support level after recent global news (de-escalation news).
Price action has slowed and consolidated in June 2025, and the S&P500 is still maintaining a price uptrend.
The 50EMA and 20EMA Golden Cross is still active and in progress (since May 2025).
The next stock market earnings season is not for another 3 months. Inflation, interest rate news, global events, government news, corporate news will continue to affect price volatility this summer.
Resistance Levels: $604, $610, $612, $619.
Support Levels: $600, $593, $586, $579.

Spy chart for 6/25/25This and patience, it can change based on how we open for New York session but we will see

ES1! Futures
Looking at the 3D ES futures. Does it look bullish? Will it make ATH? Just look at that RSI!

SPY (S&P500) - Price Testing Support Trendline - Daily ChartSPY (S&P500 ETF) price has just closed below $600 and is currently under a support trendline.
If price cannot breakout above the $600 and $605 resistance level this month, a pullback could occur down to the support zone.
SPY price could potentially pullback to various levels of support due to:
-USA domestic conflict
-International military conflicts
-Technical chart bearish divergence
-USA federal reserve interest rate news
-Government and corporate news
Support Levels: $595, $590, $585, $580.
Resistance Levels: $600, $605, $610, $615.
The 50EMA/200EMA Golden Cross is still on-going, and support prices of $580 and $568 have yet to be tested significantly.

SPY (S&P500 ETF) - Price Attempting Breakout Above ResistanceSPY (S&P500 ETF) price is attempting to breakout above Daily resistance levels of $594 and $597.
SPY ETF has been in an uptrend since May 2025. A Golden Cross also occured on May 19th 2025, signaling that a potential longer term bullish rally could occur.
Friday's candle closed as a Doji signaling some potential indecision after recent price volatility.
SPY price is not at any extreme level on the Daily chart.
If SPY price ever gaps up and rallies up to the $612 to $620 resistance zone, price could sell off stronger (short-term).
In June 2025, trade deal and inflation news will most likely be the catalyst for further volatility, in addition to government news announcements.

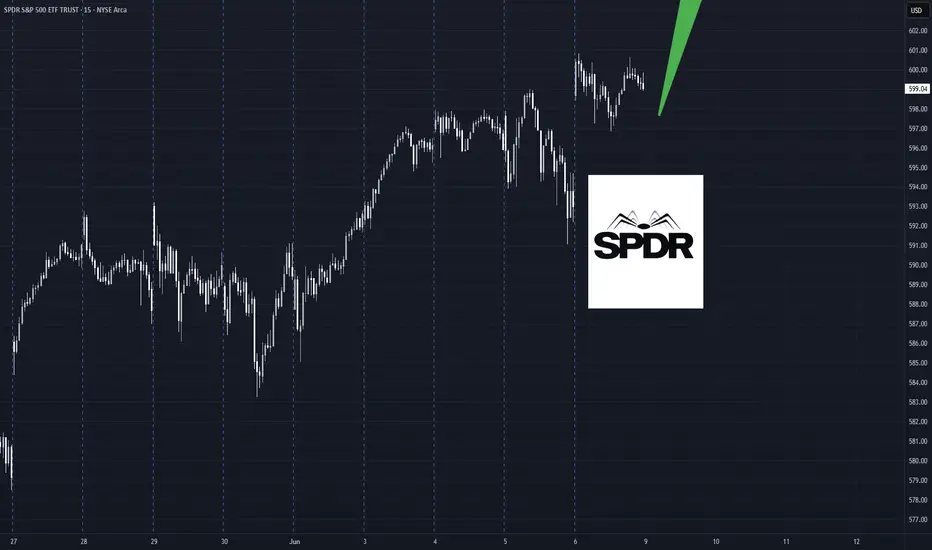
SPY Swing Trade Plan – 2025-06-06📈 SPY Swing Trade Plan – 2025-06-06
Bias: Moderately Bullish
Timeframe: 3–4 weeks
Catalysts: Strong institutional flows, trade talk optimism, solid jobs report
Trade Type: Long equity position
🧠 Model Summary Table
Model Bias Entry Stop Loss Take Profit Holding Period Confidence
DS Moderately Bullish $600.02 $595.54 $618.02 3 weeks 65%
LM Moderately Bullish $598.50 $586.70 $616–618 3–4 weeks 75%
GK Strongly Bullish $600.02 $592.00 $610.00 4 weeks 72%
GM Moderately Bullish ~$600.50 $587.50 $627.50 3–4 weeks 70%
CD Moderately Bullish $600–600.50 $585.00 $620 / $635 3–4 weeks 72%
✅ Consensus: SPY is in a bullish trend across timeframes
⚠️ Disagreements: MACD momentum and entry/pullback levels
🔍 Technical & Sentiment Summary
Trend: SPY above 10/50/200 EMAs on all models
RSI: 60–61 → bullish but not overbought
MACD: Mostly positive, DS cautious on daily histogram
Support Levels: $591.06, $595.54, $597.26
Resistance Zones: $600.83, $605.21, $610
VIX: 17.6 (declining), supports risk-on sentiment
News: Trade talk optimism and strong jobs data fueling momentum
✅ Final Trade Setup
Parameter Value
Instrument SPY
Strategy LONG
Entry Price $600.00
Stop Loss $588.00
Take Profit $625.00
Position Size 83 shares (1% risk on $100K)
Entry Timing At market open
Confidence 70%
💡 Rationale: Aligned bullish signals across timeframes, falling VIX, and strong macro sentiment favor a trend continuation move toward $625. Position sized for conservative risk management.
⚠️ Key Risks & Considerations
MACD divergence could signal near-term stall
Resistance zone at $605 may act as a cap
Macro volatility: Strong jobs could raise rate expectations
VIX Watch: A spike above 20 could reverse market trend
Exit Protocol: Consider closing if SPY closes below the 10-day EMA (~$591)
📊 TRADE DETAILS SNAPSHOT
🎯 Instrument: SPY
📈 Direction: LONG
💰 Entry Price: 600.0
🛑 Stop Loss: 588.0
🎯 Take Profit: 625.0
📊 Size: 83 shares
💪 Confidence: 70%
⏰ Entry Timing: Open
SHORT The S&P 500 Index: Not A Bear Market, Just A CorrectionWe are about to witness an inception of bearish action. A correction within a correction.
After 7-April, the Cryptocurrency market started to recover, but the main Altcoins that were growing were all memecoins, and I wondered, "Why are mainly memecoins growing?" I know that when memecoins grow the market is actually bearish on the bigger picture. I shrugged it off and went LONG.
It seems I have an explanation now, this recovery was only a partial recovery or, we are just in front of a classic retrace, a small correction. This means that regardless of how fast and strong it goes the end will result in a higher low, compared to 7-April. This means that the bullish structure will remain intact, but you can't change the fact that strength is not present on this chart.
The SPX is going down next. There two main support levels to consider, you decide which one is the one that you should take. My job is to alert you of the event before it happens, great timing and entry prices, you can take care of the rest.
Thank you for reading.
This is a friendly reminder.
Market conditions can always change.
Namaste.

SPY (S&P500 ETF) - Price Bounced Above Gap Support Zone - DailySPY (S&P500 ETF) price has bounced up from the $576 price support gap level.
EMA Golden Cross is still active, the yellow 50EMA crossed above the red 200EMA which could signal a longer term bullish rally.
SPY price has been in an uptrend since May 2025.
Resistance Levels: $594, $596, $600, $607, $613.
Support Levels: $581, $575, $572, $567, $564.
Tariff and trade deal news, corporate earnings, presidential and government law changes, inflation data, economic data, and consumer sentiment can all affect Stock and ETF prices.

Flying into the sun or about to get burnt?Market is about to reach all-time highs again. Many trade deals must have been made. Interest rates must have been cut. Wars must have been resolved. Personal debt must have come under control. Corporate debt must have been resolved.
Wait, nothing has changed? Things are worse? Well why is the index about to hit new all-time highs? My take is a major fake out. We are about to set a double top as we complete a rising wedge pattern.
The rising wedge.
What began at the market bottom on 7 April, has remained bound in a channel. If the first pump up was an A followed by the declaration of the channel bottom as B, wave C has last over a month upward. We have wave 3 signals identifying wave 3 of C ending with the high on 19 May. Last week's dip was wave 4 and now we fly high this week. It is unclear if we actually make a new all-time high or fall just short. The below chart has 138.197% extension around 610.63. Inside wave C, my wave 1 was nine days long, and wave 3 was only 8. This points to wave 5 lasting less than 8 days. A common wave 1-3-5 duration in relation to wave 3 is around 114% for 1 and 50% for wave 5.
The height of the rising wedge covers 66.82 points. This same distance should provide the first target bottom once we exit the channel, possibly as early as next week. Once the bottom falls, we then examine the double top pattern. Although the neckline stretches far backwards, the bottom is established at the 7 April low. The distance from the neckline to the all-time high in February provides the next possible minimum target bottom by taking this 131.43 drop and subtracting it from the neckline of 481.80. This puts the initial low around 350.37 sometime later this year or early next.
There is a perfect storm of calamity brewing with zero resolutions in place or even planned. Do we finally drop or keep rising into the sun?

ES Futures Trading Signal - 2025-05-25ES Futures Analysis Summary (2025-05-25)
Comprehensive Summary of Each Model
Grok/xAI Report
Market context: Price $5,875 above 9-, 20-, 21-, 50-day MAs, just under 200-day SMA at $5,804.75; RSI ~59 neutral; price near upper Bollinger Band. Bias: Moderately Bullish, potential breakout above BB. Trade Plan: Long at 5,900; SL 5,840; TP 6,050; 1 contract; confidence 0.65.
Claude/Anthropic Report
Market context: Price above 20/50/200-day SMAs; RSI ~59; MACD histogram slightly negative; healthy pullback within uptrend. Bias: Moderately Bullish. Trade Plan: Long at 5,875; SL 5,825; TP 5,975; 1 contract; confidence 0.68.
Llama/Meta Report
Market context: Price above 20/50-day SMAs, just under 200-day SMA; RSI neutral; BB middle at 5,787.7. Bias: Moderately Bullish. Trade Plan: Long at 5,880; SL 5,810; TP 6,000; 1 contract; confidence 0.65.
Gemini/Google Report
Market context: Price above all key MAs (20/50/200, EMA9/21); RSI neutral; MACD lines above zero but slight bearish cross; recent 24h bounce after 5-day pullback; BB upper at 6,060.7. Bias: Moderately Bullish. Trade Plan: Long at 5,875; SL 5,845; TP 5,935; 1 contract; confidence 0.70.
DeepSeek Report
Market context: Same MAs and indicators, but emphasizes MACD bearish crossover, price rejection at upper BB, recent pullback. Bias: Moderately Bearish near-term. Trade Plan: Short at 5,875; SL 5,925; TP 5,800; 1 contract; confidence 0.65. Areas of Agreement and Disagreement
Agreement:
All models note price trading above short- and medium-term MAs. RSI ~59 (neutral, room to run). BB upper band is resistance; MACD histogram negative. Consensus that recent 5-day pullback is either consolidation (bullish view) or warning sign (bearish view).
Disagreement:
Directional bias: Four models bullish vs. one moderately bearish. Entry levels: range 5,875–5,900. Stop-loss zones: 5,810–5,840. Take-profit zones: 5,935–6,050. Clear Conclusion
Overall Market Direction Consensus: Moderately Bullish Recommended Trade: Long ES futures
Entry Range: 5,870–5,880 (target 5,875) Stop Loss: 5,845 (30-point risk) Take Profit: 5,935 (60-point reward, 2:1 R:R) Position Size: 1 contract (adjust per account risk; ~1% equity) Entry Timing: Market Open Confidence Level: 70%
Key Risks and Considerations:
Short-term bearish MACD crossover may lead to choppy action or minor pullback. Volatility spike at market open can cause slippage. Negative macro or news catalysts can derail technical setup. ES is highly correlated with broader equity futures; cross-asset moves may amplify moves.
TRADE_DETAILS (JSON Format)
{ "instrument": "ES", "direction": "long", "entry_price": 5875.00, "stop_loss": 5845.00, "take_profit": 5935.00, "size": 1, "confidence": 0.70, "entry_timing": "market_open" }
📊 TRADE DETAILS 📊 🎯 Instrument: ES 📈 Direction: LONG 💰 Entry Price: 5875.0 🛑 Stop Loss: 5845.0 🎯 Take Profit: 5935.0 📊 Size: 1 💪 Confidence: 70% ⏰ Entry Timing: market_open
Disclaimer: This newsletter is not trading or investment advice but for general informational purposes only. This newsletter represents my personal opinions based on proprietary research which I am sharing publicly as my personal blog. Futures, stocks, and options trading of any kind involves a lot of risk. No guarantee of any profit whatsoever is made. In fact, you may lose everything you have. So be very careful. I guarantee no profit whatsoever, You assume the entire cost and risk of any trading or investing activities you choose to undertake. You are solely responsible for making your own investment decisions. Owners/authors of this newsletter, its representatives, its principals, its moderators, and its members, are NOT registered as securities broker-dealers or investment advisors either with the U.S. Securities and Exchange Commission, CFTC, or with any other securities/regulatory authority. Consult with a registered investment advisor, broker-dealer, and/or financial advisor. By reading and using this newsletter or any of my publications, you are agreeing to these terms. Any screenshots used here are courtesy of TradingView. I am just an end user with no affiliations with them. Information and quotes shared in this blog can be 100% wrong. Markets are risky and can go to 0 at any time. Furthermore, you will not share or copy any content in this blog as it is the authors' IP. By reading this blog, you accept these terms of conditions and acknowledge I am sharing this blog as my personal trading journal, nothing more.

SPY Weekly Options Trade Plan 2025-05-25SPY Weekly Analysis Summary (2025-05-25)
Model Summaries
Grok/xAI Report
Technicals: SPY at $579.11, below short-term EMAs (10/50 on 5-min), above 200-period EMA, RSI oversold on 5-min, MACD bearish. Daily chart neutral to slightly bearish. Sentiment: Rising VIX (22.29), max pain at $580. Trade: Buy 2025-05-30 577 put at $5.12, profit target ~3-point move, 20% stop loss, confidence 65%.
Claude/Anthropic Report
Technicals: 5-min and daily charts bearish but RSI oversold intraday. Volume selling peaked. Sentiment: Max pain $580, heavy OI at 575/570 puts, futures up. Trade: Buy 2025-05-30 581 calls at ~$4.91, profit targets 25–50%, 30% stop loss, confidence 65%.
Llama/Meta Report
Technicals: Moderately bearish on 5-min EMAs and MACD, daily neutral. Sentiment: Elevated VIX, max pain at $580. Trade: Buy 2025-05-30 579 put at $5.95, 20% profit target, 10% stop loss, confidence 70%.
DeepSeek Report
Technicals: Mixed signals—5-min oversold vs. daily bearish. Sentiment: Stuck between support $576.86 and max pain $580. Trade: No recommendation (confidence 45%).
Gemini/Google Report
Technicals: Daily and 5-min bearish, price under key EMAs. Futures suggest gap up to $581–581.50. Sentiment: Rising VIX, max pain at $580. Trade: Fade the open—buy 2025-05-30 578 puts at ~$2.20, target $3.00, stop ~$1.60, confidence 65%. Agreement and Disagreement
Agreement
Short-term bearish bias: Most see SPY below intraday EMAs and bearish MACD. Elevated volatility: All cite VIX rising above 20 as a risk factor and opportunity. Max pain magnet: Models note $580 as a gravitational level.
Disagreement
Directional tilt: Claude is moderately bullish (buy calls), others lean bearish or neutral. Trade entry strike: Puts at 577, 578, 579 vs. calls at 581. Risk parameters: Profit targets and stop losses vary widely (10–50% of premium). Conclusion and Recommendation
Overall Market Direction Consensus: Moderately Bearish. SPY is below key short-term EMAs, MACD on multiple timeframes is negative, and although oversold conditions could spark a bounce, the preponderance of models favors downside.
Recommended Trade
Strategy: Buy a single-leg naked put Instrument: SPY weekly put expiring 2025-05-30 Strike: 577.00 (ask $5.12) Premium: $5.12 Entry Timing: At market open, assuming SPY does not gap significantly below $579 or above $581. Profit Target: 40% gain (premium ~$7.17) Stop Loss: 25% premium loss (premium ~$3.84) Size: 1 contract Confidence Level: 65%
Key Risks and Considerations
SPY could bounce strongly from oversold levels or pre-market futures strength, invalidating the bearish setup. Theta decay accelerates late in the week; monitor time decay. VIX spikes could amplify premium and widen bid-ask spreads.
TRADE_DETAILS (JSON Format)
{ "instrument": "SPY", "direction": "put", "strike": 577.0, "expiry": "2025-05-30", "confidence": 0.65, "profit_target": 7.17, "stop_loss": 3.84, "size": 1, "entry_price": 5.12, "entry_timing": "open", "signal_publish_time": "2025-05-25 21:27:17 UTC-04:00" } 📊 TRADE DETAILS 📊 🎯 Instrument: SPY 🔀 Direction: PUT (SHORT) 🎯 Strike: 577.00 💵 Entry Price: 5.12 🎯 Profit Target: 7.17 🛑 Stop Loss: 3.84 📅 Expiry: 2025-05-30 📏 Size: 1 📈 Confidence: 65% ⏰ Entry Timing: open 🕒 Signal Time: 2025-05-25 21:27:49 EDT
Disclaimer: This newsletter is not trading or investment advice but for general informational purposes only. This newsletter represents my personal opinions based on proprietary research which I am sharing publicly as my personal blog. Futures, stocks, and options trading of any kind involves a lot of risk. No guarantee of any profit whatsoever is made. In fact, you may lose everything you have. So be very careful. I guarantee no profit whatsoever, You assume the entire cost and risk of any trading or investing activities you choose to undertake. You are solely responsible for making your own investment decisions. Owners/authors of this newsletter, its representatives, its principals, its moderators, and its members, are NOT registered as securities broker-dealers or investment advisors either with the U.S. Securities and Exchange Commission, CFTC, or with any other securities/regulatory authority. Consult with a registered investment advisor, broker-dealer, and/or financial advisor. By reading and using this newsletter or any of my publications, you are agreeing to these terms. Any screenshots used here are courtesy of TradingView. I am just an end user with no affiliations with them. Information and quotes shared in this blog can be 100% wrong. Markets are risky and can go to 0 at any time. Furthermore, you will not share or copy any content in this blog as it is the authors' IP. By reading this blog, you accept these terms of conditions and acknowledge I am sharing this blog as my personal trading journal, nothing more.

VIX SPY500 forecast until end of June 2025VIX S&P500 Index is in reversal. Downward movement has ended. Uptrend is starting now. All the way until end of June 2025 VIX will grow and steadily and surely.
Bottom is now at 18.18 and possible interim top is at 36.54
This view is supported by my forecast of S&P500 for June 2025.
For more updates on 1D chart click social media links in my profile.

ES1! (S&P500 Mini Futures) - Support Trendline Price Test -DailyES1! (S&P500 Mini Futures) price is currently testing a support trendline around $5900.
If several daily Price candles close below $5865 this month, a pullback in the price can occur (rising wedge pattern).
Volume has been decreasing in May 2025, compared to March and April.
Finance and Technology corporate earnings season has passed. The U.S. government 90-day tariff pause is set to expire in early July (pending trade deal negotiations with other countries).
Tariff and trade deal news, breaking news, corporate earnings, government law changes, consumer sentiment, inflation data, the FOMC, and presidential announcements can all affect the prices of stocks and ETFs.
