S&P 500 Index. There is no buyer nowOn the daily chart, the price is at the lower boundary of the sideways range. Yesterday's trading day favored the buyer with decreasing volume.
On the hourly chart, the buyer resumed from the key impulse bar and twice attempted to breach the level of 4259.2 on volume but failed to do so effectively (failed to close an hourly candle above the level).
The buyer has not made a strong presence yet.
As mentioned earlier, local sales yesterday were observed from the level of 4259.2. For systemic sales, it is advisable to wait for the price to interact with the daily candle of October 19, 2023. Or after a successful breakout of the lower limit of the daily range and the seller defending this breakout.
Local purchases can be sought upon the buyer's protection level at the lower boundary of the daily range: 4217.4. Targets are 4259.2, 4269.9.
Good luck in trading!
Disclaimer:
This case study is for educational purposes only and does not constitute investment advice or recommendations.
The trading or investment ideas presented here are for illustrative purposes only and are an integral part of a case study demonstrating the concepts of using volume to analyze or trade within the market scenarios discussed.
Spy500

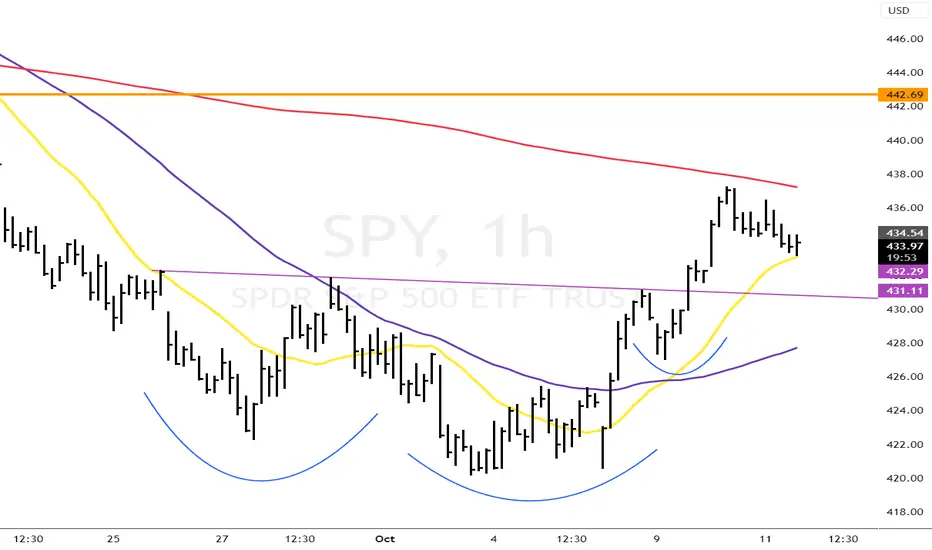
S&P 500 Index. Will there be a buyer?On the daily chart, the price interacted with the lower boundary of the sideways range on decreasing volume. The buyer has not yet made a strong presence.
On the hourly chart, a buyer's zone has formed at the lower boundary of the sideways range.
It is more favorable to seek short positions from the daily candle of October 19, 2023, as previously mentioned. Local sales can also be considered after the seller's protection of 4238.4 or 4259.2. Targets are 4217, 4204, and possibly an update of local lows. One should observe how the price passes through the buyer's zones.
Local purchases can be sought upon the resumption of the buyer from the buyer's zone at the lower boundary of the sideways range. Protection level 4217.4 or 4204.3. Targets are 4238.4, 4259.2."
Good luck in trading!
Disclaimer:
This case study is for educational purposes only and does not constitute investment advice or recommendations.
The trading or investment ideas presented here are for illustrative purposes only and are an integral part of a case study demonstrating the concepts of using volume to analyze or trade within the market scenarios discussed.

SPY Short Prediction - 10/15/2023Unqualified prediction: SPY looks to be rolling over on the 1hr with multiple historical zones of support and resistance overlapping in a concentrated range (specified in-chart.) This in a TA sense would indicate a potential fight between buyers and sellers for control of price action, but macroeconomic fundamentals and geopolitical concerns, as well as ER volatility make for turbulent waters with this amateur analyst biased towards the downside.

SPY WEEKLY OCT 20th,2023SPY weekly is here. Be careful when you are trading SPY. All levels have been discussed here.
NOTE: DO NOT TRADE OPTIONS IN SPY

UPDATES! SPX500, GOLD, GBPUSD, AUDUSDHere are my updates!
We're on our way to targets. Most of the analysis was on target.
Hopefully, we'll hit the marks tomorrow.
If you found a benefit from the analysis I presented yesterday, let me hear from you!
Like and consider subscribing to my channel! It's free ... and really appreciated! My only reward doing this is feedback from viewers.

Country Garden is unable to meet the offshore debt payments The past few days were quite choppy for SPX. However, S&P 500 E-mini Futures have not broken above the 0.5 Fibonacci retracement level. That allows us to maintain a bearish stance and keep the recently introduced setup valid. As a result, there is not much to write about today, except for one noteworthy thing that caught our attention overnight: one of the largest Chinese real estate developers, Country Garden, failed to meet offshore debt payments (already in the grace period), suggesting default proceedings might be next. We will update our thoughts on the asset with the emergence of new developments.
Illustration 1.01
Illustration 1.01 displays the daily chart of ES1! and Fibonacci retracement levels.
Technical analysis gauge
Daily time frame = Neutral
Weekly time frame = Slightly bearish
*The gauge does not necessarily indicate where the market will head. Instead, it reflects the constellation of RSI, MACD, Stochastic, DM+-, ADX, and moving averages.
Please feel free to express your ideas and thoughts in the comment section.
DISCLAIMER: This analysis is not intended to encourage any buying or selling of any particular securities. Furthermore, it should not be a basis for taking any trade action by an individual investor. Therefore, your own due diligence is highly advised before entering a trade.

SPY LIVE 19th Oct,2023This is my live analysis for SPY and I want to go long once price touched $424 levels and the logics are explained in this analysis.
NOTE:WAIT FOR THE RIGHT OPPORTUNITY

Observing SPX Range-Bound Move: Be Caution and Stay AlertToday, I wanted to draw your attention to the recent performance of the SPX, which has been exhibiting a range-bound behavior over the past year. As we navigate through these uncertain times, it is crucial to stay vigilant and monitor the market closely.
Over the last year, the SPX has shown a tendency to trade within a specific range, with price movements oscillating between key support and resistance levels. This range-bound behavior implies that the market has been lacking a clear direction, making it essential for investors to exercise caution and closely observe the price action.
Currently, the SPX is hovering around the $4569 level, which serves as a significant resistance point. Should the price break through this level decisively, it could potentially signal a bullish trend. In such a scenario, it may be prudent to consider long positions, taking advantage of the potential upside momentum.
On the other hand, it is equally important to be prepared for a potential downside move. If the price falls below the long-term support level of $3800, it could indicate a bearish trend. In this case, it may be wise to consider short-term positions or even adopt a more cautious approach in the long term.
Given the current market dynamics, I encourage you to closely watch the SPX's price movements, paying particular attention to the key support and resistance levels mentioned. By doing so, you will be better equipped to make informed investment decisions and navigate the market with prudence.
As always, it is essential to remember that investing involves inherent risks, and past performance is not indicative of future results. Therefore, I recommend consulting with a financial advisor or conducting thorough research before making any investment decisions.
Should you have any questions or require further assistance, please feel free to comment below.

Expired SPY Weekly outlook. 3rd WK OCT 2023Expired SPY Weekly outlook. 3rd WK OCT 2023
> NEUTRAL 📊 CORRECT
Closed Price: 431.50
Target Price: 432.06 | Strike Price: 436.82 OCT16
Upper Range: 448.80
Lower Range: 415.31

The S&P500 is preparing for an insane rallyHello Traders and Investors,
My name is Philip and I am a German swing-trader with over 4 years of trading experience.
I only trade the higher timeframes, preferably the monthly chart, because this allows me to capitalize on the major market swings.
I view trading as a long term game over the next 20 years which will help me to build massive wealth - it is not a get rich quick scheme.
-------------------------------------------------------------------
Today I want to share with you my outlook on the S&P500:
Over the past almost 15 years the S&P500 has been respecting a super simple bullish trendline. Always when the S&P500 tested this level, we saw a major rally towards the upside. And now the S&P500 is about to retest this trendline again and I do expect another push higher.
-------------------------------------------------------------------
Most of the people always follow the quick money. But the quick money is never the big money.
They think that making 5% a month consistently is reasonable, which is one of the reasons why so many traders fail.
The only think which you can control is your risk, everything else is unknown.
Keep your long term vision!

ES Bull Flagging into 4400ES Hourly Analysis - Bull Flagging into 4400
Price action was quite choppy today and was hard to read. When that happens, it's best to just step away and let price paint a picture for you over a period of time until the direction is clear. That is exactly what ES has started to do. On the 2-5 minute chart this looks like a mess, on the hourly, it's painted a beautiful picture. It is showing us that ES can not close 4400 and that any time it dips below, buyers keep stepping in.
4400 has become the battle field. We are basing/consolidating for a big move, which is expected due to this being a volatile week. While we are in a volatile week once earnings start to report, and with current world news, don't swing for the fences when entering trades. Keep it logical.
Supports: 4400, 4390, 4375.
Resistance: 4410, 4415, 4425.

SPY S&P 500 ETF 2023 Forecast. CPI Report PredictionAfter those Put options went to the target:
My timeline for SPY S&P 500 ETF after the CPI report on Feb 14 is this:
1. CPI data will come better than expected. The medium forecast in 6.2, I expect 6 - 6.1.
- The market will be exuberant afterwards and SPY will reach $431 by March 1st, thinking that the FED won the fight against inflation.
2. While inflation continues to be sticky in March, the FED will continue increasing interest rates and won`t stop until something cracks in the economy. Another 25bps increase.
- The market is expected to react and the SPY will reach $376.
3. They year will end in a positive note, the was in Ukraine will end and the supply chain disruption that was one of the factors of high inflation, will be restored. Inflation don to 3%.
My prediction for SPY by the end of the year is $436, a 15% increase YOY.
Looking forward to read your opinion about it!

SPY ANALYSIS 16th Oct,2023This is my live analysis for SPY. Don't rush or push yourself into trades as market will hurt you mentally.
NOTE:WAIT FOR THE LEVELS DISCUSSED


Market to suck in die-hard bulls before abrupt reversal?Finally, the SPX rebounded to the level we initially expected it to reach (outlined last Friday). This move was accompanied by a bullish reversal in RSI, MACD, and Stochastic on the daily chart. To support a continuation higher, we want to see these indicators continue to develop bullish structures. However, to support a thesis that this is merely a correction of a prolonged downtrend that began in late July 2023, we would want to see RSI peak below 70 points (which is very common for downtrend corrections). In addition to that, we would like to see MACD fail to break above the midpoint.
As for our stance, we continue to wait on the sidelines (for short re-entry if the situation develops as expected). However, at the moment, we still do not feel comfortable to take action. The SPX might continue higher, potentially to the level where it sucks in bulls who start predicting new all-time highs and soft landing, just before an abrupt reversal. If we were to think of such a level, it would be somewhere near $4,450 (coinciding with the breakout above the sloping resistance). Though this is, of course, only a speculation at this point. It is not warranted the market will rebound as high (especially as yesterday’s candle looks somewhat exhausted). Therefore, for minor clues, we will pay close attention to the price’s ability to hold above the 20-day SMA and Resistance 1; a failure to stay above these levels will raise our suspicion and potentially signal a loss of upside momentum.
Illustration 1.01
Illustration 1.01 displays the daily chart of BTCUSD and two simple moving averages. The 20-day SMA acts as a support. If the price fails to hold above this level, it will be slightly bearish and raise our suspicion.
Technical analysis gauge
Daily time frame = Slightly bullish
Weekly time frame = Slightly bearish
*The gauge does not necessarily indicate where the market will head. Instead, it reflects the constellation of RSI, MACD, Stochastic, DM+-, ADX, and moving averages.
Please feel free to express your ideas and thoughts in the comment section.
DISCLAIMER: This analysis is not intended to encourage any buying or selling of any particular securities. Furthermore, it should not be a basis for taking any trade action by an individual investor. Therefore, your own due diligence is highly advised before entering a trade.

$SPY Inverse Head & Shoulders PatternAMEX:SPY Inverse Head & Shoulders Pattern, In the recent trading sessions, the SPY index has exhibited a compelling technical pattern commonly known as the Inverse Head & Shoulders. Unlike its bearish counterpart, the standard Head & Shoulders, this pattern is generally considered a bullish indicator and may signify a trend reversal from downward to upward.
The structure of the Inverse Head & Shoulders consists of three main troughs. The middle trough (the 'head') is the lowest, flanked by two higher troughs (the 'shoulders'). The pattern is confirmed when the asset's price moves above the 'neckline,' a resistance level connecting the two shoulders.
Investors should remain vigilant for a decisive close above this neckline, as it would confirm the completion of the pattern and potentially signal the commencement of a new bullish cycle for the SPY index.
SPY INTRA DAY OCT10th,2023Intra day does not mean that you will get trades today. I will trade only what candles are telling me to do. Observe the levels and trade as per your risk tolerance.
NOTE: WAIT FOR PRICE TO COEM TO YOUR LEVELS

Expired SPY Weekly outlook. 2nd WK OCT 2023Expired SPY Weekly outlook. 2nd WK OCT 2023
> NEUTRAL 📊 CORRECT
Closed Price: 429.54
Target Price: 428.42 | Strike Price: 427.36 OCT9
Upper Range: 445.03
Lower Range: 411.81

SPY WEEKLY OCT9th,2023This is my analysis for SPY . Try to understand the logics and try not to push trades on you.
NOTE:TRADE OTHER STOCKS LOOKING AT SPY

SPY Weekly outlook. 2nd WK OCT 2023SPY Weekly outlook. 2nd WK OCT 2023
> NEUTRAL 📊
Closed Price: 429.54
Target Price: 428.42
Upper Range: 445.03
Lower Range: 411.81


S&P 500 Elliott Wave Analysis for Tuesday 03/10/2023The primary expectation is that wave X has finished and that we are doing an ABC pattern down as wave Y. We see two equally valid scenarios. Firstly, we might have finished wave Y as an ABC. Secondly, wave (v) of wave ((c)) is still coming.

SPY Buy IdeaLike SPY to pullback to around 426.29 and 425.92... from there like it to push up to 436 which will fill a daily gap
