Michael Burry Executes Massive Short of SPY and QQQIntroduction:
In recent news, renowned investor Michael Burry has made waves by executing a massive short of the SPY (S&P 500 ETF) and QQQ (Nasdaq 100 ETF). Burry's move has garnered significant attention, raising concerns about the future performance of these major USA stock market ETFs. This article aims to provide traders with a cautious analysis of the situation and present a call to action for those considering shorting these ETFs.
The Burry Effect:
Michael Burry, famously known for his accurate prediction of the 2008 financial crisis, made a bold move again. By shorting the SPY and QQQ, Burry is signaling his belief that the current market conditions may be overvalued or potentially face a correction. Traders should take note of his historical accuracy and consider the implications of his actions.
Understanding the Risks:
Understanding the associated risks is crucial to approach any investment decision thoroughly. Shorting ETFs like SPY and QQQ involves betting against the market's overall performance, which can be highly volatile and unpredictable. While Burry's track record is impressive, conducting independent research and analysis is essential before making investment decisions.
Considerations for Shorting:
1. Diversification: Traders should ensure their portfolios are well-diversified, spreading risk across various asset classes and sectors. Shorting ETFs like SPY and QQQ should be considered a strategic move within a broader investment strategy.
2. Risk Management: A clear risk management plan is crucial when shorting major market ETFs. Setting stop-loss orders and regularly monitoring positions can help mitigate potential losses.
3. Expert Advice: Consult with financial advisors or professionals specializing in shorting strategies. Their expertise can provide valuable insights and guidance tailored to individual trading goals and risk tolerance.
Call-to-Action: Proceed with Caution
Considering Michael Burry's recent shorting activity, traders are encouraged to proceed cautiously when contemplating short positions on SPY and QQQ. While Burry's reputation for accurate predictions is noteworthy, conducting thorough research and analysis is imperative, and assessing the potential risks and rewards associated with such trades is imperative.
Ultimately, the decision to short these significant USA stock market ETFs should be based on an individual's risk appetite, investment strategy, and market outlook. Traders should carefully weigh the potential benefits against the inherent risks, seek professional advice, and consider alternative investment options.
Conclusion:
Michael Burry's massive short of SPY and QQQ has undoubtedly sparked interest and raised questions among traders. However, it is crucial to approach such investment decisions and conduct thorough research cautiously. By considering the risks, diversifying portfolios, and seeking expert advice, traders can make informed choices that align with their individual trading goals. Remember, shorting major ETFs is a complex strategy that requires careful consideration and may only be suitable for some.
Spy500

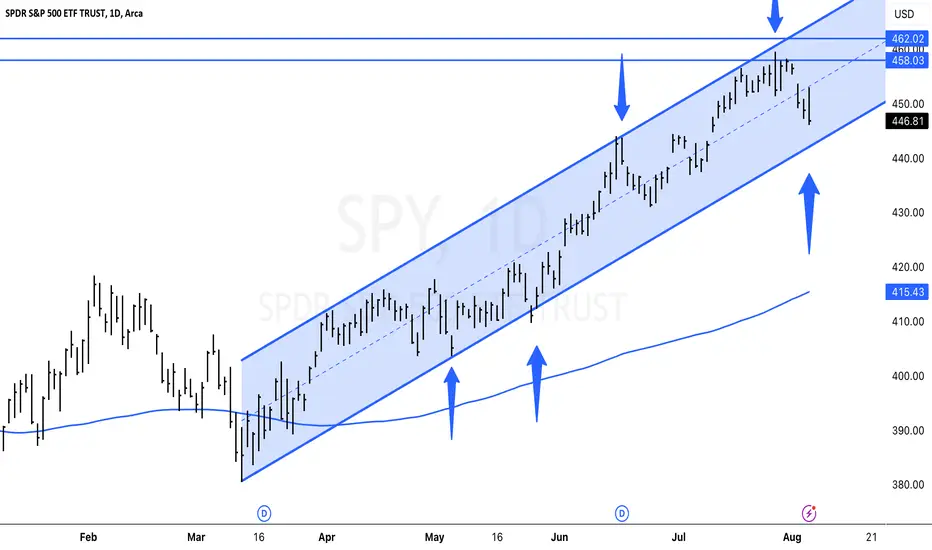
$SPY Daily Charthe AMEX:SPY is still in a parallel uptrend. The trend line has been in place since March 2023, and it has helped to support the stock market during periods of volatility. If the trend line breaks, the next support level will be at the 150-day moving average. This is a key level to watch, as a break below it could signal a more significant decline in the stock market.
However, it is important to remember that the stock market is cyclical, and it is normal for there to be periods of volatility. The AMEX:SPY has been in an uptrend for the past year, and it is possible that the trend line will continue to hold. If the trend line does break, it is important to stay calm and to not panic sell. Instead, you should wait for the stock market to find a bottom and then start buying again.
Kellogg descending correction breakoutKellogg breakout
Kellogg seems to hit a double bottom with descending correction breakout to upside recently gold sach updated price target to 71 maybe something boiling ?

SPY weekly Analysis Aug 7th-Aug 11th,2023I have analyzed SPY for this week and I feel Spy is trying to change its trend. Let me know if you have any questions.

Uncertainty spreads among investors as they await more dataIn the aftermath of the latest Federal Reserve (FED) meeting and subsequent 25 basis points rate hike, SPX has been experiencing fluctuating price action, oscillating primarily between $4,520 and $4,600. This range-bound activity could indicate investors’ caution as they grapple with the implications of the FED's policy changes and monitor the incoming economic data to ascertain the overall market direction. Today, we will get an update on S&P Global Manufacturing PMI, ISM Manufacturing PMI, ISM Manufacturing Employment, and JOLTs Job Openings (note that we are not listing every data release, only ones important to us). On Thursday, we will get more information on initial jobless claims, S&P Global Services PMI, S&P Global Composite PMI, and ISM Services PMI. Then finally, on Friday, the unemployment rate and non-farm payrolls are scheduled to come out. We will wait for these figures and reassess our views accordingly.
Illustration 1.01
The picture above shows the daily chart of SPX. Yellow arrows indicate the divergence between the price and technical indicators MACD and RSI; in addition to that, on the MACD’s graph, the signal line can be seen breaking above the MACD line, which is slightly bearish (but it could still be only a fakeout). Therefore, we will monitor these two indicators in the following days for any signs of a potential trend reversal.
Technical analysis gauge
Daily time frame = Bullish
Weekly time frame = Bullish
*The gauge does not necessarily indicate where the market will head. Instead, it reflects the constellation of RSI, MACD, Stochastic, DM+-, ADX, and moving averages.
Please feel free to express your ideas and thoughts in the comment section.
DISCLAIMER: This analysis is not intended to encourage any buying or selling of any particular securities. Furthermore, it should not be a basis for taking any trade action by an individual investor. Therefore, your own due diligence is highly advised before entering a trade.

FOMC MEETING Spy is on the come up 453 is next test pass that point 458 but with fomc meeting next week spy could see a decline. So lets time this out next looks green a couple more days of green but if spy gets lower then 447.50 then we go to 444-440 balling it. it can go that low if the fomc meeting goes south. but looks like we are in rise up is this a bubble or actually growth hard to say many stocks are still down and spy is a technology ETF. but if still stay green watch for 453 rejection once passed we go to 458 but watch for 453.

FrogAlgo: USA Economy💥It is important to understand that the US economy represents approximately 25% of the global GDP, despite having just 334 million people, which is around 4.25% of the global population. This context is crucial for comprehending various narratives prevalent in media and politics. Here are a few examples to illustrate this point 🧵:
♦️China, with 1.45 billion people (18.5% of the global population), contributes $18 trillion (18%) to the global GDP.
♦️India, with 1.4 billion people (18% of the global population), generates $3.4 trillion (3%) of the global GDP.
♦️Russia, with 146 million people (1.87% of the global population), produces $2 trillion (1.9%) of the global GDP.
💥When the BRICS nations (Brazil, Russia, India, China, South Africa) are combined, their 3.3 billion people (43% of the global population) contribute $26 trillion (26%) to the global GDP.
💥Despite the large population of the BRICS nations, their economic output barely matches that of the 334 million Americans. However, it would actually be beneficial for the US if the BRICS nations were to increase their GDP. As these 3.3 billion people become wealthier, they would become potential customers for American high-end goods and services. Consequently, the US would see increased profits. It is worth noting that the US dollar would strengthen in such a scenario, considering the 334 million Americans would have significantly more affluent customers to cater to.
💥Comparatively, Russia's 1.9% share of the global GDP pales in comparison to the US's 25% share. This is also true when considering the collective economic power of the 32 NATO member nations or the 50 countries supporting Ukraine. By engaging in actions detrimental to its own economy, such as the annexation of Crimea or involvement in Ukraine, Russia's leadership, under Putin, has effectively committed economic suicide on behalf of its people. This situation has created a humanitarian crisis without any tangible benefits for Russia. Even if Russia were to conquer Ukraine and the former Soviet bloc, the strategy of scorched earth is not conducive to maintaining a healthy and vibrant economy.
💥These examples serve to demonstrate how understanding this piece of information can help individuals better contextualize and discern between the plethora of narratives, whether accurate or unfounded, that circulate constantly in various domains.

S&P 500, 6/23/23For Friday, 4467.50 can contain session strength, below which the market remains the defensive into next week, possibly yielding 4257.50 over the next 2 - 3 weeks.
Downside Friday, 4416.00 can contain intraday weakness, while breaking/opening below 4416.00 allows 4357.75 intraday, where the market can place a daily low.
A settlement today below 4357.75 signals 4299.50 on Monday, 4257.50 by the end of next week, likely contain weekly selling pressures when tested, possibly into later July.
Upside Friday, pushing/opening above 4467.50 allows 4509.00 intraday, able to contain buying through next week and below which 4257.50 is attainable over the next several weeks.
Inversely, a daily settlement above 4509.00 will keep the longer-term objective at 4616.50 in reach over the next several weeks.

SPY - Wyckoff DistributionSPY potentially could be in the beginning stages of a Wyckoff Distribution phase. Predicting price to gravitate between golden Fib zone for the UT & eventual UTAD before price falls in line with trend line ~320-330

S&P 500, 6/21/23The 4195.75 long-term support area can contain selling through the balance of the year, above which 4606.50 remains a 3 - 5 month objective, the 4808.25, January 2022 all-time high expected by the end of the year.
On the way up, 4606.50 can contain monthly buying pressures, with a settlement above 4606.50 indicating the targeted 4808.25 within 3 - 5 weeks, where the broader market can double-top on a monthly basis.
Downside, a weekly settlement below 4195.75 would be considered a significant failed long-term buy signal, in essence indicating 3898.25 within 2 - 3 months.

$SPY #S&P500 Parallel uptrendAMEX:SPY #S&P500 Parallel uptrend blue arrow is our proprietary algorithmic trading software buy signal. Blue line is support, a close below may end the up cycle.

Perfect storm breakout Several favorable factors indicate trend has changed. We had bounce off the 50 MA (Monthly). We set a higher low pivot. We had a breakout over a trendline from a cup and handle pattern. A BAM signal triggered on Jan 12th (bullish signal with excellent record). What more do you want?
I am hoping for a pullback to the .38 Fibonacci line...but may need to settle for .23. Market may make it hard to get a good position. When the train leaves the station it doesn't back up to let late-comers get aboard.
Many people clamoring this is a fake breakout. It may be...but price action is screaming we are going up for awhile. Use stops or keep close eye on market.

SPXL Weekly Break outI have been DCAing into SPXL and TQQQ the last 3 months. 5% left to allocate for these accounts and will DCA that the next 3 weeks presumably into any pull backs.
We got the MA 200 break out folks. Holding this trade for at least 1 year.

Dow Jones forming a Bullish IHS PatternAfter the Fed came up with the interest rates pause look at the chart of Dow Jones on weekly TF.
It is forming a Bullish Inverted Head & Shoulders Pattern.
Look a new ATH

Climbing a wall of worryAfter breaking above the resistance near $4,200, SPX continued to grind higher for nearly two weeks. Currently, it trades close to the $4,350 price tag. Despite tomorrow’s Federal Open Market Committee (FOMC) meeting, the market is exceptionally complacent. That is reflected in the low value of the VIX that returned to levels unseen since February 2020. Technicals like MACD and RSI continue to support the rally on the daily time frame, with RSI being just slightly away from breaking above 70 points; if RSI manages to break above this level, it will be very bullish for the short term. We expect this occurrence to be accompanied by a test of resistance at $4,400. However, if RSI fails to perform a crossover and MACD starts to flatten, it will raise our suspicion about the potential trend reversal. In addition to that, we are paying close attention to the support near $4,325. If the price drops below this level, it will be slightly bearish.
As for tomorrow’s FOMC meeting, general expectations are that the Federal Reserve will pause a hiking cycle and wait for more economic data to determine a further path for the monetary policy. That is because of the lagging effect of interest rates, which still have not hit the economy at full power. This decision might be viewed as an initial phase of pivoting and could act as another catalyst for the rally in the short term. The same positive effect can have today’s release of inflation data if it comes in cooler than expected. Overall, we think the short-term direction continues to favor bulls. In defiance of that, our view beyond the short-term/medium-term remains still inclined toward the notion that the U.S. economy is likely headed for a recession in the second half of 2023.
Illustration 1.01
Illustration 1.01 shows the daily chart of the VIX index. Interestingly, despite SPX hitting new 52-week highs, the volatility index rose in the past two trading sessions.
Illustration 1.02
Illustration 1.02 portrays the daily chart of RSI.
Technical analysis gauge
Daily time frame = Bullish
Weekly time frame = Slightly bullish
*The gauge does not necessarily indicate where the market will head. Instead, it reflects the constellation of RSI, MACD, Stochastic, DM+-, ADX, and moving averages.
Please feel free to express your ideas and thoughts in the comment section.
DISCLAIMER: This analysis is not intended to encourage any buying or selling of any particular securities. Furthermore, it should not be a basis for taking any trade action by an individual investor. Therefore, your own due diligence is highly advised before entering a trade.

spy looking bearish Looking at W high and this bearish divergence on the 8h. excepting a Hl minimum. #spy What Is SPY Stock? SPY is an exchange-traded fund that owns all the stocks in the Standard & Poor's 500 index. The S&P 500 is arguably the most important market measure used by investors and traders around the world — as it's the benchmark for trillions in dollars of investment

WITCHING FOLKSPlease don't get caught in the storm. scroll down to my previous postings about witching data. on the 13th we have FOMC data releasing as they have been inclined to pause interest rate hikes. however CPI data is released at 830 pre market. the crazy thing is over the past 3 CPI data releases Spy barely moved I remember almost all of last year when CPI released it was like earnings and the BIG WIGS WERE HATING AND STOPPED YET AGAIN A WAY FOR AVERAGE PPL TO GET RICH THATS WHAT THEY DO PLAY GAMES> anyway here on the 4hour we have bearish confluence forming . the know what's coming so they will try to hold this up probably until Thursday after noon. if your going to be placing puts please hedge your positions. because I expect the first move to happen wayyyyyyy before Friday.my next resistance is show above at 438, still yet no sell off and OMG look at TESLA contracts went from $70 to $700. You do not want to miss this fall.

SPY S&P 500 etf price after the Debt Ceiling DealSPY, the S&P 500 index etf, perfectly touched the resistance predicted in the last article:
Now I`m waiting for a retracement and considering the following puts:
2023-8-18 expiration date
$408 strike price
$4.50
Of course, it`s not trading advice!
Looking forward to read your opinion about it!

SPY S&P 500 Index ETF and the Debt Ceiling DealThe political climate is favorable for a small rally of SPY, the S&P 500 Index ETF, towards the next resistance level of $430.
After several weeks of tense negotiations, President Joe Biden and House Republicans have reached an agreement in principle to address the debt limit and cap spending. The debt-ceiling deal is now finalized, and here are significant parts of the agreement:
First, the agreement suspends our $31 Trillion debt ceiling until January 2025, providing some relief and avoiding immediate concerns.
Additionally, the agreement ends the pause on student loan repayments, allowing borrowers to resume their payments. This decision aims to ensure the stability of the student loan system and address the long-term financial implications.
Furthermore, the agreement includes stricter work requirements for low-income and older Americans who receive food stamps. These requirements are intended to encourage self-sufficiency and help ensure that federal aid benefits are effectively utilized.
Regarding IRS funding, the agreement entails a $20 billion reduction from the initially proposed $80 billion budget. This reduction specifically targets the allocation meant to crack down on tax evasion by wealthy individuals and corporations.
Moreover, the deal puts an end to the ongoing freeze on monthly student loan payments and interest. It also introduces restrictions on the President's ability to reintroduce such a freeze in the future.
To avoid contentious debates until after the next presidential election, the agreement suspends the debt limit until January 2025. This decision provides a temporary relief from potential conflicts surrounding the debt limit.
The agreement also implements new work conditions for Supplemental Nutrition Assistance Program (SNAP) recipients, raising the age limit for work requirements to 54. This measure aims to promote workforce participation and enhance the effectiveness of federal aid programs.
Overall, this comprehensive agreement addresses various aspects of the debt limit and spending caps, aiming to strike a balance between fiscal responsibility and supporting those in need.
My overall outlook is still bearish and i think the small rally could easily turn into a bull trap.
Looking forward to read your opinion about it.

The Debt Ceiling The debt ceiling in the US is a legislative limit on the amount of national debt that can be incurred by the U.S. Treasury.
President Biden and House Speaker Kevin McCarthy are set to hold a direct meeting on Monday following a weekend of intermittent negotiations regarding the nation's debt ceiling. This meeting takes place just days before the government faces a critical "hard deadline" where it risks running out of funds to meet its financial obligations.
The possibility of a government default is unprecedented and would have devastating consequences for the nation's economy. Yellen and economic experts have expressed concerns, highlighting the potential for the situation to become "catastrophic."
In the past, raising the debt ceiling used to be a routine act carried out by Congress, enabling the Treasury Department to continue borrowing funds to cover the nation's already incurred bills.
However, in recent times, the vote to raise the debt ceiling has become a point of political leverage, with lawmakers using it as a must-pass bill to push forward other priorities.
House Republicans, who hold the majority this Congress, are currently refusing to raise the debt limit unless President Biden and the Democrats agree to implement federal spending cuts and impose restrictions on future spending.
In my opinion, we will see a suspension of the debt ceiling to allow for negotiations to form and be completed. As a result, I have a short-term bullish outlook, followed by an anticipated drop to $392 after the announcement, whatever it may be.
Looking forward to read your opinion about it!

SPY at top of channel?Haven't published an idea yet so here is one. Clear up channel over last 2 months SPY. Hitting the upper side of the channel with 421 range being the point to retrace if channel holds. Potential Short/Put opportunity here tomorrow or early next week?

SPX lacks a trend Since April 2023, the Standard & Poor's 500 index has been going sideways, primarily fluctuating between $4,050 and $4,200. During this time, ADX has declined substantially on the daily time frame, reflecting the lack of a directional trend. We continue to be bearish on the index while waiting for a breakout from the narrow range.
Illustration 1.01
Illustration 1.01 displays the same setup we introduced recently (with a bearish trigger below Support 1 and tight stop-loss above it); the significance of Support 1 grew with the breakout on 4th May 2023 (when it successfully halted the price decline).
Technical analysis gauge
Daily time frame = Neutral
Weekly time frame = Neutral
*The gauge does not necessarily indicate where the market will head. Instead, it reflects the constellation of RSI, MACD, Stochastic, DM+-, ADX, and moving averages.
Please feel free to express your ideas and thoughts in the comment section.
DISCLAIMER: This analysis is not intended to encourage any buying or selling of any particular securities. Furthermore, it should not be a basis for taking any trade action by an individual investor. Therefore, your own due diligence is highly advised before entering a trade.

SPY S&P 500 ETF Double TOP Chart Pattern | Options to BuyIf you haven`t bought those SPY puts here:
Then looking at the chart, it seems like SPY has formed one of the most bearish chart patterns: the Double Top!
Assuming that the CPI report will come higher than expected this week, I would buy the following SPY puts:
2023-5-19 expiration date
$405 strike price
$1.62 approx.. Premium to pay.
Looking forward to read your opinion about it!
