SPY Short and Long on the channelJust IMO, and entertainment purposes.
Short at top channel till solid green line hits, SPY might break out and have a great early Feb.
Spy500

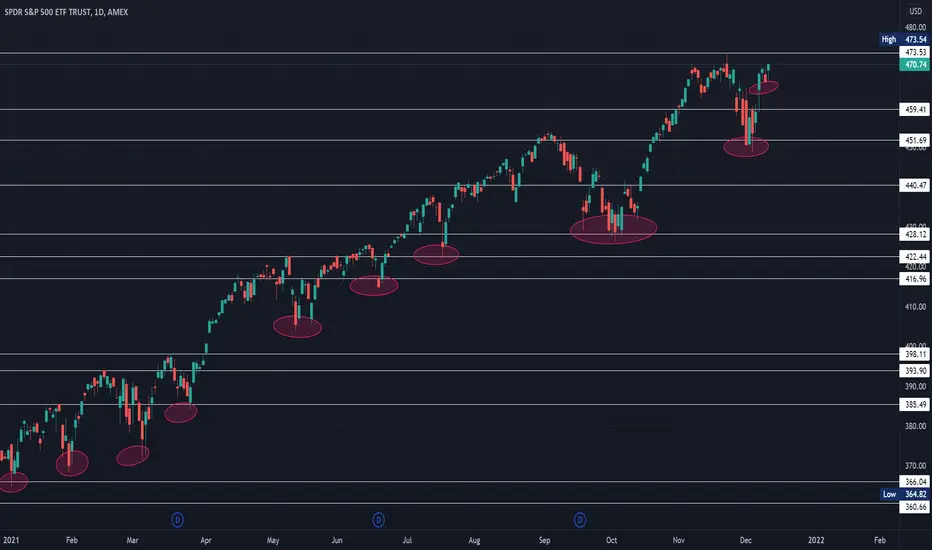
SPY Super Predictable.Hello Traders,
It's been awhile since I've shared with the class, so I figured I'd give a little Christmas treat.
In Dec., SPY has been extremely predictable so far. Those trendlines (the 2 red and 2 long green and blue), those were drawn around the 6th. As you can see, the PA has been very true to the trend.
Now, this is where it gets a little more exciting. IF TODAY CLOSES ABOVE THE NECKLINE, which happens to be the trendline, or one of the upcoming days... There is a potential IH&S (inverse head & shoulders aka H&S bottom).
I realize that is a little tight with that right shoulder only a point or so away from the bottom of the head, but technically it still applies. Since it is I would guess that this means there could be more Throwback (moves down before up) and this would hurt post breakout performance.
Note: this IHS could totally wipe since it's unconfirmed so far. Also, the target is not a prediction of date, could happen sooner, could happen later. The other wrench is the throwback, if we see a lot of it, the target will significantly be reduced. Even if we decide it's not going to be a IHS it's still an (Eve & Adam) double bottom with a fast reversal on the Adam side, so bullish either way.
With all that said, I think we are looking at a nice little melt up to end the year and pending any crazy news, we should also have a pretty bullish January. So move all of your doomsday predictions out at least a month bears.
Good luck and Merry Christmas.
Sincerely,
Mike
****Be sure to Like, Follow, Support****

SPY - Still targeting higher pricesCurrently forming a 4hr megaphone. A caveat to these patterns is you can gauge the strength or weakness depending on where support/resistance is found. Notice how price failed to tag the bottom of the megaphone before this runup. In my mind, this is a sign of strength and price likely consolidates before moving higher out of the megaphone. Looking for 510+ by Feb/March.

SPX500 volatility is back with good opportunitiesNever trade on news. Follow the support and resistance levels to find the direction and the right trading opportunities.
Using Aspen Trading S/R levels, we can see the support at 4559 level and short term resistance at 4616 level.
Aspen Trading S/R levels are invite only and can be accessed through url in my profile information. These levels can be drawn automatically on your charts and increase effectiveness in placing and managing trades.
Disclaimer: This analysis is for information purpose only and does not constitute any investment advice.

Cup and Handle on E-mini FuturesVery nice Cup and Handle Pattern formed on /ES. PT of 4686.75. Time for $SPY to run.

BULLISH $SPY we like how there is some buying into the close here, there is a big gap to be filled here, high chance it happens tomorrow...

SPY (S&P500 ETF) - Pattern, Support, Resistance, Trendlines 2021SPY (S&P500 ETF) - Price Pattern, Support, Resistance, Trendlines - 2021 - Daily Chart:
Price Pattern: potential Triple-Top.
-Resistance Price Levels (colored horizontal lines above current price)
-Support Price Levels (colored horizontal lines below current price)
-Trendline Resistance (diagonal yellow lines above current price)
-Trendline Support (diagonal yellow lines below current price)
note: chart is on log scale.

SPX - Is it possible the bubble hasn't even begun?What you see here is a ratio of SPX vs. the M2 Money Supply. Many inverse head and shoulders patterns in this chart, which should resolve to the upside.
FYI -
M1 = coins and currency in circulation + checkable (demand) deposit + traveler's checks. M2 = M1 + savings deposits + money market funds + certificates of deposit + other time deposits.
tldr; The FED is likely to continue printing money, creating a massive bubble and ultimately lead us into a crisis sometime this decade.
#CancelTheFED

Buying Kohl's (KSS) for a move up to $70!We've recently opened a LONG $KSS position using 2.59% of our equity. 💎
Macro framework
The U.S. stock markets have managed to stay on track with their outstanding bull run with less than 2 weeks left until the end of the year. It's true that we've seen some short-term spikes of volatility in the markets mainly driven by the uncertainty around the new COIVD variant (Omicron) and the highest inflation CPI readings since the 80's that we recently got. It seems that the global supply-chain issues are here to stay for longer than market participants expected, which is undoubtedly a worrying fact for the Federal Reserve. The severe supply and demand imbalances that we are seeing in the global economy are a direct product of these supply-chain issues and the weaker labor market. However, non of these market risks was able to substantially bring down the US equity markets. Furthermore, it seems that since Jerome Powell officially "dropped" the word "transitory" from the Fed's rhetoric in their last meeting, the market has already priced in a hawkish stance in their upcoming meeting this week. We believe that the Federal Reserve will continue to be extremely cautious with their tightening actions as they are very well aware of the risks and repercussions that a faster tightening policy could have on the markets.
Thus, we are still expecting to see a strong year-end rally for all risk-assets once the uncertainty around the ongoing Fed meeting goes away.
Why does investing in US mid-caps make sense at this stage?
Year to date, the mid-cap-centric S&P 400 Index has climbed 20.4%.
The large cap focused:
Dow Jones - 16.8%
S&P 500 - 24.3%
Nasdaq Composite - 20.4%
The small cap focused:
Russell 2000 - 12.4%
S&P 600 - 23.1%,
It's obvious that, mid-cap stocks have been among the best performing stocks so far in 2021.
Adding qualitative mid-cap companies to your portfolio could significantly optimize your portfolio position as a result of the meaningful diversification that they can bring. In many instances, mid-cap stocks combine the attractive features of both small and large-cap stocks. Mid-cap companies that have a strong market position in their respective industries, skilled and experienced senior management teams and are enjoying economies of scale can see their stocks moving sharply higher as a result of the companies' ability to enhance their profitability, productivity and market share.
There is quite a lot of uncertainty in the market and as a result improving the diversification of your portfolio through the addition of some of these stocks could be significantly helpful for you. You see, if the economic impacts of the new COVID strains are more severe ahead than what the market currently expects, mid-cap stocks will be less vulnerable to losses than their large-cap counterparts, as a result of their more domestic exposure and operations. On the other hand, if we don't see any further worsening of the crisis, these stocks are expected to perform better than their small caps counterparts due to their well-established management teams, broad distribution networks, brand recognition and ready access to the capital markets.
The company is a great Value pick, which we bought and sold earlier in the year for a profit of more than 30%. The company is part of an industry that we would like to increase our exposure to - "Multiline retail"- as we believe that the industry has already experienced a major correction throughout the last few weeks, which now presents an attractive buying opportunity. The main reason for adding $KSS and $M at this point is that we expect to see these companies capture a large portion of the heavy consumer spending that we anticipate to see in the next 4-8 weeks
The Company
💎Kohl's Corporation $KSS operates family-oriented, department stores that feature quality, national brand apparel, footwear, accessories, soft home products and housewares targeted to middle-income customers. Headquartered in Menomonee Falls, WI, Kohl’s Corp. operates more than 1,100 stores across 49 states.
Despite in general being recognized as place with lower selling prices, Kohl's also offers a plethora of private brands, which are characterized with much higher gross margins. Exclusive brands including Food Network, Jennifer Lopez, Marc Anthony, Rock & Republic and Simply Vera Vera Wang are developed and marketed through agreements with nationally-recognized brands.
Valuation
👉 $KSS has a P/B ratio of 1.51. The P/B ratio is used to compare a stock's market value with its book value, which is defined as total assets minus total liabilities. The lower the reading is, the better the company is valued. The company's current P/B looks attractive when compared to its industry's average P/B of 2.52.
From a Value investing standpoint the P/S ratio is also a metric that we need to look at more closely. This ratio is calculated by simply dividing a stock's price with the company's sales. This is a popular metric because sales are harder to manipulate on an income statement, so they are often considered a better performance indicator. KSS has a P/S ratio of 0.46. This again compares favorably to its industry's average P/S of 0.64.
Last but not least, we should also point out that KSS has a P/CF ratio of 6.19. This metric takes into account a company's operating cash flow and can be used to find stocks that are undervalued based on their current and future cash outlook. $KSS again looks as an attractive Value pick from that standpoint as its P/CF ratio is lower than its industry's average of 9.96.
📈Technical Analysis📈
From a technical standpoint, the stock also looks attractive as it has recently experienced a steep 23% correction and is currently sitting at a strong support level where buyers are expected to come back to the stock. The stock has been a victim of the constant and volatile sector rotation that we've seen in the recent months and we believe that the selling is heavily overdone at these levels. The stock is currently resting right around its 200-day moving average and right above the strong horizontal and psychological support level of $47. The relative strength index (RSI) shows that the positive momentum is coming back into the stock and we expect the see the stock challenging its 52-week highs around $64 in the next 6-8 weeks. Our 4-6 month target range for the stock is $70-80 where we would be interested in exiting our position in the stock.
Follow and copy us on eToro (@Dowexperts) for more detailed market analyses, profitable trading ideas and a consistent portfolio performance!
Kind regards,
@DowExperts

Fear and Greed indicators for SPX broader market - Crash 2021?Looks like the indicators are pointing very much downward.
During the last five trading days, volume in put options has lagged volume in call options by 38.17%, among the highest levels of put buying seen during the last two years, indicating extreme fear on the part of investors.
Bonds have outperformed stocks by 4.09 percentage points during the last 20 trading days. This is close to the weakest performance for stocks relative to bonds in the past two years
During the last month, approximately 14.93% more of each day's volume has traded in declining issues than in advancing issues
Only junk bonds are not following the fear trend... yet?

S&P 500 and BitcoinThe S&P 500 will likely bounce off current support next week based on previous price behavior. Since Bitcoin price action seems to be correlated to S&P 500 price action lately, that would be bullish for Bitcoin.

The Trend is your friend. Friday going to be fun.The last hour will see if we hit the trendline either today or tomorrow. The last test showed a false breakout and even a false breakdown on the lower trendline. Good Luck!

$SPY Pull back - Bearish Winter?Out look on $SPY. Could this be the beginning of a Bearish Winter?
Not financial advice!

SPY AnalysisThe Middle Gann line is of interest in this case
I propose an ascending broadening wedge to form above the middle Gann line
This is shown by the bars pattern placed
The 50MA is an area of support
The above idea can be applied to this ticker
It seems far fetched but when COVID is compared to other drops in the market, COVID outweighs them all, yet we receive the smallest bear move
Troubling

SPX Breaking above measured move.SPX breaking out above measured move. Market overshot on the downside, its possible we overshoot on the upside. Targeting 5100 March/April 2022


SPY - Break to downside? Gap up? or More the same?i added these little short term lines yesterday.
(Basically the range) its touching the diagonal line i put up.
i think we stay the same today. and going back to open price.
and either break up Monday or Tuesday. or Fall hard.
im more feeling the upside in the coming week.
esp if the dollar dips!
this is for progress keeping purposes only not advice.
happy weekend! Trade wise.

SPY (S&P500 ETF) - Trend, Support, Resistance - 11/2021SPY index ETF price has been in an uptrend & ascending channel throughout 2021.
Price is currently testing the upper resistance trendline (~$470).
Bearish Scenario: Price falls down below $466 to $460.
Bullish Scenario: Price breaks up above $470 to $480.
Support(s): $466, $464, $460, $455, $452, $448, $446.
Resistance(s): $470, $472, $476, $481, $485, $488, $494.
Note: Q3 2021 Earnings Season will end after mid-November.

#ES_F - Sellers Coming in Yet?
Judging by yerterday's failure to make any new highs, sellers might just be coming in today. If market is trading below level which was defended yesterday, we might just see further liquidation.
I am not 100% short at this time because the buying volume over the past few weeks have been quite 'healthy' but it is getting too over extended since the lows of October.

It is the FED day The markets are likely to choose a directional price path after the announcement and press conference that will wrap up around 3 PM Eastern.
While the market is pricing in hiking, it’s not actually pricing in tightening. Or to put it another way, it’s not pricing in the kind of move that would meaningfully slow down growth or inflation.
Aspen Trading S/R levels are showing resistance @ 4,628.25 and we should wait for the market direction after FED announcement. Overall, SPX500 looks really good for a bullish move to the upside.
Please like, share and follow if you agree with the analysis.
Note - Aspen Trading S/R levels are invite only. They can be accessed through my profile information.
Disclaimer: This analysis is for information purpose only and does not constitute any investment advice.

SPY Major Downside Into NovemberExpecting a Y leg downwards within a WXY complex correction structure. This will create around a 6-8% drop in the S&P500 over the next month or so. The drop will likely take the form of a three-legged correction (internal WXY subdivision) which will end with a large acceleration downwards.

SPY looking bullish-swing playSPY is looking bullish. First PT $447 and second PT $There is a lot of strength on DTF
