IMPORTANT WEEK! MARKET VOLATILITY EXPECTED!TICKER:$SPY
We closed friday with a big red day; Largest red day since October 1st of 2019. This is due to the financial sector (XLF) topping out at the all time high.
Next week is a very important week for the market. FOMC is on Wednesday in addition to tech earnings ($AAPL, $AMZN, $FB, $MSFT, etc...). I expect high volatility this coming week and depending on this week, the market will either consolidate or continue to reach all time highs.
Regardless if its bulls or bears, I am looking to go aggressive this coming week. If XLF continue to dump with spy breaking the low of friday (327.36), I will play TVIX.
However, bulls still have complete control on the daily and weekly time frame. Anything above 320.15 is just a daily HL.
Spy500

#SPY $SPX500 #SP500 catching the Top, any Bears alive?Hello My fellow Bears, so before I share my thoughts I want to just tell you that shorting the SP500 was not a good Idea.
Major Uptrend Longest Bullrun in History, Fed pumping liquidity , Stock Majors Buyback Excess and Trump Tweets.
And by the way the Oval Office released a note that there will be a 11 am EST an Pressmeeting - just right about the overnight time when Major Index began showing some Weakness - Coincidence or do we see a new "Stockrocket All Time high" Tweet by Trump Today?
I was able to get my Short Position on the SP500 right after the Overnight Break, with a very tight Stop Loss just to be protected against any irrational Market Move caused by some Tweet.
My Key Area was the SP500 Trading around 3330 and how it will behave around there.
So what is the Pirce doing on 4H timeframe
Still Above 50 EMA
Still above 200 EMA
4H Stochastic pointing down
lower high on the RSI while price is making higher highs
Targets
50 EMA (green)(if it Holds the price this will probably move again up)
100 EMA (purple)
200 EMA (red) this is my First Major Target if this Short plays out (Probably i am going to close the half Position there, it all depends how we would or could arrive there, if we overshoot with this Pullback I would set my Stoploss into a Take Profit right Above the 200 SMA and let it run.
Target Area Explanation
If the SP500 would Pull Back from 3330 Area it would target next Support Zones and would be still in a Major Uptrend.
0.236 Fib Retracement vicinity
200 EMA and 200 SMA on the 4H Timeframe for Support
lower Rising Trendline from the rising Channel for Support
Market could retest the 3200 Area were we had some Volatility at the Start of January.
So if you are holding a Short or having thoughts about opening one, just be prepared to watch these key Levels.
Happy Bull-Hunting and Trade Safe.

SPY Looking strongSPY has had a few dips in the past, all however have led to the continuation of a bull run, recently price has dipped, price will most likely continue trading against the 1 fib line for some time before the next dip. Green fractal indicates continuation of this trend.

This Is Where You Should Be SHORTING The Stock MarketIF SPX goes above 3160. This count is invalidated.
Red box means shorting box.

SP500 - 3045 followed by retraceBy looking at the weekly and applying a Fibonacci measured from the pre-2008 crash into the 2009 low, we can create future price targets.
Isn't math neat? ;)
You can see the 1.618 level held as strong resistance before finally breaking through upon Trump's sweeping electoral victory.
The next target is 2.618 or roughly 3040.
Indicators are bullish and prices are already at all time highs but not quite to 3k. More room to run.
We could see a slow melt up to 3000 before pulling back.

IS gonna fly sooooo hard kidinsane bull flag created no idea why so many bears with the bla bla of a drop
chart indicated buls in control
daily rsi crossing and now rettesting the support this it 294 293 support bounce need to happen from here if no change to go under 290 area
a break into 302 or 299 will indicated that spy will go for new highs

acb drop is over?spy been dripping the marked and dropping all the stocks with him now spy is at 293 in a ossible bull flag a major move from here will make all the market fly the mj cannabis etf is also at atl again about to bounce agressive in any time
most indicator show exhasted drop may be it the big pump lets seee
was expecting bounce at 5 or 4,80 but looks like 4,60 4 coe to play in the table the level where bounces of 100% 120 % been hapening few times lets see

SPY: Following the trend tomorrow morningMarket open will select the trend direction, just follow it.
Long or Short SPY after market open 30 minutes.


SPY: Daily Chart - Good time for short!4H chart, it is 2nd sell signal & 3rd signal sell at the same time

If You're Bearish on SPY, Here Are Your Potential TargetsSome people think we will see a big sell off on the SPY, I think also we will see some selling pressure increase, so here are some targets to look for as sellers maintain pressure. I would look for bull divs on the daily time frame to play any short term bounces. You want that EQ of the channel to hold if it does go back into the trading range. If it breaks, look for a bounce from the bottom of the TR. But if we fall back in, I remain bearish and I will look for a long term target (blue line). This is not financial advise. This is for me, personally.
SPY shortThe technical analysis that I ran this morning on the S&P 500 look as if it can be headed for a correction. Looking the history in the recent months the Elliot wave theory can be applied on the recent uptrend of the index. With the dip in May-June it looks as if the SPY may be going into an Elliot wave theory correction. Also looks like a double top reversal pattern forming as well. It is also important to note the amazing bull run the market has been on since the 2008 financial crisis. We are due for a huge market dip and this may be it.

SPY Untill Elections, Fractal count:3Pretty much just long $JNUG and watch $OILU for potential moves early morning. mostly watch USOIL for drops and long JNUG

S & Party OverSPY 50% Crash Looms
S&P500 Index is a benchmark for the US and global equity markets
Historial 10 Year Bullrun posted 300%+ gains
Technicals show top forming since Jan 2018
Fundamentals align for recession: US-China Trade war, Gov Bonds rally, USD continues strong, Treasury Yield Inversion, Minimum Unemployment
Bears target a 40-60% retracement
Bulls look to buy a reversal between 140-180 in 1-2 years

SPY drop: final ABC correction by the bookText book elliot wave growth, text book AB correction, now only remaining the the text book C decline after the text book CB triangle. Can not find a more text book case in book texts.

SPY towards 263 possibilityMap these Elliot Wave points and combine with Fib Retracement / Fib Trend Retracement. You will find text-book hits on text-book fib levels. I cleaned all of this away for a better final movement view, which is:
A retracement towards 0.618, but fundamentals might shake things up! Down it goes nontheless.

SPY - around May 8th you will pee in your pantsHistory repeats itself, both on RSI, price action and even volume trends.

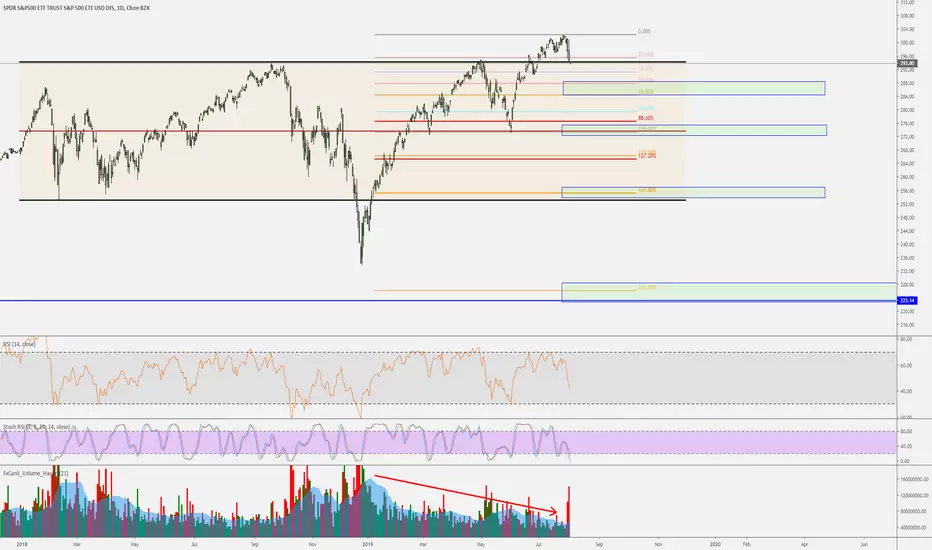
SP500 SPY ETF supply and demand analysis and forecastSP500 QQQ ETF supply and demand analysis and forecast for 22nd April 2019. SP500 SPY ETF is trying to break weekly supply at all time highs around 293.
There is a clear long term weekly and monthly uptrend with all time highs previously eliminated and brand new demand zones created on bigger timeframes like the one on the weekly timeframe around 281.
In an uptrend, supply levels are eliminated and demand levels are created and respected.NASDAQ QQQ ETF has already broken all time highs, expecting to see similar price action on QQQ and other american indexes like Dow Jones and Russell 2000 indexes.The bigger the impulse created by new imbalances of demand the better. There is no reason to go short counter-trend on SP500 SPY ETF when everything is heading north and new demand levels are being created. Trading with the trend is always higher odds.

Parallel channel resistance (1994 - present)A single reason not to be long at present levels: ascending parallel channel resistance on the long term monthly chart.

SPY Retracement Scenario Before Continued Sell OffHere is a scenario for a 50%-61.8% retracement for SPY, up above $282, before continuing it's sell off.
Looking to the left, there was a very similar structure in late February into early March. You can see how the peaks are quite identical, and on the low following the last peak, there was a retracement between 50%-61.8%... and also to the area of the 100MA.
Currently, that would represent a bounce up above 282 before the selling resumes.
On the current chart, I drew 2 fib lines...
The left one is just to show that the intraday bounce on Friday, March 22 came no where near the level that could be expected from the earlier chart, which would have been between 282.30 and 282.90. It instead topped out at 281.51. This was also well short of the 100MA. If that was THE retracement, then steep selling is likely to continue.
If the low associated with the left fib lines is not "the low following the last peak", then we can count it as not in yet, and take the lowest low from the end of the day. The right fib lines are to show how high the retracement could be before the selling continues. Also, notice the little RSI divergence to end the day...
Both scenarios are bearish, and would see new lows by this time next week.
This is merely to point out the precedence of a possible nice bullish play before we get there....IF the bounce to 281.51 was not it.
Travis
JMJ - UIOGD

SPY - Ready For The RedLooking at technical
Bearish indicators forming
SPY has been levitating with no real organic growth

SPY | Multiple Bearish Indicators...Wheres the volume?After weeks of bullish action.
Multiple Bearish Indicators formed.
WHERES THE VOLUME?!?

SPY Bearish Indicators FormingSPY may continue its sideways chop.
Downside pressure gets stronger.
With no volume we are getting held up by very little.
