SPY 0DTE Bearish Setup – Max Pain in Play (Aug 7)## ⚠️ SPY 0DTE Bearish Setup – Max Pain in Play (Aug 7)
**Low-Conviction Market = Short-Term Put Opportunity?**
### 🧠 Summary of Consensus:
All major models (Grok, Gemini, Claude, Llama, DeepSeek) flag the **lack of bullish momentum**.
💡 **Key Bearish Signals**:
* 📉 Price below VWAP
* 📊 Weak volume
* 📉 RSI & flow: neutral to bearish
* 🎯 Max pain hovering near current price
---
### 🤖 AI Model Breakdown:
| Model | Bias | Action |
| -------------- | ------------------- | ---------------------------- |
| Grok / Gemini | 🔻 Weak Bearish | No trade (wait for clarity) |
| Claude / Llama | 🔻 Moderate Bearish | Buy PUT at \$630 |
| DeepSeek | ⚖️ Mixed Bearish | Monitor – no high-conviction |
🧭 **Consensus Direction**: **Weak Bearish**
---
### 🔧 Trade Setup (0DTE)
| Metric | Value |
| ---------------- | ------------- |
| 🎯 Instrument | SPY |
| 🔀 Direction | PUT (SHORT) |
| 💵 Entry Price | 0.78 |
| 💣 Strike Price | 630.00 |
| 🛑 Stop Loss | 0.39 |
| 🎯 Profit Target | 1.56 |
| 📅 Expiry | Aug 07 (0DTE) |
| ⏰ Entry Timing | Market Open |
| 📈 Confidence | 60% |
📊 **Risk/Reward**: 1:2
📉 **Time Decay Alert**: Tight stop-loss due to fast 0DTE decay.
---
### ⚠️ Key Watchouts:
* 📈 Reclaiming VWAP = **exit immediately**
* 🔊 Sudden volume spike = momentum shift risk
* 🧯 Keep position size small – this is a **scalp**, not a swing
---
### 🧠 Final Take:
> If SPY stays pinned below VWAP & max pain remains, this **0DTE put could print**. But discipline is everything — tight stop, tight leash. ⚔️
---
🧠 **Follow for daily AI-backed earnings & SPY plays**
📉 **Not financial advice – manage risk like a pro**
Spyanalysis

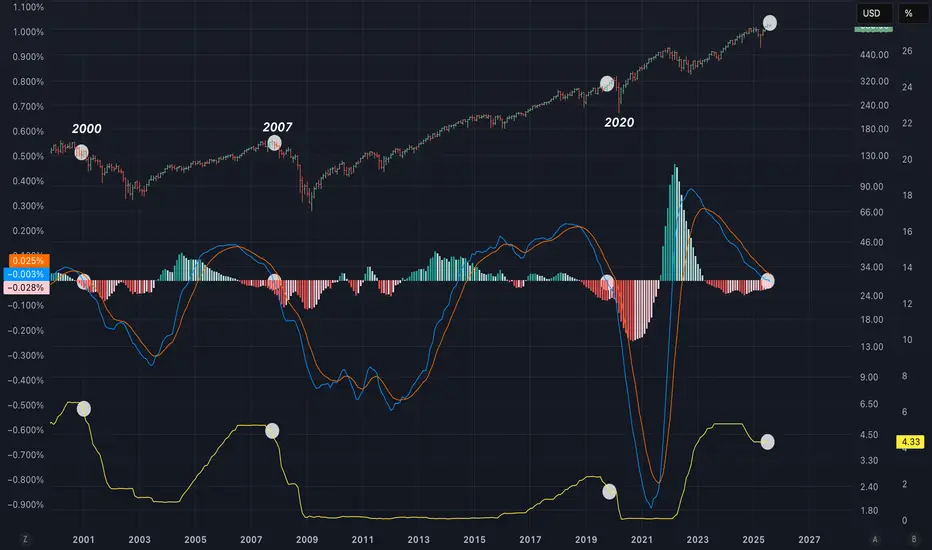
LMACD of the US02Y has just dipped bellow 0!In the past while rates have been elevated for a period of time things have gone bad for risk markets once the LMACD dipped bellow 0. Could be this time different?
SPX 0DTE TRADE IDEA – JULY 25, 2025
⚠️ SPX 0DTE TRADE IDEA – JULY 25, 2025 ⚠️
🔻 Bearish Bias with Weak Volume – Max Pain Looming at 6325
⸻
📊 Quick Market Snapshot:
• 💥 Price below VWAP
• 🧊 Weak Volume
• 📉 Max Pain @ 6325 = downside pressure
• ⚖️ Mixed Options Flow = no clear bullish conviction
⸻
🤖 Model Breakdown:
• Grok/xAI: ❌ No trade – weak momentum
• Claude/Anthropic: ✅ Bearish lean, favors PUTS near highs
• Gemini: 🟡 Slightly bullish bias, BUT agrees on caution
• Llama: ⚪ Neutral → No action
• DeepSeek: ❌ Bearish → No trade
⸻
📌 TRADE IDEA:
🎯 SPX 6365 PUT (0DTE)
💵 Entry Price: $0.90
🎯 Profit Target: $1.80 (💥 2x return)
🛑 Stop Loss: $0.45
📆 Expires: Today
🕒 Exit by: 3:45 PM
📈 Confidence: 65%
⏰ Entry Timing: OPEN
⸻
⚠️ Risk Flags:
• Low volume = fragile conviction
• Possible reversal if SPX breaks above session highs
• Max pain magnet at 6325 could limit gains or induce a bounce
⸻
🧠 Strategy:
Scalp it quick. Get in early. Exit before the gamma games explode into close.
📈 Like this setup? Drop a 🔽 if you’re playing puts today!
#SPX #0DTE #PutOptions #OptionsTrading #MaxPain #SPY #MarketGamma #TradingSetup

SPY Options Analysis Summary (2025-07-22)
🔻 AMEX:SPY Weak Bearish Put Setup (0DTE) – 07/22/25
All models agree: price is weak, momentum is limp, and VWAP is above.
But conviction? Not unanimous. High-risk, high-reward 0DTE scalpers only.
⸻
📉 Trade Setup
• 🟥 Direction: PUT
• 🎯 Strike: $626.00
• 💵 Entry: $0.57
• 💰 Target: $1.70 (+200%)
• 🛑 Stop: $0.28 (–50%)
• 📅 Expiry: Today (0DTE)
• ⚖️ Confidence: 65%
• ⏰ Entry Timing: Market Open
⸻
🧠 Multi-AI Consensus
Model Bias Action
Grok/xAI Weak Bearish ⚠️ No Trade
Claude Weak Bearish ⚠️ No Trade
Gemini Bearish ✅ $627 Put
Llama Moderately Bearish ⚠️ Conservative Put
DeepSeek Bearish ✅ $626 Put
🔹 VWAP < Price = Bearish bias
🔹 RSI = Neutral → watch for fakeouts
🔹 VIX favorable (<22)
🔹 Volume = weak = risk of whipsaw
⸻
⚠️ Risk Notes
• Bounce risk off session lows is real
• Lack of momentum may cause theta burn
• Best for scalpers who react fast — not a swing trade
• No conviction = smaller size, tighter leash
⸻
📢 Tagline (for virality):
“ AMEX:SPY is limping, not bleeding. But if it breaks, 200% comes fast. 0DTE scalpers: this is your window.” 💣

Opportunity Beneath the Fear: SPY's Reversal SetupIn the Shadow of Headlines: SPY’s Drop Could Be 2025’s Big Opportunity
As markets react sharply to renewed tariff fears and Trump-related headlines, SPY continues its descent. Panic is setting in—but behind the noise, a strategic opportunity may be quietly forming.
While many rush to exit, others are beginning to position for the bounce. A well-structured entry strategy could be key to turning uncertainty into gains.
Entry Zone (Staggered):
🔹 543: First watch level—look for signs of slowing momentum.
🔹 515: Deeper entry point as the selloff extends.
🔹 <500 (TBD): Stay flexible—if panic accelerates, this could mark a generational setup.
Profit Targets:
✅ 570: Initial rebound target.
✅ 590: Mid-range level if recovery builds.
✅ 610+: Full recovery potential—rewarding those with patience and vision.
Remember: Headlines fade, but price action and preparation stay. This selloff may continue—but it might also be laying the foundation for 2025’s most powerful move. The key? Enter with discipline, protect your capital, and let the market come to you.
⚠️ Disclaimer: This content is for educational purposes only and does not constitute financial advice. Trading carries significant risk. Always conduct your own research and use proper risk management.

Spy chart for 6/25/25This and patience, it can change based on how we open for New York session but we will see

SPY (S&P500) - Price Testing Support Trendline - Daily ChartSPY (S&P500 ETF) price has just closed below $600 and is currently under a support trendline.
If price cannot breakout above the $600 and $605 resistance level this month, a pullback could occur down to the support zone.
SPY price could potentially pullback to various levels of support due to:
-USA domestic conflict
-International military conflicts
-Technical chart bearish divergence
-USA federal reserve interest rate news
-Government and corporate news
Support Levels: $595, $590, $585, $580.
Resistance Levels: $600, $605, $610, $615.
The 50EMA/200EMA Golden Cross is still on-going, and support prices of $580 and $568 have yet to be tested significantly.

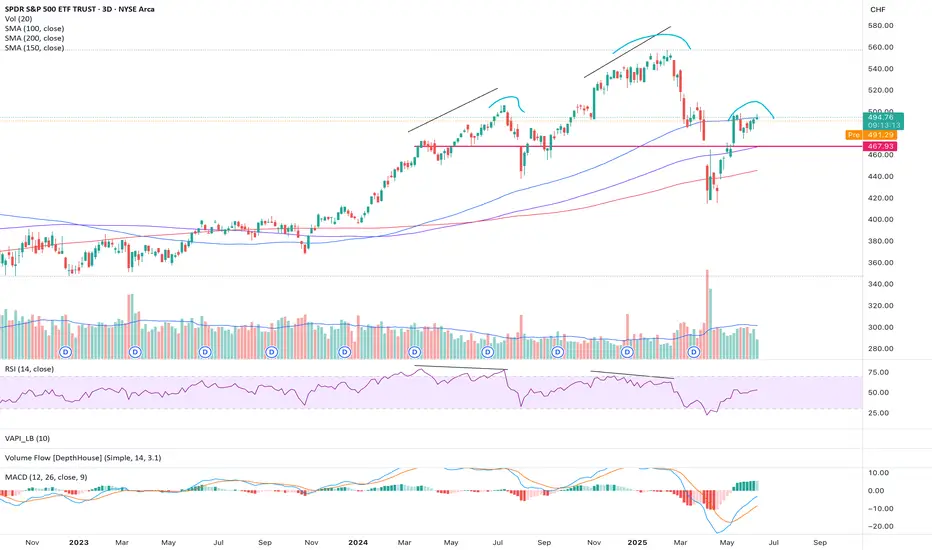
SP500 in CHF terms, bearish outlook- checking the SP500 in USD seems misleading these days
- therefore I checked it with CHF and earlier movements made more sense
- RSI bearish divergences were followed in earlier periods
- now we have a potential head and shoulders formation
- seems more likely to head south
TOP WAVE COUNT QQQ or SPY both same We had a higher high in the futures at 4 am . since that point we have declining I look for the market to still reach that price .But I know there was a lot of selling overnight today is day 37td since low

ES Futures Trading Signal - 2025-05-25ES Futures Analysis Summary (2025-05-25)
Comprehensive Summary of Each Model
Grok/xAI Report
Market context: Price $5,875 above 9-, 20-, 21-, 50-day MAs, just under 200-day SMA at $5,804.75; RSI ~59 neutral; price near upper Bollinger Band. Bias: Moderately Bullish, potential breakout above BB. Trade Plan: Long at 5,900; SL 5,840; TP 6,050; 1 contract; confidence 0.65.
Claude/Anthropic Report
Market context: Price above 20/50/200-day SMAs; RSI ~59; MACD histogram slightly negative; healthy pullback within uptrend. Bias: Moderately Bullish. Trade Plan: Long at 5,875; SL 5,825; TP 5,975; 1 contract; confidence 0.68.
Llama/Meta Report
Market context: Price above 20/50-day SMAs, just under 200-day SMA; RSI neutral; BB middle at 5,787.7. Bias: Moderately Bullish. Trade Plan: Long at 5,880; SL 5,810; TP 6,000; 1 contract; confidence 0.65.
Gemini/Google Report
Market context: Price above all key MAs (20/50/200, EMA9/21); RSI neutral; MACD lines above zero but slight bearish cross; recent 24h bounce after 5-day pullback; BB upper at 6,060.7. Bias: Moderately Bullish. Trade Plan: Long at 5,875; SL 5,845; TP 5,935; 1 contract; confidence 0.70.
DeepSeek Report
Market context: Same MAs and indicators, but emphasizes MACD bearish crossover, price rejection at upper BB, recent pullback. Bias: Moderately Bearish near-term. Trade Plan: Short at 5,875; SL 5,925; TP 5,800; 1 contract; confidence 0.65. Areas of Agreement and Disagreement
Agreement:
All models note price trading above short- and medium-term MAs. RSI ~59 (neutral, room to run). BB upper band is resistance; MACD histogram negative. Consensus that recent 5-day pullback is either consolidation (bullish view) or warning sign (bearish view).
Disagreement:
Directional bias: Four models bullish vs. one moderately bearish. Entry levels: range 5,875–5,900. Stop-loss zones: 5,810–5,840. Take-profit zones: 5,935–6,050. Clear Conclusion
Overall Market Direction Consensus: Moderately Bullish Recommended Trade: Long ES futures
Entry Range: 5,870–5,880 (target 5,875) Stop Loss: 5,845 (30-point risk) Take Profit: 5,935 (60-point reward, 2:1 R:R) Position Size: 1 contract (adjust per account risk; ~1% equity) Entry Timing: Market Open Confidence Level: 70%
Key Risks and Considerations:
Short-term bearish MACD crossover may lead to choppy action or minor pullback. Volatility spike at market open can cause slippage. Negative macro or news catalysts can derail technical setup. ES is highly correlated with broader equity futures; cross-asset moves may amplify moves.
TRADE_DETAILS (JSON Format)
{ "instrument": "ES", "direction": "long", "entry_price": 5875.00, "stop_loss": 5845.00, "take_profit": 5935.00, "size": 1, "confidence": 0.70, "entry_timing": "market_open" }
📊 TRADE DETAILS 📊 🎯 Instrument: ES 📈 Direction: LONG 💰 Entry Price: 5875.0 🛑 Stop Loss: 5845.0 🎯 Take Profit: 5935.0 📊 Size: 1 💪 Confidence: 70% ⏰ Entry Timing: market_open
Disclaimer: This newsletter is not trading or investment advice but for general informational purposes only. This newsletter represents my personal opinions based on proprietary research which I am sharing publicly as my personal blog. Futures, stocks, and options trading of any kind involves a lot of risk. No guarantee of any profit whatsoever is made. In fact, you may lose everything you have. So be very careful. I guarantee no profit whatsoever, You assume the entire cost and risk of any trading or investing activities you choose to undertake. You are solely responsible for making your own investment decisions. Owners/authors of this newsletter, its representatives, its principals, its moderators, and its members, are NOT registered as securities broker-dealers or investment advisors either with the U.S. Securities and Exchange Commission, CFTC, or with any other securities/regulatory authority. Consult with a registered investment advisor, broker-dealer, and/or financial advisor. By reading and using this newsletter or any of my publications, you are agreeing to these terms. Any screenshots used here are courtesy of TradingView. I am just an end user with no affiliations with them. Information and quotes shared in this blog can be 100% wrong. Markets are risky and can go to 0 at any time. Furthermore, you will not share or copy any content in this blog as it is the authors' IP. By reading this blog, you accept these terms of conditions and acknowledge I am sharing this blog as my personal trading journal, nothing more.

SPY Weekly Options Trade Plan 2025-05-25SPY Weekly Analysis Summary (2025-05-25)
Model Summaries
Grok/xAI Report
Technicals: SPY at $579.11, below short-term EMAs (10/50 on 5-min), above 200-period EMA, RSI oversold on 5-min, MACD bearish. Daily chart neutral to slightly bearish. Sentiment: Rising VIX (22.29), max pain at $580. Trade: Buy 2025-05-30 577 put at $5.12, profit target ~3-point move, 20% stop loss, confidence 65%.
Claude/Anthropic Report
Technicals: 5-min and daily charts bearish but RSI oversold intraday. Volume selling peaked. Sentiment: Max pain $580, heavy OI at 575/570 puts, futures up. Trade: Buy 2025-05-30 581 calls at ~$4.91, profit targets 25–50%, 30% stop loss, confidence 65%.
Llama/Meta Report
Technicals: Moderately bearish on 5-min EMAs and MACD, daily neutral. Sentiment: Elevated VIX, max pain at $580. Trade: Buy 2025-05-30 579 put at $5.95, 20% profit target, 10% stop loss, confidence 70%.
DeepSeek Report
Technicals: Mixed signals—5-min oversold vs. daily bearish. Sentiment: Stuck between support $576.86 and max pain $580. Trade: No recommendation (confidence 45%).
Gemini/Google Report
Technicals: Daily and 5-min bearish, price under key EMAs. Futures suggest gap up to $581–581.50. Sentiment: Rising VIX, max pain at $580. Trade: Fade the open—buy 2025-05-30 578 puts at ~$2.20, target $3.00, stop ~$1.60, confidence 65%. Agreement and Disagreement
Agreement
Short-term bearish bias: Most see SPY below intraday EMAs and bearish MACD. Elevated volatility: All cite VIX rising above 20 as a risk factor and opportunity. Max pain magnet: Models note $580 as a gravitational level.
Disagreement
Directional tilt: Claude is moderately bullish (buy calls), others lean bearish or neutral. Trade entry strike: Puts at 577, 578, 579 vs. calls at 581. Risk parameters: Profit targets and stop losses vary widely (10–50% of premium). Conclusion and Recommendation
Overall Market Direction Consensus: Moderately Bearish. SPY is below key short-term EMAs, MACD on multiple timeframes is negative, and although oversold conditions could spark a bounce, the preponderance of models favors downside.
Recommended Trade
Strategy: Buy a single-leg naked put Instrument: SPY weekly put expiring 2025-05-30 Strike: 577.00 (ask $5.12) Premium: $5.12 Entry Timing: At market open, assuming SPY does not gap significantly below $579 or above $581. Profit Target: 40% gain (premium ~$7.17) Stop Loss: 25% premium loss (premium ~$3.84) Size: 1 contract Confidence Level: 65%
Key Risks and Considerations
SPY could bounce strongly from oversold levels or pre-market futures strength, invalidating the bearish setup. Theta decay accelerates late in the week; monitor time decay. VIX spikes could amplify premium and widen bid-ask spreads.
TRADE_DETAILS (JSON Format)
{ "instrument": "SPY", "direction": "put", "strike": 577.0, "expiry": "2025-05-30", "confidence": 0.65, "profit_target": 7.17, "stop_loss": 3.84, "size": 1, "entry_price": 5.12, "entry_timing": "open", "signal_publish_time": "2025-05-25 21:27:17 UTC-04:00" } 📊 TRADE DETAILS 📊 🎯 Instrument: SPY 🔀 Direction: PUT (SHORT) 🎯 Strike: 577.00 💵 Entry Price: 5.12 🎯 Profit Target: 7.17 🛑 Stop Loss: 3.84 📅 Expiry: 2025-05-30 📏 Size: 1 📈 Confidence: 65% ⏰ Entry Timing: open 🕒 Signal Time: 2025-05-25 21:27:49 EDT
Disclaimer: This newsletter is not trading or investment advice but for general informational purposes only. This newsletter represents my personal opinions based on proprietary research which I am sharing publicly as my personal blog. Futures, stocks, and options trading of any kind involves a lot of risk. No guarantee of any profit whatsoever is made. In fact, you may lose everything you have. So be very careful. I guarantee no profit whatsoever, You assume the entire cost and risk of any trading or investing activities you choose to undertake. You are solely responsible for making your own investment decisions. Owners/authors of this newsletter, its representatives, its principals, its moderators, and its members, are NOT registered as securities broker-dealers or investment advisors either with the U.S. Securities and Exchange Commission, CFTC, or with any other securities/regulatory authority. Consult with a registered investment advisor, broker-dealer, and/or financial advisor. By reading and using this newsletter or any of my publications, you are agreeing to these terms. Any screenshots used here are courtesy of TradingView. I am just an end user with no affiliations with them. Information and quotes shared in this blog can be 100% wrong. Markets are risky and can go to 0 at any time. Furthermore, you will not share or copy any content in this blog as it is the authors' IP. By reading this blog, you accept these terms of conditions and acknowledge I am sharing this blog as my personal trading journal, nothing more.

Rising wedge on SPY - Melt up? or Next leg down? Immediate Bias (Tomorrow):
Scenario 1 – Bullish Continuation (Low Probability unless there's a macro catalyst):
Breaks above ~$596–$598 cleanly
Retests that zone as support (watch 595.50 intraday)
Then targets:
600 psychological
604–608 upper resistance channel
Possible end-of-month blow-off top: 612–618
Scenario 2 – Pullback / Rejection (More Probable Setup):
Rejected at ~596–597 zone (which aligns with upper wedge resistance)
Breakdown below $590 intraday
Then targets:
587.80 EMA cluster (20/50)
If lost → 576.44 next EMA + demand level
Followed by major support at 565.87 / 563.43
🔥 Week Ahead Trade Plan (May 20–24)
✅ Bullish Possibility:
If NVDA earnings, FOMC minutes, or macro data surprise to the upside
Watch for breakout above the red wedge and hold above 600
Target range: 604 → 612 max upside
🚨 Bearish Scenario:
Wedge breakdown below ~$590
Momentum cracks down to:
587
576 (watch for bounce)
If panic selling → 565–563 (larger time frame buying zone)
Volume divergence and overbought EMAs support a potential cool-off.
📅 Monthly Projection (End of May):
If wedge breaks down → consolidation range between 563 – 587
If wedge breaks out → blow-off rally up to 612–620, but likely to fade quickly
Fed commentary and NVDA earnings on May 22 will be major catalysts
📌 Key Levels
Type Price Notes
Resistance (R3) 612–618 Final upside blow-off zone (channel top)
Resistance (R2) 604 Overhead channel line
Resistance (R1) 595–598 Wedge top + major resistance
Support (S1) 587 EMA cluster + strong local demand
Support (S2) 576 Clean structure + prior breakout
Support (S3) 565–563 Confluence of long-term EMAs + trendline
🎯 Trade Setups
📉 Bearish (Favored if no breakout tomorrow):
Short 595–597 with stop above 600
Targets: 587 → 576
Optional: Add below wedge break (~590)
📈 Bullish (Confirmation-based):
Break + retest of 597–600
Target: 604, then scale out at 612
Avoid front-running long unless you see volume + price close outside wedge

SPY Breakout Watch: Triangle Pressure Builds Above 590SPY has surged in a strong V-shaped recovery from the March low of ~480 to testing major resistance around 595–600. The daily chart shows sustained higher highs and higher lows, but price now stalls at a key supply zone with multiple doji candles—signaling indecision. A rising trendline provides strong support near 570.
Zooming into the 60-minute chart, SPY forms an ascending triangle with flat resistance at 590 and rising support from 584. Volume contraction suggests accumulation, priming a potential breakout. A 60-min close above 590 targets 596, with a stop under 588.
On the 15-minute timeframe, bull-flags form frequently after morning gaps, with breakouts typically launching 4–5 points higher. VWAP and the 20-MA converge near 588.5, making it an ideal pullback entry zone.
Strategy for May 19–23:
Long on a clean breakout above 590 (target: 594–596)
Stop under 587.5–588
Caution if daily closes below 570
Expect early-week upside tests of 590–594, followed by a potential breakout toward 595–600. If a high-volume rejection occurs near that zone, a quick scalp-short may be in play.

SPY Technical Outlook – Bullish Continuation Favored Above $584SPY remains in a strong uptrend, confirmed by a bull flag breakout on the daily chart, with price currently testing the $588–590 resistance zone. A rising channel on the hourly chart has guided price since early May, with repeated bounces off the lower trendline around $578–582. Recent volume expansion on breakouts reinforces bullish conviction.
On the 15-minute chart, a breakout and retest setup around $585–586 suggests a low-risk intraday long opportunity. The intraday VWAP and moving averages support this level, with momentum favoring a push toward $590. A failure to hold $584 could open downside to $582 or $578.
The near-term trading bias remains bullish above $584, with targets of $590–592. Short-term traders should look to buy defined pullbacks with tight risk, while watching for volume to confirm continuation. If $590 breaks with strength, swing targets extend to $595–600. Conversely, a breakdown of the hourly channel would favor quick shorts targeting support zones below.

SPY in Focus: Tactical Day Trading Amid a Bullish RecoveryAs of early May, SPY consolidates around $560–$570, testing former support-turned-resistance.
On the daily chart, the market is pausing after a rapid rally, with $610 as major resistance and $540–$485 as key support. The 1-hour chart reflects a solid uptrend with recent consolidation between $555–$568, while the 15-minute chart shows intraday weakness with critical support at $560.
Three trading strategies emerge: (1) Bullish breakout, buying above $564–$568 with targets up to $580;
(2) Bearish breakdown, shorting below $560 with downside to $545; and
(3) Range trading, buying/selling within $558–$568 using tight stops. Confirmation via volume and candlestick patterns (e.g., engulfing or hammer) is essential.
Short-term bias is bullish, but with caution—if SPY holds $560, it could retest $570 or break higher. A drop below $556 invalidates the bullish outlook.

$SPY bear flag target between $387-443AMEX:SPY has been consolidating in a bear flag since April 7th. Should we break down from the flag, I can see a sharp move down to the lower support levels.
I think the most likely targets are at $443 and $409. However, it's possible we can find support at the other targets as well.
I think the move likely plays out before June. Let's see where we end up bouncing.
Invalidation of the downside would be a break over $567.

CHIP SECTOR TO CRASH SMH The chart posted is the SMH we are now in the final 5th wave and it is a classic 5th wave Diagonal in the 5th wave wave to form a double top into fib cycle peak .From here we should see a major break down in All chip stocks into Oct 2025 but we should see the first leg down low march 10/20th 2025 this should be a Very Bearish action world wide see spy and qqq as well . This is the warning to All traders EXIT INTO RALLIES THE BEST OF TRADES WAVETIMER

SPY Weekly Options Trade Plan 2025-04-15AMEX:SPY SPY Weekly Analysis Summary (2025-04-15)
Below is an integrated view of the models’ findings:
─────────────────────────────
SUMMARY OF MODEL KEY POINTS
• Grok/xAI noted that on very short timeframes the price is a bit below key 5‑minute EMAs and near lower Bollinger Bands—with RSI and MACD giving mixed signals—but on the daily chart some bullish features (price above the 10‑EMA, a slight MACD bullish grace, and a max pain level at $549) hint at a potential mean reversion. Their “if forced” ramp suggested a call at the $549 strike, though overall confidence was low (≈55%).
• Gemini/Google’s report highlighted conflicting technical readings – the M5 setup looked bearish while the daily chart showed a little bullishness. Their integration of high but falling VIX and options open‑interest levels led to an overall neutral/unclear reading. Their recommendation was to refrain from entering a directional trade at open.
• Llama/Meta leaned toward a moderately bearish reading based on the short‐term indicators (price below key EMAs, bearish MACD on both charts) despite some daily support. They specifically recommended buying the $537 put option (even though the premium is higher than the “ideal” $0.30–$0.60 range) with a target profit roughly 50% above the cost and a stop when SPY breaches an upper resistance level—backed by a 70% confidence level.
• DeepSeek also synthesized mixed timeframes – pointing out that while the market holds some daily support, the intraday picture is muddled by technical conflict, expensive premium costs for the moves required, and time decay factors. Their view was to wait rather than initiate a new position.
─────────────────────────────
2. AREAS OF AGREEMENT AND DISAGREEMENT
• Agreement: All reports recognize that SPY (about $537.61) is trading near key short‑term support levels with significant options OI clustering. The falling VIX is universally noted as a positive sign for reducing fear even though overall volatility remains high.
• Disagreement:
– Grok’s report and to some extent the daily charts hint at a slight bias to the upside (supported by max pain at $549), suggesting a potential call wing trade.
– In contrast, Llama/Meta’s analysis and the very short‐term indicators (M5, lower Bollinger band, bearish MACD) point toward a bearish bias, recommending a put trade.
– Both Gemini/Google and DeepSeek, however, find the technical signals too mixed to have high confidence in initiating any naked single‑leg weekly option trade at open.
─────────────────────────────
3. CLEAR CONCLUSION
• Overall Market Direction Consensus:
The models collectively paint a picture of uncertainty. There is no clear, high‑conviction directional bias at the open. The short‑term (intraday) technicals lean bearish or at best neutral, while the daily chart and max pain argument hint at a potential slight mean reversion. Given these conflicting signals, the overall market direction remains neutral/unclear.
• Recommended Trade:
Based on the clash in opinions—only one model (Llama/Meta) would go short (with puts) while two models (Grok/xAI and Llama/Meta) suggest if forced a trade—and given that the majority (Gemini/Google and DeepSeek) advise against trading in the current conditions, the consensus is not to enter a new weekly options position at the market open.
– Strategy: Single‐leg, naked options (calls or puts)
– Expiration: Weekly options only (expiry April 17, 2025)
– Premium: Trading ideal premium range is $0.30–$0.60, but neither candidate in the call nor put space meets all our criteria with high conviction
– Entry Timing: At open would be the plan if a trade were to be placed
– Confidence: Overall confidence in any trade is low (<60%)
• Key Risks and Considerations:
– The short‑term technical indicators (lower EMAs, bearish M5 MACD, tight Bollinger bands) could trigger a whipsaw if SPY moves sideways or reverses abruptly.
– The high but falling VIX signals that although volatility is subsiding, levels remain elevated.
– Time decay (theta) on weekly options is significant at the open, and the probability of a strong directional move is diminished without further confirmation during the session.
– Conflicting signals between daily trend (some bullish pointers) and intraday behavior reduce the reliability of a directional play.
─────────────────────────────
4. FINAL RECOMMENDATION
Given the model consensus with mixed and conflicting signals, the recommendation is to NOT trade weekly SPY options at market open today.
─────────────────────────────
TRADE_DETAILS (JSON Format)
{
"instrument": null,
"direction": null,
"strike": null,
"expiry": null,
"confidence": null,
"profit_target": null,
"stop_loss": null,
"size": null,
"entry_price": null,
"entry_timing": null
}
Disclaimer: This newsletter is not trading or investment advice but for general informational purposes only. This newsletter represents my personal opinions based on proprietary research which I am sharing publicly as my personal blog. Futures, stocks, and options trading of any kind involves a lot of risk. No guarantee of any profit whatsoever is made. In fact, you may lose everything you have. So be very careful. I guarantee no profit whatsoever, You assume the entire cost and risk of any trading or investing activities you choose to undertake. You are solely responsible for making your own investment decisions. Owners/authors of this newsletter, its representatives, its principals, its moderators, and its members, are NOT registered as securities broker-dealers or investment advisors either with the U.S. Securities and Exchange Commission, CFTC, or with any other securities/regulatory authority. Consult with a registered investment advisor, broker-dealer, and/or financial advisor. By reading and using this newsletter or any of my publications, you are agreeing to these terms. Any screenshots used here are courtesy of TradingView. I am just an end user with no affiliations with them. Information and quotes shared in this blog can be 100% wrong. Markets are risky and can go to 0 at any time. Furthermore, you will not share or copy any content in this blog as it is the authors' IP. By reading this blog, you accept these terms of conditions and acknowledge I am sharing this blog as my personal trading journal, nothing more.

SPY LONG SET UP(BUY THE DIP)Entry 1 $500.00
Entry 2 $460.00
Stop loss $440.00
Take profit 1- $550.00
(Close 25%)
Take profit 2- $600.00
(Close 50%)
Take profit 3-$650.00
(Close 75%)
Take profit 4-$700.00
(Close 100%)

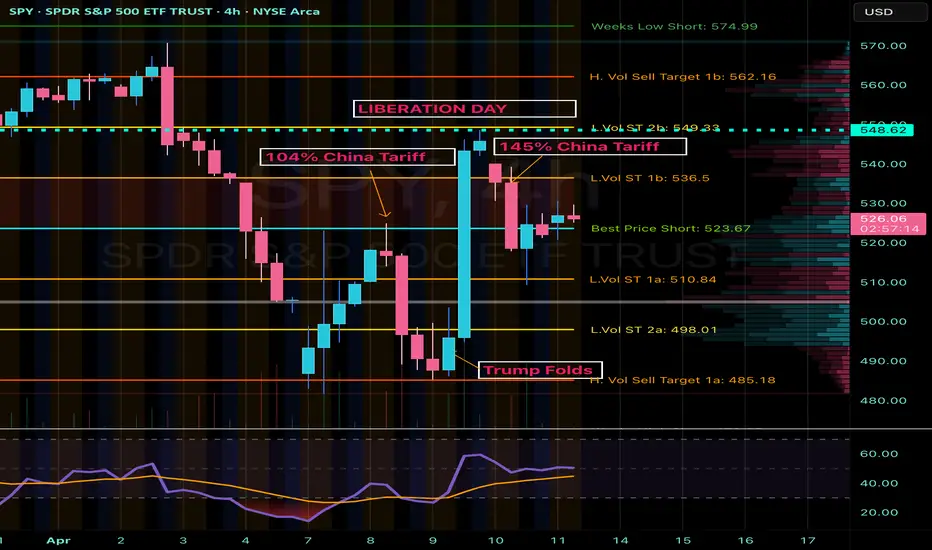
SPY Analysis: Navigating Tariff-Induced VolatilityContinuing from my last update, market volatility remains high due to Trump's unpredictable policy decisions. After initially folding and offering economic relief, Trump pivoted sharply with a sudden 145% tariff announcement. Today, China countered strongly with a 125% tariff. These escalating tariff exchanges continue to create significant uncertainty and market fluctuations, highlighting the critical need for careful analysis and precise trade management.
Technical Breakdown (4-Hour Chart)
Current Price Zone: Around $528.45
Key Resistance Levels:
- Immediate Resistance: $536.50 (L.Vol ST 1b)
- Critical Resistance: $549.33 - $549.60 (L.Vol ST 2b)
- Major Resistance Zone (Liberation Day): Approximately $562.16
Support Levels:
- Initial Support: $523.67 (Best Price Short)
- Secondary Support: $510.84 (L.Vol ST 1a)
- Important Lower Support: $498.01 (L.Vol ST 2a)
- Strong Support Level (Trump Folded area): ~$485.18
Trading Scenarios
Bullish Scenario (Potential Tariff Tension Relief):
- Entry Trigger: Confirmed breakout and sustained hold above resistance at $536.50.
Profit Targets:
- Target 1: $549.33 (next strong resistance level)
- Target 2: $562.16 (major resistance)
- Stop Loss: Below immediate support at $523.67, carefully managing downside risk.
Bearish Scenario (Ongoing Tariff Escalation or Increased Market Fear):
Entry Trigger: Inability to reclaim $536.50, or a decisive breakdown below support at $523.67.
Profit Targets:
- Target 1: $510.84 (nearest significant support)
- Target 2: $498.01 (secondary critical support)
- Target 3: $485.18 (robust support area)
- Stop Loss: Above resistance at $536.50 to protect against potential reversals.
Thought Process & Final Thoughts
The SPY currently trades within clearly defined resistance and support bands, heavily influenced by unpredictable tariff-driven headlines. Trump's volatile policy shifts and China's assertive retaliations amplify short-term market risks. Maintain flexible trading strategies, adhere strictly to established levels, and practice disciplined risk management. Continuous monitoring and swift response to evolving market sentiment will be essential for navigating this challenging environment effectively.
$SPY the final leg down? Bottom between $400 - $441It's looking like we're going to break the low I originally had at $481 from the top at $612.
The next most likely target is $441, and if we break that $414.
Both of those levels are good long term buys, the move should happen this week (and likely tomorrow) and that should mark the bottom for the market.

Island Bottom CONFIRMED on $SPY IF we GAP up tomorrow!Island Bottom CONFIRMED on AMEX:SPY SP:SPX IF we GAP up tomorrow!
I only believe we can GAP up tomorrow if there is news of China coming to the negotiation table with the U.S. after they raise the Reciprocal Tariffs to 104%.
If this doesn't happen, then this isn't confirmed, and we see a retest of $482, IMO!
I'm not playing this as a trade until we get confirmation! Too dangerous!
Not financial advice

SPY Technical Outlook - Will Buyers Step In?AMEX:SPY is experiencing a corrective move after rejecting the upper boundary of the ascending channel. This rejection led to increased selling pressure, bringing price back to the lower boundary of the channel, where buyers may step in to defend the trendline support.
If the price holds at this dynamic support level, a bullish reaction could send AMEX:SPY toward the midline of the channel, with the next target around 607.00. Holding above this level would reinforce the bullish trend structure and increase the probability of continuation toward the upper boundary of the channel.
However, a breakdown below the trendline support would weaken the bullish outlook and open the door for further downside. Monitoring price action, volume, and confirmation signals will be crucial in determining the next move.
