$SPYThe Trust seeks to achieve its investment objective by holding a portfolio of the common stocks that are included in the index (the "Portfolio"), with the weight of each stock in the Portfolio substantially corresponding to the weight of such stock in the index.
Spyforcast

2X $SPY 1D ANALYSIS! (SPY MEETS TRENDLINE)$SPY has been bullish since June '22, after it broke the short-term bearish trendline & ran for +10%. seeing the rejection of the trendline can mean a reversal wait on confirmation! Lot of Good FOMC new had stocks rallying up after news but spy didnt move a lot which lets me know either end of a trend/reversal or a fake breakout & a long consolidation period!
$SPY bulls in charge? maybe for now..$SPY momentum has been strong for the past few weeks. after the market switched gears to the upside after the government lifted off the covid restrictions this summer, and ok earnings in some of the big tech stocks couple weeks ago. i believe after the restrictions got lifted off, it helped the economy to get back on its feet. but despite the covid restriction being lit off, it created massive supply chain issues, and inflation. this is due to massive back log of the supplies that didn't get sold in the past 2 years because of the covid. Also, small businesses try to make up for the loss of profits during the pandemic.
here's my day trade price target for SPY on FRIDAY 08/15/22.
============================================================
For calls; buy above $429.17 and sell at 431.28 or above
For puts, buy below 426.49 and sell at 424.17 or below
============================================================
Welcome to this free technical analysis . ( mostly momentum play )
I am going to explain where I think this stock might possibly go the next day or week play and where I would look for trading opportunities for day trades or scalp play.
If you have any questions or suggestions on which stocks I should analyze, please leave a comment below.
If you enjoyed this analysis, I would appreciate it if you smashed that LIKE or BOOST button and maybe consider following my channel.

SPX bulls are backSPX500 has dropped 25% from its peak on Jan 22.
It has recouped around 14.5% loss and it is above 200 EMA.
The trend appears to have reversed. The market is in a bull phase now.
It is safe to be long if the market is above 4,200 levels.

Monitoring for bearish continuationMonitoring for bearish continuation after a bearish reversal at the 200 ema on 1D. RSI is calling for further downside...

SPY S&P 500 ETF Options ahead of the CPI reportThe Release of the Consumer Price Index for July 2022 is scheduled for Aug. 10, 2022, 08:30 AM.
Ahead of the CPI report next week, looking at the SPY options chain, i would buy the $390 strike price puts with
2022-11-18 expiration date for about $10.94 premium
or the $340 strike price for$3.29, same expiration date.
Looking forward to read your opinion about it.

SPY Trade Idea (BULL TRAP)Here Im using the trend based fib ext.
SPY is currently at the June highs and the 1.618 Fib level.
Seeing deviation with price making a higher high and the RSI making a lower low on the 4HR. (Bearish)
In June fear turned to euphoria in an instant. Talks about the bear market being over started, just like it is now.
Spy fell out of an ascending channel after initially getting rejected from the 1.618. (Bearish)
In June it took about a week to finally sell off and bull market talks faded in the. background. I think we see a similar story in the next few days and weeks.
If you're bullish i would be patient, things dont go up in a straight line. The RSI on the daily is at levels not seen since March. VIX is on a strong support which has generally marked local tops. If you notice there has been 3 times we previously touched this support and every time has been a sell signal. Same goes with the top resistance, every time we touched resistance it marked a local bottom in the stock market as you can see with the red and green arrows.
In the coming weeks I am bearish on SPY and anticipate a retest of 390, a break below that and the next level is 380.
However coming off one of the best months in a long time the medium to long term future looks bright for the stock market.
We look to be forming a possible inverse head and shoulders pattern on higher time frames and if this is the case we should see strong support in the 380-390 range. (This is where Im swinging long if the market gives us these levels). I would also like to see VIX at resistance to further confirm the trade.
I wouldn't be surprised if VIX broke out of this wedge, and give us the 40+ everyone has been calling for which if in fact we do reach those levels on VIX i think that would be the max opportunity to go long on the market. We will cross that bridge when/if we get there.
Ill soon be posting ideas on individual stocks, let me know if you guys agree or disagree!

SPY finishing off the (c) waveThe correction we have had in W-X-Y is an expanding flat that retraced 38% from wave (ii) and now after hours heading up in wave 5 to finish off the intermediate (c) wave.

S&P similarities to previous down turn showing up in marketsWith all the money printing, it is hard to see the stock market crashing but the similarities in charts are just to obvious to ignore.
Last year, I also pointed out the patterns I was seeing in Russel (see below) and so far it has been exactly.
Please do you own DD as this is not an investment advise.

$SPY 1D wedge/triangle breakoutLooking at the daily timeframe on $SPY we have some room to run on the upside. It's important to note 1h/4h timeframes are in overbought territory so the price could retrace temporarily before proceeding higher. The ball is in the bull's court... Also, with energy prices continuing to show bearish momentum this is a positive sign of the equity markets.

SPY Long towards $415Currently at uptrend towards $415 (SPX $4150-4200) . Expecting a pull back to form a 1F (blue) pivot area, then/or spike more next 1-2 days, then pull back to retest 30F ( green) pivot zone -- or build a 5F (red) pivot area for a further spike.

SPY S&P 500 ETF options ahead of big tech earningsLooking at the SPY S&P 500 ETF options chain today, i would buy the $360 puts with
2022-8-19 expiration date for about
$2.42 premium.
Looking forward to read your opinion about it.

(SPY) Triple Top FormingThe SPY chart is forming a beautiful triple top pattern, and with the up coming FED rate hike and (-) Q2 GDP data confirming a technical recession releasing July 28th. I believe that the triple top will be completed around the 29th of this month, and the SPY will drop to the bottom of the overall trend line at around $360. Also in this chart you can see that the SPY has strong resistance at the $390 price range and rejects hard back to support roughly at $370. Let me know what you guys think in the comments.

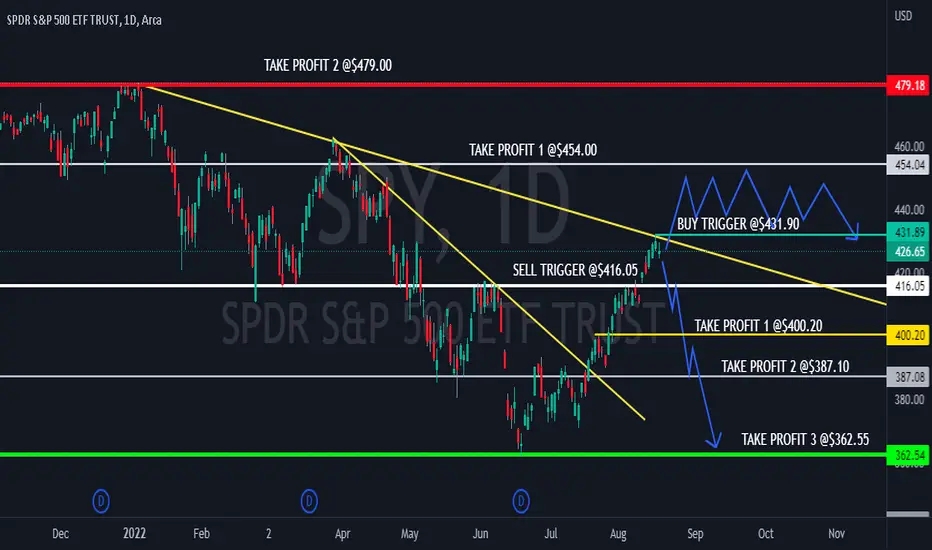
SPY breakout attempt Number 1Breakout attempts can happen without any triggers but when a trigger appears and coincides with market bottom, then there is an agreement and slight trading conviction that may be worth considering into the last half of the year. There is a daily wolfe wave setup that triggered on June 21 closing day at 3767.75. The projected target is calculated by extending a linear line between pivot 1 and 4 and projecting the line. This is represented as the green perforated line, as shown in the chart. The projected target is 4332 which is expected to reach this price target before Sept 30. Projected targets are defined by identifying the apex of the wolfe wave and projecting a vertical line toward the green perforated projection tgt which is extending from left to right.

SPYMY PERSPECTIVE IS WHAT CAN HAPPEN THIS WEEK!!
Looking overall, SPY is still in a downtrend. There is a possibility of 395 here because the market maker might try to liquidate some stop losses above 394. This week it's going to be a little volatile. I will consider buying some UVXY calls here or adding some shares if you are swinging shares. The market is overbought by comparing to vix as oversold. If the market dumps on Tuesday, UVXY will jump quickly as its movement is through the market's volatility. I'm going to grab some puts (STRIKE 367 EXPIRY AUGUST 19,2022)tomorrow at the end of the session, or if it triggers, ill buy on the spot with the market's movement.
Worst-case Scenario, if the market does the opposite close short position, add some long shares of spy with 405 strike calls for next week.

SPY Price Target for this monthI am targeting a lower low at the $358 support by the end of this month, due to the CPI report and the start of the Q2 earnings season with revisions.
Looking forward to read your opinion about it.

$SPYThe Trust seeks to achieve its investment objective by holding a portfolio of the common stocks that are included in the index (the "Portfolio"), with the weight of each stock in the Portfolio substantially corresponding to the weight of such stock in the index.

Looking for a retest of 410.64 on $SPY$SPY 1W looks like it wants to re-test that huge 410.64 support level turned resistance. Would expect it to be tested into end of month/early July.a

SPY either outlier or on perfect course You can see there is a strong difference between the real cyclical bear market and the current correction. Also the primary bull market last 25 years last time from 75' till the 00'. We are now at around half cycle (13 years in). Last cycle SPX did 20x since cycle low the cycle before was around 13x (if data reliable), now we have just done 6x really underperforming. The 52 weeks MA has been the support of the bull market cycle as you can see in the chart. Hence I doubt the current correction will last for much more.

SPY trading made simpleInside bar is the western term for harami...which is a reversal pattern. The more inside towards the opening of the candle is the spinning candle the more significant and higher it is the probability of the reversal...however the suggestion is always to wait and buy/sell on the breakout of the high/low.
FOLLOW SHARE, LIKE AND COMMENT

SPY 2008 vs 2022 Comparsion2008 vs 2022 weekly chart for SPY
With us touching the critical 200EMA levels, if this plays out similar to 2008, then we should expect a relief rally going back to 50EMA (~430) and then we hit true bottom a year from now in Summer 2023.
Stay safe!!!

$SPY sitting right at the 200 ema, looking for relief bounce$SPY sitting right at the 200 ema, looking for relief bounce, getting quite over-extended to the downside here. Would expect relief bounce into tomorrow with a long weekend the markets will be closed Monday for Juneteenth...

SPYIt's bear market territory whenever we see more than 20% retracement from ALL-TIME HIGH. The first retracement from an all-time high is always 33% (that's almost 320 for SPY)
I have made a technical analysis on how to play the bear market. The two red lines I have outlined can help traders when to short and when to go long. I'm going to swing shares of SPY (long/short).
