$SPY breakout in progressLooking for the retest of 410.64 daily level. Over 410.64, expect 416 in extension.
Spyforcast

SPYGameplan for May 17, 2022
Spy did hit resistance and support all day with a small ascending triangle in mid-session, then got rejected on resistance. At the end of the session, the spy broke the uptrend line but still needs support to break so we can short it.
We will see what happens tomorrow. For now, observe, and there can be two scenarios because when sideways is a trend, make sure to watch and then play when it breaks. If it breaks, resistance go long and breaks support will go short.

RSI slight positive divergence on 1D RSI slight positive divergence on 1D with a nice looking reversal. Early Monday/Tuesday will be watching for bulls to look for continuation to retest the daily $410.64 support level that is now our resistance.

SPYGAME PLAN FOR MAY 16,2022
Spy's significant resistance level, for now, is 403.50. Make sure to observe the market from 7:00 am till 9:45 am EST. There are two scenarios for now.
The first scenario is that if the resistance level gets destroyed, wait for the candle wick to come back at the resistance area from that point to go long to 410 -415 level.
The second scenario is that if the spy gets rejected from the resistance level and then the support area is 397.00 area if that gets destroyed as well, then short spy to 385 area.

SPY Game Plan for May 13, 2022
Make sure to observe the 392.50 area as spy resistance for now. If that resistance breaks, we must wait and have patience, then go long and never chase. Overall, spy daily RSI at 30. Significant consideration note to take. But still, plenty of room to go down as RSI is calculated and first, down to 30 can be a fakeout, then 50, fall again back to 30 RSI, which means price movement will be way different and can go down far beyond imagination.
Two Scenario for tomorrow:
First one: Observe the market from 7:00 am-9:30 am EST. If we see a sell of pre-market, then for sure, on market hours, we can touch the resistance of 392.50. then back down again.
Second: If the resistance gets destroyed, wait for the cool off previous resistance to become support and go long from 392-394.
OPTIONS
Look at May 20, 2022, 380 puts if 392.50 area gets rejected and go long when resistance gets denied, then play with May 20, 2022, 405 calls.

SPY S&P 500 Compared To 2008 - Will We Follow The Same Pattern?The daily chart for the S&P 500 looks eerily similar to the chart from the 2008 crash. We have already crossed below the VWMA 100 and VWMA 500 now which are both historically very supportive moving averages. I think it's very possible we chop around in this area for the next couple weeks while we wait for the VWMA 100 to cross below the VWMA 500, but if we can't stay supportive back above the VWMA 500, it will likely fall pretty hard. If it's anything like the 2008 crash, it should be a steep drop from here, but there are a lot of other factors at play so we will just have to wait and see.
The 2008 drop fell 56% from its high over about 510 days. If we perform the same this time, that would mean a drop to around $210 that would happen around the middle of 2023. Again this is just if we repeat the exact same thing statistically. $210 is also the low from the 2020 pandemic crash and a likely area for it to hold if it does make it down that far.
Something to note though is that when matching the two timeframe's chart patterns, the 2008 chart pattern took twice as long to play out. So with the bottom reaching a 56% drop over 510 days, it looks very extended and not very similar to the timeline from 2008. This makes me consider that if we do follow the pattern from 2008, it may happen in a shorter timeframe such as a year or so. This is purely speculative and obviously there are a lot of other things that factor into this, but I'm just comparing chart patterns here as possible outcomes.
We should see some good support in that purple cloud though on the way down. Those are the EMA 1000 and EMA 2000 which I are typically very strong support/resistance.
If we do follow the same pattern as 2008, I'm waiting for price to reclaim and stay supportive above the VWMA 100 before entering LEAP Calls when it rebounds. Then wait for price and the VWMA 100 to get back above the VWMA 500 for confirmation of another actual bull run to begin (but that could take 2+ years to happen again if this scenario plays out).
Drop your thoughts in the comments, I'm curious to hear what others have to say on this comparison.

$SPY 1D Linear Regression Channel$SPY testing the bottom of the 1D Linear Regression Channel into the market close today. Price has held the channel so far and we are keeping a close eye.

SPYSPY is trying hard to go up as it bounces back from the support and has seen the 405 level twice. This area should be considered in high demand for now. Looking at the futures right now, they are already down -0.50%.
Two more things to consider:
1. MACD is trying to cool off as well with RSI.
2. If we see a bounce back from here and break the downtrend, we might see a reversal, but if the 425-430 area gets destroyed.
I'm going to play with calls tomorrow because on May 11, there might be a sell-off considering the CPI report.

$SPY 1D Trendline$SPY is sitting at a big trendline on 1D/1W timeframes. We are keeping a close eye on how price reacts around here and are monitoring for divergences.

SPY Inverse Head and Shoulders PatternI think SPY is forming an Inverse Head and Shoulders Bullish Chart Pattern with a target of $480 by the end of the year.
Today the Contrarian Investing is a good idea: "Buy When There's Blood in the Street"!
looking forward to read your opinion about it.

Khans $SPY-Outlook 04/21/22Strong performance yesterday and DEMA 200 is now in sight. With futures pushing towards 4500 we should have a good chance to test it this week or at least next.

Spy forecast Spy levels to watch for- the yellow 436.58 being the 0.5% fib on the fib speed resistance fan. and 423.63 being the 0.38% or (.25%)
440 is acting as resistance. if it breaks lets see if it can hold and go from there. could test 442-443 again.
for my opinion and im racing the clock on this 15min edit window.
if we dont breech and go lower we stay between 437-441.50 (short term/ like today maybe/ highly unlikely).
if we do go lower, which i think that is a good chance, it COULD eventually test those 432-430-428 levels then reassess from there.
doesnt mean it has too. its just until goes lower there isnt really any big things to say till then. or im tired from retyping this.
that also doesnt mean i think we HAVE to go there before ripping faces off to the top side. this market is very wild and honestly today will be very telling

Spx500 Short SignalPrice is showing signs of shifting down. Took this short looking to gain 3R risking 10 points targeting 30. I expect price to take out yesterday’s low atleast but we shall see.
I am not a financial advisor so trade at your own risk and always follow your risk management plan!

SPY Short TargetI believe we will drop to atleast $400 in the coming weeks/months. Be careful as volatility is at an extreme. Goodluck everyone!

SPY Up ContinuationUsing an indicator called Parabolic Glitter
Similar points of reclamation of trendline are indicated in green rectangles
Up trend is in Orange
The parabolic glitter indicator shows the comparable drops and rises back to the trendline in both situations

Apple - Extremely Bearish Outlook - Andrew RoupasIn todays analysis, I will be looking at and breaking down the reasoning for my incredibly bearish stance against apple as we will be looking at the weekly time frame in todays breakdown. To begin, we can easily use prior levels of S&R in combination with Fibonacci levels of retracement, which in my opinion give us a clear map as to what will occur within the following weeks. We have obviously topped and this is clear by simple candlestick analysis as price has rejected numerous times on the Weekly and that the trend IMO is about to reverse. The floor is about to fall through and the first drop in price, based on fib levels that I have drawn, indicate $150 to be the target price which I have drawn a yellow line horizontally. Furthermore as we focus on the Moving average convergence divergence (MACD) specifically by focusing in on the histogram we can clearly see in my opinion a clear forecast of a drop in price. Buyers tried this past week to take back position, now that lower highs are being made and many buyers securing profits, this is a prime play in my opinion to short. Any comments or opinions would be greatly appreciated.

SPY S&P 500 ETF W-Shaped Recovery The SPY S&P 500 ETF wend down after the huge amount of puts that i noticed last week:
Now i am considering a W-Shaped Recovery to $470 by the end of Q2.
The Ukraine invasion was price in at $410 and the interest rates will be lower than expected due to the war.
Looking forward to read your opinion about it.

SPY: Bottom at 400-405Hello traders, here is my analysis for the SPY. Looks like a WXY correction to me. There is a gap that needs to be filled at SPY 400, and I believe that we will do this. Also, at that point W=Y, so it will be a beautiful symmetrical correction. Good luck traders.

SPY bearish options todayI was monitoring the SPDR S&P 500 ETF Trust (ETF) options market and the puts are dominating the options today.
2/3 puts, 1/3 calls and some important dark pool prints sells.
My expectation is for a retracement at the $422 area, followed by a W shaped recovery.
Looking forward to read your opinion about it.

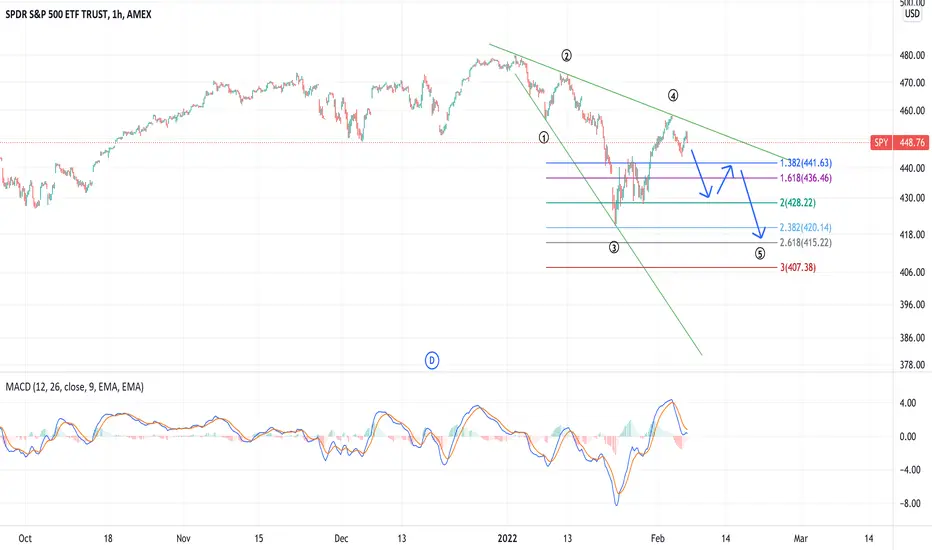
The bottom is NOT in on SPYSPY appears to be in an ending diagonal, like many other stocks, including AMD. I expect this to resolve with a double-bottom or a slightly lower low by February 18. After that, SPY will be set to set new ATHs.
SPY correction is overThe FUD induced sell off has come to a finish. The SPY showed that the 300 MA is a respected level of support by bouncing off of it Monday. This was followed by 3 inside bars. Multiple inside bars indicate consolidation, a close above that range in a downtrend indicates a trend reversal. A break below that range in downtrend would indicate continuation. The SPY had a strong day rally to close out the day that emphatically showed the downtrend is over. I expect a gap up over the 200 MA Monday morning and a push back to $450. QQQ has a similar setup although less bullish.

SPY forecastthese days the stock market is being really uncertain. After CPI and PPI news market was being roller coaster but today's SPY daily candle caught my eyes. Based on my TA market SPY, QQQ will be green. Let's watch how accurate will be my chart analysis.

$SPY Pull back - Bearish Winter?Out look on $SPY. Could this be the beginning of a Bearish Winter?
Not financial advice!
