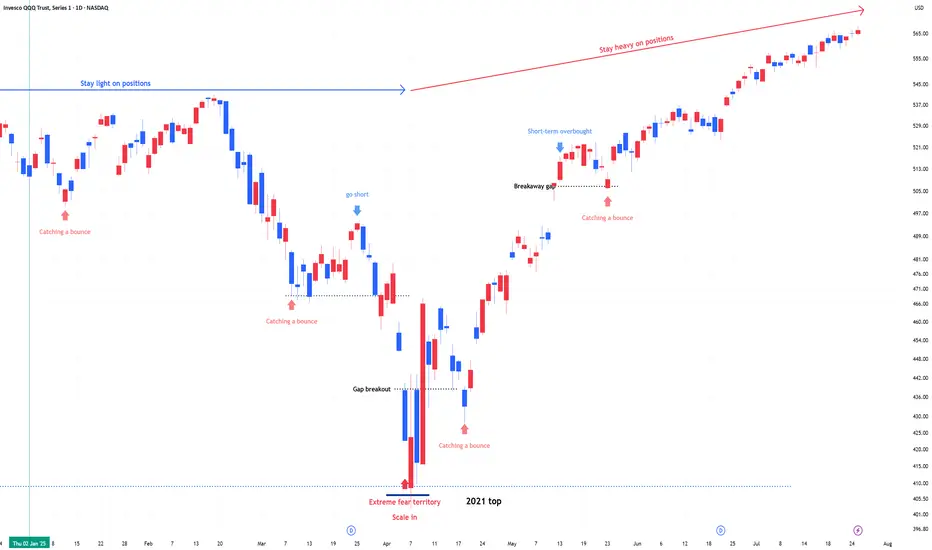
QQQ : Stay Heavy on Positions QQQ, QLD, TQQQ : Stay Heavy on Positions
Amid record-high markets, fear-hedging sentiment is slowly transitioning into renewed risk-taking.
When entering an underweight zone, I rotate out of QLD or TQQQ into QQQ and reduce overall exposure.
Spylong
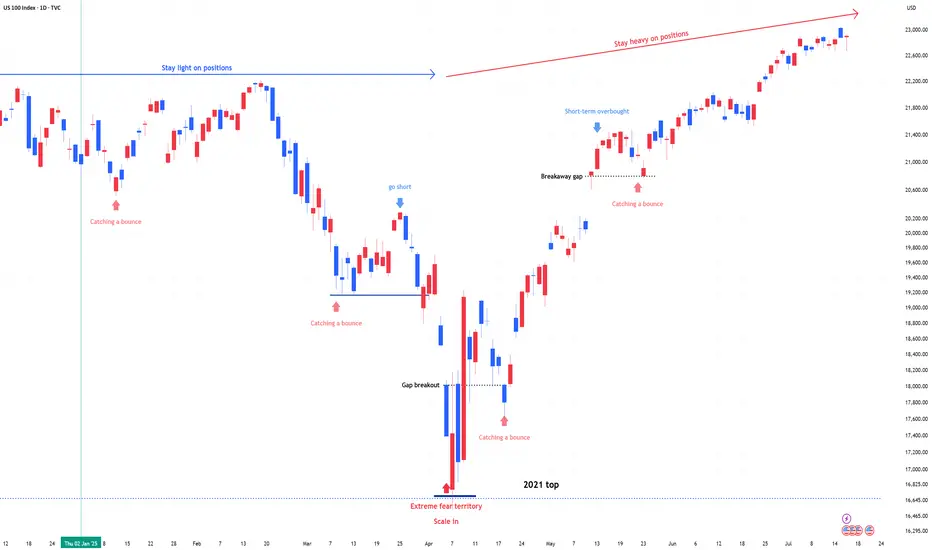
US 100 (NDQ) : Stay Heavy on Positions1) April Fear & Buy Signals
In early April, the Nasdaq 100 experienced a sharp sell-off, triggering extreme fear sentiment across the market.
At that point, scale-in buy signals appeared—classic "buy the fear" conditions.
2) Current Market State: No More Fear, but Watching
Since then, the market has stabilized.
The fear has disappeared, but we are still in a wait-and-see mode as traders assess the next move.
Momentum is holding, but participation remains cautious.
3) Stay Heavy on Positions
Despite short-term uncertainty, I’m maintaining an overweight position on the Nasdaq 100.
As long as we don’t see a major breakdown, the bias remains bullish.
Opportunity Beneath the Fear: SPY's Reversal SetupIn the Shadow of Headlines: SPY’s Drop Could Be 2025’s Big Opportunity
As markets react sharply to renewed tariff fears and Trump-related headlines, SPY continues its descent. Panic is setting in—but behind the noise, a strategic opportunity may be quietly forming.
While many rush to exit, others are beginning to position for the bounce. A well-structured entry strategy could be key to turning uncertainty into gains.
Entry Zone (Staggered):
🔹 543: First watch level—look for signs of slowing momentum.
🔹 515: Deeper entry point as the selloff extends.
🔹 <500 (TBD): Stay flexible—if panic accelerates, this could mark a generational setup.
Profit Targets:
✅ 570: Initial rebound target.
✅ 590: Mid-range level if recovery builds.
✅ 610+: Full recovery potential—rewarding those with patience and vision.
Remember: Headlines fade, but price action and preparation stay. This selloff may continue—but it might also be laying the foundation for 2025’s most powerful move. The key? Enter with discipline, protect your capital, and let the market come to you.
⚠️ Disclaimer: This content is for educational purposes only and does not constitute financial advice. Trading carries significant risk. Always conduct your own research and use proper risk management.

ES Futures Trading Signal - 2025-05-25ES Futures Analysis Summary (2025-05-25)
Comprehensive Summary of Each Model
Grok/xAI Report
Market context: Price $5,875 above 9-, 20-, 21-, 50-day MAs, just under 200-day SMA at $5,804.75; RSI ~59 neutral; price near upper Bollinger Band. Bias: Moderately Bullish, potential breakout above BB. Trade Plan: Long at 5,900; SL 5,840; TP 6,050; 1 contract; confidence 0.65.
Claude/Anthropic Report
Market context: Price above 20/50/200-day SMAs; RSI ~59; MACD histogram slightly negative; healthy pullback within uptrend. Bias: Moderately Bullish. Trade Plan: Long at 5,875; SL 5,825; TP 5,975; 1 contract; confidence 0.68.
Llama/Meta Report
Market context: Price above 20/50-day SMAs, just under 200-day SMA; RSI neutral; BB middle at 5,787.7. Bias: Moderately Bullish. Trade Plan: Long at 5,880; SL 5,810; TP 6,000; 1 contract; confidence 0.65.
Gemini/Google Report
Market context: Price above all key MAs (20/50/200, EMA9/21); RSI neutral; MACD lines above zero but slight bearish cross; recent 24h bounce after 5-day pullback; BB upper at 6,060.7. Bias: Moderately Bullish. Trade Plan: Long at 5,875; SL 5,845; TP 5,935; 1 contract; confidence 0.70.
DeepSeek Report
Market context: Same MAs and indicators, but emphasizes MACD bearish crossover, price rejection at upper BB, recent pullback. Bias: Moderately Bearish near-term. Trade Plan: Short at 5,875; SL 5,925; TP 5,800; 1 contract; confidence 0.65. Areas of Agreement and Disagreement
Agreement:
All models note price trading above short- and medium-term MAs. RSI ~59 (neutral, room to run). BB upper band is resistance; MACD histogram negative. Consensus that recent 5-day pullback is either consolidation (bullish view) or warning sign (bearish view).
Disagreement:
Directional bias: Four models bullish vs. one moderately bearish. Entry levels: range 5,875–5,900. Stop-loss zones: 5,810–5,840. Take-profit zones: 5,935–6,050. Clear Conclusion
Overall Market Direction Consensus: Moderately Bullish Recommended Trade: Long ES futures
Entry Range: 5,870–5,880 (target 5,875) Stop Loss: 5,845 (30-point risk) Take Profit: 5,935 (60-point reward, 2:1 R:R) Position Size: 1 contract (adjust per account risk; ~1% equity) Entry Timing: Market Open Confidence Level: 70%
Key Risks and Considerations:
Short-term bearish MACD crossover may lead to choppy action or minor pullback. Volatility spike at market open can cause slippage. Negative macro or news catalysts can derail technical setup. ES is highly correlated with broader equity futures; cross-asset moves may amplify moves.
TRADE_DETAILS (JSON Format)
{ "instrument": "ES", "direction": "long", "entry_price": 5875.00, "stop_loss": 5845.00, "take_profit": 5935.00, "size": 1, "confidence": 0.70, "entry_timing": "market_open" }
📊 TRADE DETAILS 📊 🎯 Instrument: ES 📈 Direction: LONG 💰 Entry Price: 5875.0 🛑 Stop Loss: 5845.0 🎯 Take Profit: 5935.0 📊 Size: 1 💪 Confidence: 70% ⏰ Entry Timing: market_open
Disclaimer: This newsletter is not trading or investment advice but for general informational purposes only. This newsletter represents my personal opinions based on proprietary research which I am sharing publicly as my personal blog. Futures, stocks, and options trading of any kind involves a lot of risk. No guarantee of any profit whatsoever is made. In fact, you may lose everything you have. So be very careful. I guarantee no profit whatsoever, You assume the entire cost and risk of any trading or investing activities you choose to undertake. You are solely responsible for making your own investment decisions. Owners/authors of this newsletter, its representatives, its principals, its moderators, and its members, are NOT registered as securities broker-dealers or investment advisors either with the U.S. Securities and Exchange Commission, CFTC, or with any other securities/regulatory authority. Consult with a registered investment advisor, broker-dealer, and/or financial advisor. By reading and using this newsletter or any of my publications, you are agreeing to these terms. Any screenshots used here are courtesy of TradingView. I am just an end user with no affiliations with them. Information and quotes shared in this blog can be 100% wrong. Markets are risky and can go to 0 at any time. Furthermore, you will not share or copy any content in this blog as it is the authors' IP. By reading this blog, you accept these terms of conditions and acknowledge I am sharing this blog as my personal trading journal, nothing more.

Rising wedge on SPY - Melt up? or Next leg down? Immediate Bias (Tomorrow):
Scenario 1 – Bullish Continuation (Low Probability unless there's a macro catalyst):
Breaks above ~$596–$598 cleanly
Retests that zone as support (watch 595.50 intraday)
Then targets:
600 psychological
604–608 upper resistance channel
Possible end-of-month blow-off top: 612–618
Scenario 2 – Pullback / Rejection (More Probable Setup):
Rejected at ~596–597 zone (which aligns with upper wedge resistance)
Breakdown below $590 intraday
Then targets:
587.80 EMA cluster (20/50)
If lost → 576.44 next EMA + demand level
Followed by major support at 565.87 / 563.43
🔥 Week Ahead Trade Plan (May 20–24)
✅ Bullish Possibility:
If NVDA earnings, FOMC minutes, or macro data surprise to the upside
Watch for breakout above the red wedge and hold above 600
Target range: 604 → 612 max upside
🚨 Bearish Scenario:
Wedge breakdown below ~$590
Momentum cracks down to:
587
576 (watch for bounce)
If panic selling → 565–563 (larger time frame buying zone)
Volume divergence and overbought EMAs support a potential cool-off.
📅 Monthly Projection (End of May):
If wedge breaks down → consolidation range between 563 – 587
If wedge breaks out → blow-off rally up to 612–620, but likely to fade quickly
Fed commentary and NVDA earnings on May 22 will be major catalysts
📌 Key Levels
Type Price Notes
Resistance (R3) 612–618 Final upside blow-off zone (channel top)
Resistance (R2) 604 Overhead channel line
Resistance (R1) 595–598 Wedge top + major resistance
Support (S1) 587 EMA cluster + strong local demand
Support (S2) 576 Clean structure + prior breakout
Support (S3) 565–563 Confluence of long-term EMAs + trendline
🎯 Trade Setups
📉 Bearish (Favored if no breakout tomorrow):
Short 595–597 with stop above 600
Targets: 587 → 576
Optional: Add below wedge break (~590)
📈 Bullish (Confirmation-based):
Break + retest of 597–600
Target: 604, then scale out at 612
Avoid front-running long unless you see volume + price close outside wedge

SPY Breakout Watch: Triangle Pressure Builds Above 590SPY has surged in a strong V-shaped recovery from the March low of ~480 to testing major resistance around 595–600. The daily chart shows sustained higher highs and higher lows, but price now stalls at a key supply zone with multiple doji candles—signaling indecision. A rising trendline provides strong support near 570.
Zooming into the 60-minute chart, SPY forms an ascending triangle with flat resistance at 590 and rising support from 584. Volume contraction suggests accumulation, priming a potential breakout. A 60-min close above 590 targets 596, with a stop under 588.
On the 15-minute timeframe, bull-flags form frequently after morning gaps, with breakouts typically launching 4–5 points higher. VWAP and the 20-MA converge near 588.5, making it an ideal pullback entry zone.
Strategy for May 19–23:
Long on a clean breakout above 590 (target: 594–596)
Stop under 587.5–588
Caution if daily closes below 570
Expect early-week upside tests of 590–594, followed by a potential breakout toward 595–600. If a high-volume rejection occurs near that zone, a quick scalp-short may be in play.

SPY Technical Outlook – Bullish Continuation Favored Above $584SPY remains in a strong uptrend, confirmed by a bull flag breakout on the daily chart, with price currently testing the $588–590 resistance zone. A rising channel on the hourly chart has guided price since early May, with repeated bounces off the lower trendline around $578–582. Recent volume expansion on breakouts reinforces bullish conviction.
On the 15-minute chart, a breakout and retest setup around $585–586 suggests a low-risk intraday long opportunity. The intraday VWAP and moving averages support this level, with momentum favoring a push toward $590. A failure to hold $584 could open downside to $582 or $578.
The near-term trading bias remains bullish above $584, with targets of $590–592. Short-term traders should look to buy defined pullbacks with tight risk, while watching for volume to confirm continuation. If $590 breaks with strength, swing targets extend to $595–600. Conversely, a breakdown of the hourly channel would favor quick shorts targeting support zones below.

S&P 500 Index Most Bullish Signal In 15 YearsThis is why it is very clear, certain, that the stock market, the S&P 500 Index (SPX) is set to grow in the coming months. Last week produced the highest volume session, on the bullish side, since April/May 2010, that's 15 years. Back then, when this signal showed up, this index went to grow for years non-stop.
The SPX also produced the strongest weekly session in several decades, maybe the strongest week ever, and a bounce happened (support found) exactly at the 0.618 retracement Fib.
This is all we need to know. When the bulls enter the market and do so with force, it is because the market is set to grow. The correction produced decline of 21%. This is pretty standard. The fact that the correction happened really fast, it means that it will also have a fast end.
The low is in. The correction is over. The S&P 500 Index is set to grow.
You can be certain. If you have any doubts, just ask the chart.
Namaste.

SPY in Focus: Tactical Day Trading Amid a Bullish RecoveryAs of early May, SPY consolidates around $560–$570, testing former support-turned-resistance.
On the daily chart, the market is pausing after a rapid rally, with $610 as major resistance and $540–$485 as key support. The 1-hour chart reflects a solid uptrend with recent consolidation between $555–$568, while the 15-minute chart shows intraday weakness with critical support at $560.
Three trading strategies emerge: (1) Bullish breakout, buying above $564–$568 with targets up to $580;
(2) Bearish breakdown, shorting below $560 with downside to $545; and
(3) Range trading, buying/selling within $558–$568 using tight stops. Confirmation via volume and candlestick patterns (e.g., engulfing or hammer) is essential.
Short-term bias is bullish, but with caution—if SPY holds $560, it could retest $570 or break higher. A drop below $556 invalidates the bullish outlook.

SPX Fractal Expansion: New Highs Ahead Despite FearAs of April 14, 2025, the CBOE:SPX is exhibiting a clear fractal expansion, suggesting the beginning of a new bullish leg. The recent correction, which caused widespread panic, appears to have completed a fractal cycle reset, with price respecting historical support near 4704 and forming a new fractal edge around 5300.
Despite the fear-driven selloff, momentum indicators like RSI and MACD show signs of bottoming, and volume surged on rebound days, confirming strong institutional buying. The price is now testing temporary resistance at 5878, with a path open to reclaim all-time highs (6100+).
Global & Technical Tailwinds
Technical momentum is recovering across timeframes, with positive divergence on stochastic oscillators.
Breadth is improving: More stocks are participating in the rally, reflecting internal strength.
Sentiment has flipped: The VIX has cooled from panic levels (above 45), and investor fear is easing.
Macro support: Inflation is declining, and central banks are signaling potential rate cuts by late 2025.
Earnings outlook remains solid, and analysts forecast SPX to end 2025 around 6500–7100.
🔍Conclusion
The SPX is carving out a fractal mirror of past bullish reversals, reinforced by strong macro and technical context. Barring unexpected shocks, the index is likely to break above resistance and push toward new highs, even as residual fear lingers. The setup favors buying dips within this emerging structure.

SPY LONG SET UP(BUY THE DIP)Entry 1 $500.00
Entry 2 $460.00
Stop loss $440.00
Take profit 1- $550.00
(Close 25%)
Take profit 2- $600.00
(Close 50%)
Take profit 3-$650.00
(Close 75%)
Take profit 4-$700.00
(Close 100%)

SPY Technical Outlook - Will Buyers Step In?AMEX:SPY is experiencing a corrective move after rejecting the upper boundary of the ascending channel. This rejection led to increased selling pressure, bringing price back to the lower boundary of the channel, where buyers may step in to defend the trendline support.
If the price holds at this dynamic support level, a bullish reaction could send AMEX:SPY toward the midline of the channel, with the next target around 607.00. Holding above this level would reinforce the bullish trend structure and increase the probability of continuation toward the upper boundary of the channel.
However, a breakdown below the trendline support would weaken the bullish outlook and open the door for further downside. Monitoring price action, volume, and confirmation signals will be crucial in determining the next move.

SPY: Deep Pullback or the Opportunity of the Year?The market has spoken, and SPY has taken a deeper dive, breaking key levels and raising the big question: Will it keep dropping, or are we looking at the best opportunity of 2025?
Seasoned traders know that sharp declines aren’t just moments of panic—they are moments of opportunity. With SPY reaching 558, 545, and even 525, this could be the perfect setup for a strategic, tiered entry ahead of a potential rebound.
Key Recovery Levels:
🔹 570: First profit target, capturing an initial bounce.
🔹 590: A second take-profit zone if the momentum continues upward.
🔹 607: If recovery gains traction, this could be the level where many look to lock in gains.
The market may continue to dip, but every drop presents a potential golden opportunity. What looks risky today could turn into the trade of the year tomorrow. As always, risk management and disciplined execution are key.
⚠️ Disclaimer: This information is for educational purposes only and does not constitute financial advice. Trading involves significant risks, and each investor should conduct their own analysis and manage risk responsibly.

S&P500 is OVERSOLD!CME_MINI:ES1! NASDAQ:NVDA NASDAQ:AAPL NASDAQ:AMZN NASDAQ:META NASDAQ:MSFT NASDAQ:GOOGL NASDAQ:COIN
BUY OPPORTUNITY on CME_MINI:ES1!
The chart shows a strong bullish setup. A well-defined wave structure is visible along with a key Fibonacci retracement level marking the pullback. A divergence in momentum has been noted, and the price action has bounced off the 52-week EMA, suggesting that buyers are stepping in.
Fundamentally, the outlook remains positive. Recent macroeconomic data points to solid consumer spending and steady industrial production, while bank earnings and statements from major financial institutions have added to market confidence. These positive signals help support the S&P 500’s broader resilience, reinforcing the potential for further gains.
That said, caution is advised. Uncertainties such as shifting monetary policy, potential geopolitical tensions, and any unforeseen changes in economic data could introduce volatility. Traders should consider tight risk management and stop-loss strategies to mitigate downside risks.
Not Financial Advice

NEW BULL MOVE IS NEAR Wave 4 cycle low SETUPI am coming into the major and minor spiral cycle Low is has been due into 3/8 3/13 focus on the 10th for sometime . But the Crash cycle is in day 10 today and over the last 112 years data back to 1902 the crash cycle has been from 8 to 12 days long we are in day 10 Now .I have taken up a 75 % long deep in the money Calls into this morning drop I this give the market a chance of 30 % to drop to the lower target of 5644 But Put Call models are bell ringing now .I will move to 100 % long calls at 5723/5713 and move to 110 % long at 5644 MIT . after the low print and we break above 5909 on a close I have a confirmed LOW and we short see a major 5th wave blow off it should take 26 TD and the target min is 6183 and max to 6430 with 6235 being focus in the math In the QQQ 552 is a focus with 545 as the min max based on the Math 564 Tight range for the QQQ as it should be The DJI will see a minor new new above 45040 best of trades WAVETIMER
$MES1! Charting to Purchase $SPY 1-DTE Call Option, 15-min TFContract: AMEX:SPY 27 FEB 25 598c
Entry: $2.03 on 1:09pm
Exit: $1.26 on 1:58pm (-$77, -38%)
So after seeing price decrease 0.75%, 45 pints, 179 pips in 2 hours from $6,023.75 to $5,980 (support area), I decided to purchase a call expiring today on Feb 27, 2025.
On the 15min and 5min I noticed price bounced around the $5,980 area and thought price would reverse to the upside.
1) Yesterday on Feb 26 @ 1:09pm, I entered AMEX:SPY 27 FEB 25 598c @$2.03 because of the drop and potential reversal.
On the 5min:
- candle had made a higher low
- became an inside (1) candle #thestrat
- began consolidating & hit support around 5,980.
2) When placing my stop loss, I mistakenly set up my option call to sell when AMEX:SPY (the stock) touched or went above $3.05 instead of programming the option call to sell when the specific option call ( AMEX:SPY 27 FEB 25 598c) touched or went above $3.05.
You live and you learn.
On to the next play.

SPY WEEKLY 24 FEB 2025Welcome to SPY Weekly. I have clearly explained the price action & momentum in this analysis.
If you have any doubts feel free to ask.
NOTE:DO NOT BLINDLY FOLLOW ANYONE

Following up SPYEntry Strategy
Entry Levels:
599: Initiate your first position here.
593: Consider adding to your position if the price pulls back.
585: Evaluate a further entry during a deeper retracement.
Profit Targets:
607: Aim for an initial profit target at this level.
611: A secondary target to capture additional gains.
615: The final target where you may exit for optimal returns.
Remember to use proper risk management, including stop-loss orders, and ensure your risk/reward ratio meets your trading criteria.
Disclaimer: This information is for educational purposes only and does not constitute financial advice. Trade responsibly.

Market about to RIP FACES OFF!AMEX:SPY SP:SPX : Contrarian Take!
Market about to RIP FACES OFF! 🚀
$631 Inbound! 🎯
Same outcome different reason since Sept.
Not financial advice

Bullish Cypher - SPY spotted a bullish Cypher pattern on SPY’s daily chart, and it looks promising.
Entry: Current Market Price
Stop Loss: 575.50, just under the D-point, to give the trade some breathing room.
Targets: All time high
Ideas and Inputs are welcome.
Thank you for dropping by.
Disclaimer:
This analysis is for educational purposes only and is not financial advice. Trading involves significant risk, and you should only trade with money you can afford to lose. Past performance is not indicative of future results. Always do your own research and consult with a financial advisor before making any trading decisions.

Markets are going PARABOLIC!AMEX:SPY SP:SPX : Jail Break!
🎯$630 incoming!
- Consolidation then breakout
- H5 about to flip green
- WCB thriving
- Volume shelf launch
Not financial advice

SPY Gap Filled - Local Bottom - More SendTrading Fam,
I am not overlooking the small H&S pattern seen on this chart. I am simply presenting alternative data. What if that H&S pattern fails? It can happen. Even if we do drop further, our target down is that pink horizontal trendline. Will we get there before more buying ensues? Possibly. But this market is still bullish. The larger bull trend is still very much in tact.
Additionally, we can see that an important gap has been filled. Therefore, it is very possible that the small H&S pattern we see here will not reach its target down. If that is the case, we'll turn up again, continue through my Target #2 which was already hit, and proceed onward and upward to my final Target #3 (670-700) until that is reached sometime in 2025. Therefore, you are not wrong to start DCA'ing in at this point.
✌️ Stew

Pre-Market Update: SPY - 01092025 - $586-$586.50 Support RetestWatching the SPY going into Premarket, it lost support at the $588.62 Levels, so we're looking for that $586-586.50 to gauge if the Markets will lose steam and pullback even more (providing better buying opportunities on our other Trade Analysis). The question is always, "How far are really pulling back though?"
Today's Economic Calendar:
Event Type Date Time Description
Econoday event Jan 09, 2025 01:00 AM Industrial Production
Econoday event Jan 09, 2025 01:00 AM Merchandise Trade
Econoday event Jan 09, 2025 01:00 AM Industrial Production
Econoday event Jan 09, 2025 01:00 AM Merchandise Trade
Econoday event Jan 09, 2025 04:00 AM Retail Sales
Econoday event Jan 09, 2025 04:00 AM Retail Sales
Econoday event Jan 09, 2025 06:30 AM Challenger Job-Cut Report
Econoday event Jan 09, 2025 06:30 AM ECB Minutes
Econoday event Jan 09, 2025 06:30 AM Challenger Job-Cut Report
Econoday event Jan 09, 2025 06:30 AM ECB Minutes
Econoday event Jan 09, 2025 07:30 AM Jobless Claims
Econoday event Jan 09, 2025 07:30 AM Jobless Claims
Econoday event Jan 09, 2025 09:00 AM Wholesale Inventories (Preliminary)
Econoday event Jan 09, 2025 09:00 AM Wholesale Inventories (Preliminary)
Econoday event Jan 09, 2025 10:00 AM 3-Month Bill Announcement
Econoday event Jan 09, 2025 10:00 AM 6-Month Bill Announcement
Econoday event Jan 09, 2025 10:00 AM 3-Month Bill Announcement
Econoday event Jan 09, 2025 10:00 AM 6-Month Bill Announcement
Econoday event Jan 09, 2025 10:30 AM 4-Week Bill Auction
Econoday event Jan 09, 2025 10:30 AM 4-Week Bill Auction
Econoday event Jan 09, 2025 03:30 PM Fed Balance Sheet
Econoday event Jan 09, 2025 03:30 PM Fed Balance Sheet
Econoday event Jan 09, 2025 05:30 PM Household Spending
Econoday event Jan 09, 2025 05:30 PM Household Spending
Econoday event Jan 09, 2025 11:00 PM Equity Settlements
Stay tuned by connecting with us below to discover more at @MyMI Wallet!
