Short Term Bottom Is INThe short term bottom is in for the markets. Bullish divergence patterns for RSI and MACD. Barring any insane Ukraine news and oil continues to flow expect it to be bullish.
Spylong

SPY bounce at 400Ok so the SPY has gotten through the choppy area of the 420s. Now, there are no major supports before it gets to 400. On the chart I drew out 3 possible scenarios, or ways I'm looking for the market to start a bounce at 400. The first one is if we trade down to 400 during the day, especially early in the day, I'd look for the bounce later in that day. The second possibility is if the SPY sells down into close but we are not at 400 yet, and then the SPY opens below 400; BUY THAT OPEN!!!! The last possible I'm look for is if the SPY just sells down into close for the day, getting below 400; it will probably go through that level with relative ease. Don't know what day this will play out but looks like it will be soon, like within a week; but I would not look to play the bullish bounce with options less than a week to expiration. And the reason why, is the last thing I will caution you with, watch out for scenario 1 turning into scenario 3. Where we get below the 400 point level early one day, start bouncing, and then the end of day start selling off and make a new daily low going into the close. That's why you want to give yourself a little bit of time on the options. I'm going on vacation, so if it happens while I'm gone I wanted to give you what I was, am, looking for. I do have take profit stops at those level but if it does it while I'm gone I might not get into bullish positions. Good luck and make that money.

$SPY 1Hour Potential Bounce Play 2/24/21Spy currently hit it's previous low from January around $420.59 and has surpassed that in extended hours on 2/23.
What are your thoughts?
Thanks,
Kelly

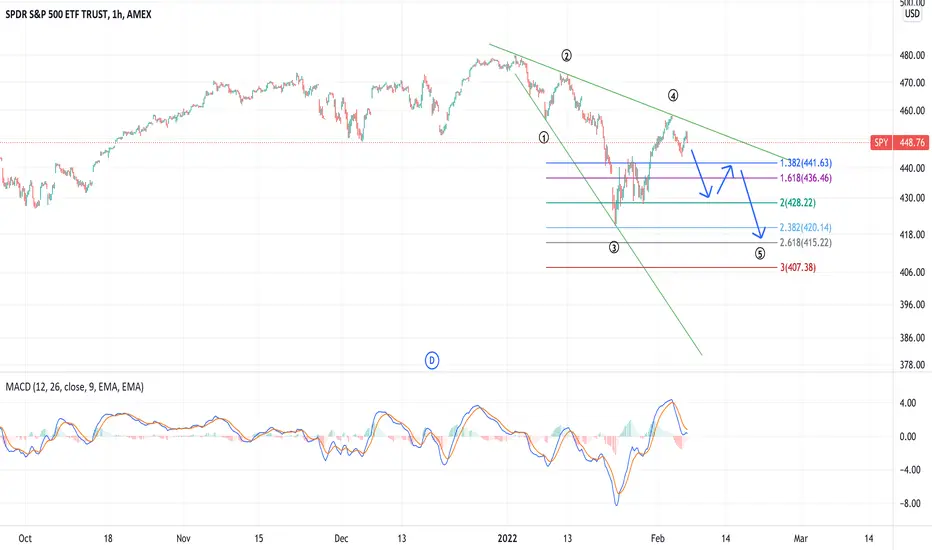
SPY: Bottom at 400-405Hello traders, here is my analysis for the SPY. Looks like a WXY correction to me. There is a gap that needs to be filled at SPY 400, and I believe that we will do this. Also, at that point W=Y, so it will be a beautiful symmetrical correction. Good luck traders.

$SPYThe investment seeks to provide investment results that, before expenses, correspond generally to the price and yield performance of the S&P 500 Index. The Trust seeks to achieve its investment objective by holding a portfolio of the common stocks that are included in the index (the "Portfolio"), with the weight of each stock in the Portfolio substantially corresponding to the weight of such stock in the index.
SPY Long after a small consolidation (ideally a consolidation at this KL, but the market is too volatile so we might get a push right on Tuesday) we will uptrend:
1) engulfing candle on 4h chart
2) doji candle on 4h chart
3) major KL 430s area (res to supp)
note: market is tanking and is in need on a little push before major pull (FED Meetings and the rest... ugh something to be done I guess)
TP: estimate to MA50 + KL 442 areas
*not an ideal entry presented yet, needs a closer to 430s area for a given SL under 430. However if it will show signs of uptrend the the entry might be presented at 436 with close in SL.
Must look for headlines about the date of Russian invasion on Ukraine and Biden's speech making poor SPY into bleeding
(for some reason it feels all this headlines so empty and artificial... hmmm wont say it, okay I will: they manipulate the market on purpose!
- oh, what? - not a secret? - sigh lol
Also note: I do this because I am forced by tradingview lol

SPY 4hr chart analysisPotential formation of bullish Gartley on 4hr chart.
$430-425 green box is a potential support area where I expect buyers to come in.
It will also initiate the completion of wave 2 and beginning of wave 3.

SPY bearish options todayI was monitoring the SPDR S&P 500 ETF Trust (ETF) options market and the puts are dominating the options today.
2/3 puts, 1/3 calls and some important dark pool prints sells.
My expectation is for a retracement at the $422 area, followed by a W shaped recovery.
Looking forward to read your opinion about it.

S and pShiller P/E ratio is over extended and has broke a major resistance currently forming a head and shoulders pattern on the weekly time frame l believe we will retest around 454 short term forming a symmetrical triangle and then start to short around April

Spy price prediction The market is experiencing a deep correction due to the uncertainty of the corona, the war between Russia and Ukraine and the increase in the interest rate of the Federal Reserve do not so much help the market to rise again to say the least
In my opinion the all-time high will be in the end, it will not be as fast as it did in the crisis at the beginning of the Corona, I think the market will go aside for a long time because of uncertainty and inflation but will slowly rise as it does in any health or political crisis to this day

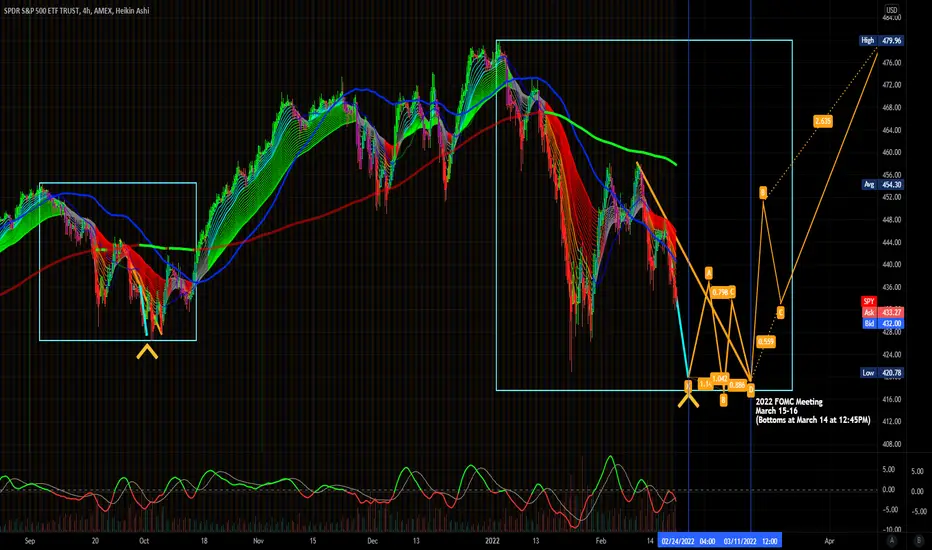
This year will end NEGATIVE in S&P but NOT BEFORE we see ATHs!However, I see a 15% rise to ATH in the S&P 500 FROM HERE! SEPT '22 P Target.
Let's see how this plays out. First half of 2022 will see a 15% rise from here regaining previous ATHs into SEPT 2022. From this point I see a capitulation candle (-23%) ENDING THE YEAR NEGATIVE.
This is my 2022 forecast for the SPX.
2024 will mark a brand new Bull market.

SPY Stock Analysis - Day Short Term Bullish Pull Back Feb 15thTraderMan PennyPorkChop looks out for opportunity to survey and examine the latest value activity in the market in a way that makes it helpful to you.
Utilizing Technical Analysis, I play out an insiders view of the activity in the financial exchanges today and gives you my Day Trading of 6 years of Trading Volatile current market , examining market patterns , and interpreting of where the market is going.
TraderMan PennyPorkChop Focus incorporates - Specialized Analysis - Exchange and market Education - Pattern and Pattern Analysis - Market Psychology - and Trading Mental Health.
Day Trading , The Unified Theory that works when nothing else will , Unperilled Strategy. Beginning the Journey.
👉 If you enjoy this video, Please like and share it.
👉 Don't forget to subscribe to this channel and press the bell 🔔 for more updates.
SPY Stock Analysis - S&P 500 SPDR ETF Stock Price Prediction for Tomorrow.
February
We go over the SPY stock - S&P 500 SPDR ETF stock, and give our stock price prediction on the SPY stock, our SPY stock price analysis, and stock price forecast on SPY for tomorrow TUESday February .
SPY STOCK: THIS IS A Bitcoin STOCK PRICE PREDICTION, SPY STOCK PRICE ANALYSIS, AND A SPY STOCK PRICE FORECAST VIDEO.
. My Ideal Views are looking for new ways to think about Trading.
. No BS Technical Analysis that works, period.
. Day Trading and Swing Trading.
. New Traders Welcome.
. Swing Traders Welcome.
. You get Daily SPY STOCK pre and Post Market and the Price Spy ETF price predictions Weekend editions.
. TESLA stock along with TESLA share Price including Tesla After Hours.
. Bitcoin
DISCLAIMER: No financial advice, the information on this channel is provided for education and informational purposes only, without any express or implied warranty of any kind, including warranties of accuracy, completeness, or fitness for any particular purpose. The information contained in or provided from or through this channel is not intended to be and does not constitute financial advice, investment advice, trading advice or any other advice. The information on this channel and provided from or through this channel is general in nature and is not specific to you the User or anyone else. You should not make any decision, financial, investment, trading or otherwise, based on any of the information presented on this channel without undertaking independent due diligence and consultation with a professional broker or financial advisory.

BEARISH ALT COUNT DIA I HAVE JUST SOLD out of All long calls and now moved to a 100 %net short based on this wave structure . moved into sept 365 dia puts at 26.25 .If this count is what it is then we should not see the dow break the low of jan 27 and this would take the sp and qqq to new lows sp 4138/3980 qqq 321/316

2022 | The Year Of Wild Swings but a BIG Payoff? QQQ/SPYHey Everyone, in this video we discuss the large swings we expect for 2022 and what might be setting up for the next few quarters on the stock market.

BEAUTIFUL Cup and HAndle on SPYWell, looking at ES on a 30 minute time frame, right off the bat I see a nice Cup n Handle forming. Where right now we are forming the handle and are looking for a strong breakout to the upside. If this can hold valid, im expecting ATLEAST 4763 on ES. I think that is about 484 on SPY. We will atleast see a nice gap fill to 465 (labeled in the yellow box) That is probably the best bullish sentiment I see right now for SPY/ES this week!

S&P500 , spy&P500 US Market Index..
Struggling to survive!
It is worth noting that the movement of Bitcoin recently "according to my opinion"
She has become very sensitive to the movement of this indicator, especially in the recent times.
All eyes are on the market opening tomorrow .

The bottom is NOT in on SPYSPY appears to be in an ending diagonal, like many other stocks, including AMD. I expect this to resolve with a double-bottom or a slightly lower low by February 18. After that, SPY will be set to set new ATHs.
$SPYFund Summary
The Trust seeks to achieve its investment objective by holding a portfolio of the common stocks that are included in the index (the âPortfolioâ), with the weight of each stock in the Portfolio substantially corresponding to the weight of such stock in the index.

SPX Continues Rally This Week (atleast)Please don't listen to me. I have no actual formal financial training. I only got into this as a hobby. My training is in medicine and I'm much better at reading EKGs than predicting the future market.
I do however enjoy reading candlesticks and believe the emotional component behind them can say a lot.
Using this to keep a log of my thoughts. My belief is SP500 closes higher this next week solely off this weeks candle and believing that greed drives the market more often than fear.
My target is 4500 and I will be waiting for an entry on Monday below 4400 but above 4310. After that I'm uncertain if it will go down lower or continue the rally. I believe in strong candlesticks and will continue to believe in long if the price action shows a strong upward trend this week.

$SPY gets back to $450, now what? We have been looking for $SPY to get back to $450, provided it could clear the 200-day moving average.
It has been pretty much rangebound between 430 and 440 -- roughly speaking -- and once it cleared the latter, $450 was the upside target. It's not just the 50% retracement, but back into the December lows.
From here, we'll have to navigate. another push higher could put the 61.8% retracement, 21-day and volume-based VWAP in play. If we fail here, last week's high near $444 and the 10-day moving average are in play.

Short term bounce, that's itWe have been getting a consistent Faithful down trend since 2018 well actually since 2015 it just got faked out and came right back in line. With that in mind it'd be wise to assume we'll just continue till the stock possibly reach single digits.
1. With the pandemic, travel has been affected as such airlines can't get the customers to sell their products to in which they get the most of their revenues from.
2. With monetary tightening or interest rate hikes. This will further be tapered as we receive a hawkish fed's response to the economy.
Buy the rip in this one and sell afterwards.

SPY correction is overThe FUD induced sell off has come to a finish. The SPY showed that the 300 MA is a respected level of support by bouncing off of it Monday. This was followed by 3 inside bars. Multiple inside bars indicate consolidation, a close above that range in a downtrend indicates a trend reversal. A break below that range in downtrend would indicate continuation. The SPY had a strong day rally to close out the day that emphatically showed the downtrend is over. I expect a gap up over the 200 MA Monday morning and a push back to $450. QQQ has a similar setup although less bullish.

$SPY CORRECTION DIPwe tested our first support around 404$, if we hold it we should see bit of mini correction for the market , however if we went down again and closed below, we will see another test for the strongest support around the 360$
