SPY looking bullish-swing playSPY is looking bullish. First PT $447 and second PT $There is a lot of strength on DTF
Spylong

Inverse head and shoulders pattern developingYesterday’s rally in the $SPY confirms our hypothesis that the overall market looks like an inverse head and shoulders with the neckline at 440. The measured move if confirmed would take us above the all time high. We are cautiously bullish for the end of the year as seasonality is in our favor. Major headwinds such as inflation, treasury yields, chip and labour shortages will continue to play a role, but seem to have been priced in for now.

$QFIN biggest Buy of your life $25 Call for .05 cents make moneyMake tons of money by trading $QFIN a very strong fundamental finance tech company. It will make you over 20% in the next 2 months. Good trade before Expiration date!

Spy upside and downsideSPY, if breaks pink evolving structure to the upside could test 448. But, if it break blue correction and continues down could test 427.

Spy Upside and DownsideSPY, if breaks pink evolving structure to the upside could test 448. But, if it break blue correction and continues down could test 427.

SPY - NEED TO CLEAR UP THE GAP THIS WEEK!Most likely we need to fill this gap before we go back up. Market doesn't like excess anything or gaps for the most part. Algo's are a menace but they are like an ADHD Wifey - They don't like small messes ruining their clean houses.

SPX500 case study I think SPY WILL RALLY BACK TO THE HIGHSHI,
This is SPX500 chart. I don't think so we are done here sentiments are at extreme fear and you think price will drop? No way. They manipulated the lows and now they will break the highs.
I'M BULLISH ON STOCK.
ALL THE BEST!

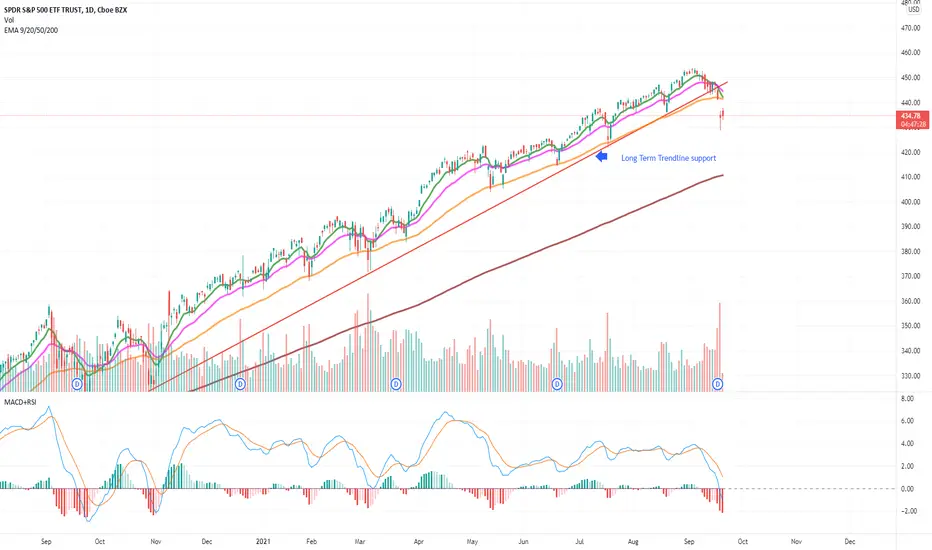
Long $SPY CMP $434.70Long $SPY CMP $434.70. $SPY trading below 50 EMA. I am long on $SPY, expecting it to bounce above 50 EMA after VIX goes below upper BB level. Would be interesting to see the tug of war between bulls and bears in coming days.
SPY Bullish CaseWe all know what they do best - print like there is no tomorrow.
If 430 level hold and is bought, we will get out rally. Every guru and their subs are long to their teeth. There is cash on the sidelines. If that cash sees this as a double bottom buy the dip opportunity - to the moon we go.
If this dip is not bought, look out below.
2hr shows a death cross (when 50MA crosses 200MA), 3hr is approaching a cross. 4 hr looks like a double bottom. Daily we are sitting pretty on 50MA. Short term time frames dont matter as much as long term timeframes. I am still eyeing 410-420 level but will change my mind if I see aggressive buying action today.
At the end of the day, you are the one clicking buttons and making decisions for yourself. Today will not matter so stop trading and pick long term strategies, use intraday activity to help your conviction.

Double bottom bounce?The overall bloodbath in the markets yesterday left the main indices in oversold territory. If history repeats itself, the double bottom formed in the $SPY should account for the beginning of the next leg higher. If the current headwinds persist, the bears will need to push the market below $428. $435-436 will be an important level for the bulls to reclaim today to avoid this early pre-market strength to become a dead cat bounce

SPX S&P500 SPY Weekly Prediction/Historical Correction AnalysisIn this weekly analysis, I noticed a similarity in the market correction of the 2nd and 3rd week of May 2021 to the current environment.
As we can see from the chart, in May, the market first dropped below the support level of an ascending channel which then transformed itself into a resistance level. In the following weeks the index traded in the ascending parallel channel just below the previous support line.
I expect a similar behavior this week. In this regard, the market should first pull back to the 4365-4375 area and then recover up to the dashed resistance level. After that, I expect the index to trade in the dashed ascending channel in the upcoming weeks.
Trading idea: Bearish vertical call spread.
Short strike 4510 / Long strike 4515, Expiration Oct 1st 2021 for a credit of about $0.55 vs a collateral of $4.45 which corresponds to a 0.10 delta trade (about 90% probability of success) and an expected ROI of 12.36%.

SPY only one way honestlyLot of the speculation has been resolved. We go up until we get more news.
Always go up, goes a lil down, always go up.

$SPY above all moving averagesThe overall market displayed an impressive rally from Monday’s lows to fill the gap and reclaim all momentum lines. For next week we are cautiously bullish as we have the end of the quarter rebalance and the new monthly inflows. Most dips should be a good buying opportunity as we head into the earnings season.

$SPY - Mind the GapStrong rally in the indices as the FED came in rather dovish last night. Strong pre-market action above Monday’s gap. Holding above 441 throughout the day might be an indication that the recent downtrend came to an end for the moment.

SPYI think 1 more push to $469 to test the fib extension lvl 1.618 and complete 5 wave cycle on the daily

Harmonic bounce on the SPY. The trend will defend.Beautiful harmonic bouncing on the SPY . This will be a classic breakout, pull back, continuation pattern. The 30,50,100 SMA's are wide and healthy regardless of the noise and hyper evaluations. The trend will defend but a correction is due... we all know it.

Short-term LONG confirmation on SPYAMEX:SPY had an interesting retracement yesterday. If we apply fibonacci, we can see how AMEX:SPY will soon enter the fibo pocket highlighted on the chart.

SPX touched the 200 EMA on 4h and got rejected. Time to go up!SP:SPX had a solid retracement today and while the situation may seem bearish on smaller time frames, if we switch to the 4h time frame we can clearly see that technical analysis suggests we are still in a bullish trend. A rejection happened at the support level of 200 EMA. Last time SP:SPX broke the 200 EMA support level was in February 2020, just before the first covid lockdowns happened.
As long as SP:SPX holds the support level, we're going up from here!

BULLISH! LISTEN TO REASON!with tomorrow being another day that the market makers lose their edge, in general market control bias strength: when GEX index numbers fall lower (number of open options contracts) as they expire. Leading to this major contract expiry, a bullish push always resets and price actions become more predictable and neutral. not being forced or controlled to the massive extent to which high GEX index numbers give the higher ups. That being said,
1. Today was an easy cheat code for what will be happening going into tomorrow and beyond.
a. should easily retest whole number support of $450.
Given these things, I however can't valuate SPY being at these levels and do believe it's being propped up but, the day is coming whether in a crash or change of trend (greater than 10%) will over take all SPY bulls. But patience that is not happening today.
Note well: How vigorously and aggressively we bounced from multi-hour support, the $444.... This was a bullish sign and volatility should be topping off after tomorrow... More importantly, it could easily be next week before volatility eases. furthering another possible push.
Note also that today volume on the reversal should not be used as a deterministic factor in deciding direction at this point on the chart and with all the other things going on. What should be the take away is as mentioned about that retracement of all that bearish move and then create ideas and analysis on the fact that we retested resistance and didn't come back all the way but only retraced to about the 70% mark of upwards correction..
All the best to you...
peace.

Bullish SPY, but needs to beat Thursdays Top.Lots of economical items Friday as SPY start to turn bullish.
SPY must go over Thursdays high. If not, expect a low on Monday. Thankfully, Monday drop might bounce on the strong supports made, and a trendline that is loosely formed.
Unless the economical news breaks all supports, it's seems like a very safe long for next week.

SPY bounce before the OPEX on Friday?The overall market has been in a downtrend for the past 2 weeks of trading as it is reaching its 50EMA. This has been a great buying opportunity in the past. It might be a good idea to be long the $SPY for a possible bounce today and tomorrow before the big OPEX expiration. On Friday, given the big volume of options that will be traded we might have an increase in volatility and some extra selling pressure. A dip below the 50EMA around 441.8 negates this thesis

Putting Risk back on in $SPY via callsSee chart , we are now back above Fridays lows, few key names trying red to green reversals into the close, this bodes well for BULLs looking ahead

