SPX Fear at Resistance- SPX nearing 50 MA which has shown as a strong resistance line
- Put/Call Ratio above green line while SPX at resistance
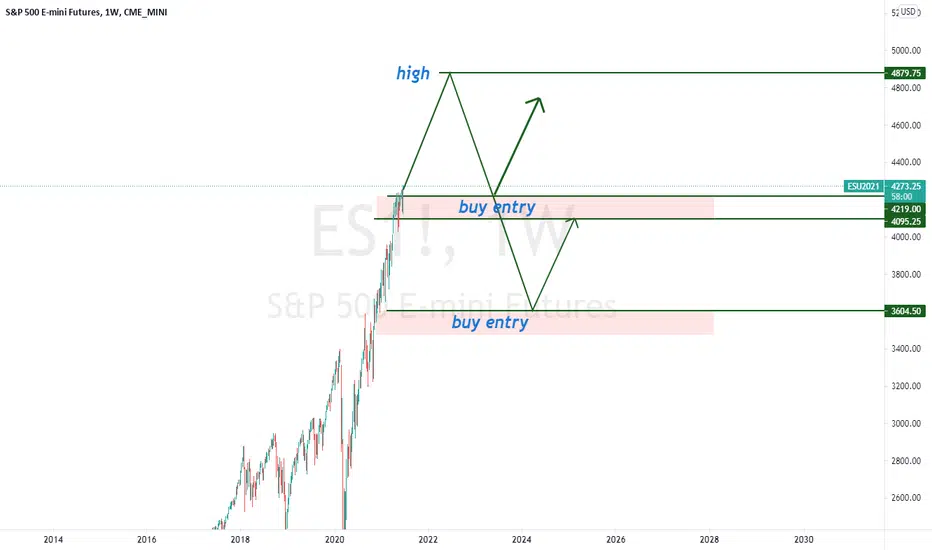
Spylong

SPY Monthly Bull/Bear CycleSince Feb 2021, SPY needs on average 26 days to complete its bull/bear cycle. As SPY price goes higher, the gains slow down slightly, which is accounted for with the trend angles dropping 4 degrees per month from its Higher Low to Higher High. If you did not take a call position yet, you may want to pick up some Spy Calls tomorrow.

Price Up, Value Down!Momentum on the RSI looks like it wants to break upward.
We could be approaching the inevitable blowoff top going into next year.
Keep in mind that the actual value of our portfolios isn't increasing.
The number of dollars might be, but the only reason this is happening is the devaluation of the thing we're measuring our portfolios in...
$5 Ford -->$12 Ford is actually just --> $7 Ford, but now your money is worth less and meat, gas, cars, raw materials, and the like all cost more...
(Not financial advice)

Ethereum - Bullish - 3k soon $ETHThe chart is self explanatory - once the first bottom solid gold line is held/broken (which it is doing as we speak) look for a test up to the second solid yellow bar above it. Could see this happening within the next 1-2 weeks due to the volatility and the power of crypto.
Down the line long term, I easily see Ethereum at 50k or higher as a initial price target (10-15 years from now give or take)
Hope you guys enjoyed!

Market Crash Only Days Away If VIX Repeats Consistent HistoryThe S&P500 Volatility Index is currently breaking out into levels that historically has been catastrophic for the overall market.
On the monthly chart, we can see that whenever the VIX breaks out and confirms above the light orange trendline plotted on the chart, double digit drops in valuations happen for the S&P500 usually within mere weeks.
Which means any day or moment now we can see a major crash for the broader market.. much greater even than what we have seen so far as the VIX appears to have much bullish momentum by painting 3 consecutive higher lows and multiple higher highs on significant time scales.
This will definitely now be one to watch as this would negate our former long idea on SPY due to the sudden turn of events on the S&P500's volatility.
If the VIX can have its price driven back below the orange line and CLOSE this monthly below it, that would give market bulls hope. Similarly, many assets are at major fork in the roads on their charts right now, and the VIX as we can see is no exception.

Emini / ES1! / SPY500 : Trade ideaES1! / Emini / S&P500 is bullish on all timeframes - M/W/D
Weekly even rejected off a Monthly FVG+
Price has also created a Daily OB+
We are looking for any reason to buy on 4H or lower
GLTG

$C Bullish Looking for $C to absolutely run within the next week or two... The chart is self-explanatory with supply zones being pushed back into... We shall see..

SPY Bounced! - Key areas to look for SPY had a big gap down today all the way down to 427.46 (-1.65%) but managed to bounce back at close. Here are the key areas to be watch out for.
- A have some good support at the 21day EMA (426.75ish) and could play it off the bounce there for a short term play to the upside.
-A close below the 21day EMA would be a bearish sign and we could see it testing 50day EMA again as you see in the chart. If we close below 21day EMA, I would play it to the downside with a short term target on the 50DAY EMA.
-Going all the way down to the 50DAY EMA would be considered as a small correction. That's about another 2.44% downside from where we're at now. If we somewhow get a mini correction all the way down to 50DAY EMA, this is where I would load up on calls as this has been a major major support in the past couple months.
AMEX:SPY

ES1! / Emini / SPY500 : Bullish trade ideaEmini on 1H came and had a strong reaction off a Daily OB+.
Waiting for a mitigation for a long trade
M/W/D are all bullish at this point.

SPY Weekly Prediction and Historical Corrections AnalysisIn the last 3 months there have been 3 major up trends and corrections.
We currently are in the 4th uptrend and a correction might develop in the next 1-2 weeks.
The historical corrections show that the market corrects about 40-60% of the previous uptrend in a quite short period of time. In particular it takes a time between 10% and 50% of the uptrend time to correct. We have been in an uptrend for the last 13 days. A correction might come soon.
The options implied volatility suggests a possible range between $423 and $435 till the end of the next week (9-July-2021). A correction of the previous uptrend should bring back the price to the $423 support.
The whole setup seems a perfect point for a correction. However, as we can see from the technical indicator William%R, a positive accumulation is possible. In fact, we might see a similar situation like the one developed in the second uptrend area. In this case the price might continue rising in the next 1-2 weeks postponing the correction further in the future (3-4 weeks). We expect a price between $435 and $423 by the end of next week.

Repetitive pattern on SPY - 1 Month analysisNotice the repetitive pattern on SPY (1 day correction followed by 2 days of strong recovery and a period of consolidation with low volatility. We are in a really low volatility environment. Options prices are low but there are still nice opportunities to collect premium around 16-delta strikes.
Implied Volatility: 11.41%
Historical Volatility: 9.48%
IV Percentile: 3%
IV Rank: 4.34%
IV High: 35.75% on 10/28/20
IV Low: 10.31% on 06/25/21

Bullish for the weekModerate bullish expectation on the SPY till the end of the week.
Expected 1sd deviation range (based on options): $421 - $430 range.

ES1! scenarioMore push ups are expected from the stock market in the U.S. but we need to be carful from buying at these high prices,
the up waves are coming mostly from holders who doesn't want to sell now, so the less supply the higher the prices will go.
but we have an idea where the price could get for a major correction in the market.
We are not going to chase the price, we will catch the dips.
NDX LONG - 14,440NDX. on a breakout - Using the. 8 dte options for the first time - Expensive but the move!

Bullish summer theory SPYHere is my crazy bullish theory for the market... (chart in daily)
Indicators : MACD curling back to bullish and RSI back over the neutral level of 50.
Waves : The last double bottom could be the a-b-c correction for the previous run, meaning that we can enter in a new bullish run. Last week drop stopped in the support zone for wave 2, a bounce over all time high would mean that wave 3 is officially started. Targets are on the charts. The summer run would also respect the fib fan.
My theory : I don't think we will get a big correction during the summer with the economy reopening. Historically, july is a bullish month. The correction would start around september. The 10% correction that we are looking for would bring SPY back to 400 for the test we all waited for.
Voici ma bull theorie pour le S&P 500... ligne du temps en jours
Indicateurs : MACD est en train de courber vers le haut et le RSI est de retour au-dessus la zone de neutralité.
Waves : Le dernier double bottom serait le a-b-c que nous avons besoin pour pouvoir commencer le prochain cycle. La chute de la dernière semaine s'est terminé dans la zone de support de la wave 2, un bris du haut historique voudrait dire que nous sommes dans la wave 3. Les cibles sont sur la graphique.
Ma théorie : Je ne crois pas que nous aurons une correction lors de l'ouverture officiel de l'économie avec le retour à la normal. De plus, le mois de juillet est un bon mois pour le marché historiquement. Drôlement, la correction que nous attendons de 10% nous mènerait à un test du niveau historique de 400 pour SPY, niveau que nous attendons tous depuis longtemps.

$SPY S&P 500 Chart VISUAL support & resistance6/22/21 2:51 Am Chart Visuals , will be using these levels to guide my entries.


SPY Breakout ImminentFocusing on the smaller 30m time frame here, however as we can see we have a triple bottom forming accompanied by the bullish spikes in volume. Simple price analysis and understanding that volume is needed to show conviction, I firmly believe we close today above $424 and will continue to see a bullish run in SPY to new ATH's...

SPY, be careful what u wish for. If it does not break the upper Fibonacci level, I expect a decline. Expected support levels are on the chart.
You have to be careful before the FOMC

S&P 500 on its way to new ATHFor continued positive momentum, should hold 4208 overnight or at most 4190. Close below 4180 could mean deeper pullback till trend line support. Overhead trend line is possible resistance on its way to 4300 (target/resistance) there.

SPY (S&P 500) BULLISH until July/August ELLIOTT WAVE THEORYThe S&P500 ( SPY ) has seen lots of sideways price action and consolidation for the past few weeks or so, but I believe that we could be seeing an impulsive break-out in the near future. This would form the impulsive wave 3 of a final wave 5 push to the upside before the bear markets kick in around the summertime months (July-August).
We will need to see confirmation of a bullish break-out to know that we have entered an impulse wave to the upside. If SPY can break-out over 421-422 (heavy resistance levels), targets of 430+ are very achievable as denoted in the charts. A possible explanation for the recent lack of volume and price direction could be due to the fact that meme stocks ( AMC , GME , BB, BBBY , WKHS , etc.) have taken over the market and soaked up buying interest. Once buying power gets re-directed back into S&P500 stocks, we should see some bullish momentum that is needed to kickstart the impulse wave to the upside.

CUP/HANDLE PATTERN SPY just a idea it seems pretty clear to me, let see how it holds up on support missing the EMA and other studies but the lines and pattern show strong momentum for a breakout.

Selling 5 Delta Spreads!Hello guys, hope all is well. Today I got into a SPY $411 / $408 spread expiring 06/04 /21. This put credit spread has a 5 delta which gives it a 95% chance of it being OTM by expiration rendering it worthless. I was able t to get $9 of credit for each spread which would give me a 3.09% ROI for the week.
Hope you have a great day
