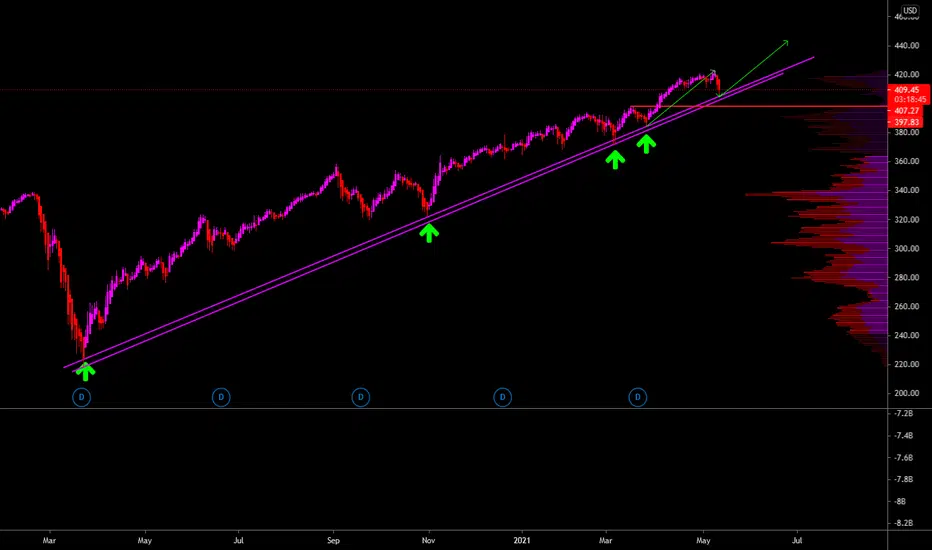
SPY NEW LEVELS COMINGAnd here we go with SPY going to see some new levels coming back around, history doesn't lie. Always look backwards on the chart.
Spylong


S&P 500 bulls under pressure Just like Nasdaq, bulls of S&P 500 are also under pressure. It rejected 4185 first and then unable to close above 4169 level. Now must hold 4129 level. Close below 4113 red flag. Trend line last line for bulls to defend. Then upside target still 4221. This week may decide direction for S&P 500. A cautious bullish bias.

AMD PUTS - TRADE OF THE YEAR IF IT BREAKS 300% GAINERGuys,
If this breaks under this is a MASSIVE gainer on PUTS. Massive. Not only will it full fil the trend bounce at $60 and the possibly descending broadening wedge which overall tends to be bullish with big break upside. It gives you the possibility to not only be short but confidentially swap short to long at $60.
MASSIVE PLAY HERE.
ONLY WORTH TRADING IF IT BREAKS UNDER THE HEAD AND SHOULDERS.

SPY PT 06/2021 UpdateLooks like we transitioned to a slightly longer 5-count triangle in the four wave, potential impulse started, high probability of gap up meltdown after which entering long positions seem rewarding for the remaining part of the month.


S&P 500 - Elliott Wave AnalysisCombining Fib Extension to project the probable targets for 5th Wave top (if not reached already).
Thanks!

SPY Intraday Week 18 UpdatePerhaps my initial idea was right and I was early on my flat-top count. I opened my position too early off the indication of a VIX triple top but should have been paying more attention to how it would behave around the daily 50ema. So far it's getting smashed at 20 every time and that indicates to me that my idea is still in effect. Not bullish after next week though.

S&P futures getting closer to upside resistance level. Upside target is still 4235 as long as 4113 holds. If 4163 fails, next bullish bounce can be seen from 4146 or 4135. Close below 4113 may indicate short term trend change unless we see a quick crash and bounce around 4050. On upside, 4188 is immediate resistance, once overcome can move towards 4235-4240.

Emini (S&P) : Potential bullish trade setupPrice tries to create a bearish breaker, fails, grabs liquidity from equal lows & runs back higher!
Monthly / Weekly / Daily on ES1! (or SPY) are all bullish.
This allows us to buy from area of a seemingly discounted zone.

SP500missed my Inverted head & shoulders pattern by 10 points. :) Anyway I am not sure if I measured a bit off or if the pattern was just incorrect. The LTFs look tired so I expect 1 more pull back B4 finally destroying the remaining 4180 bears.

SPY: Buyers come in again after a low volume dayToday's bar was a bullish bar and went above the high of yesterday's
low volume bar. April 27 and April 28 were low volume days
as well.
When price continues to put in new highs despite
these low volume days it is a good indication price is headed higher.
4250 and 4300 are the next targets for the S&P.
I do not advocate buying into the highs so entering on pullbacks
waiting for a price action entry is best.
We'll see what tomorrow's bar brings.

SPY Intraday Week 17We need one last breath on the RSI to get buying momentum for this last wave up to resistance, in the process of building a 30min triple bottom for a 5-wave start. Especially after earnings, next week should be bullish. Double rejection of the primary trendline, hard resistance at 418. Short down to lower .618 range, completing ABC correction. Lots of confusion here during this week's environment, which generally means we're in a whiplashing ABC correction. What's really happening is we're just consolidating.

ES going to test 4230 first.ES has been showing strong bullish trend so far. No signs of bears taking over yet. Can it happen? Sure. First level it can happen is around 4230 and next 4315. If it looses 4113 support, next levels as marked.

SPXThinking this, IH&S pattern has not completed yet up to 4240 zone. & bulls r eating the dips up, daily still looks weak but 4050 will probably be the bottom for now & then back up to 4240 and probably keep going higher towards 4400. The OTC penny stuccos will thrive b c it will be risk on.
Could be wrong but thats where my bets are placed. GL everyone

SPY: 3,2,1 Blast OffBuyers have yet again taken price above a low volume buy bar.
Price went above the low volume bar of April 13th and those
three following bars were "normal" volume days which is a strong
indication that the buying is strong and we are definitely headed
higher.
There might be a small correction but it is highly probable
we are going to continue to put in new highs on the S&P. According to the daily chart
as it is right now, 4,300 on the S&P is a reasonable price target.

S&P 500 never ever been better than like this now SPX LONG SPYTarget to 4130
stop, if it reaches to 3950
all the momentum is growing :)

SPY gap fillScenarios
1) Could go down a bit to fill up the gap then head to higher highs
2) Could go down to fill the gap and then bounce off the trend line to head to higher highs
A good dip buy for people who missed the opportunity to get on it before it blasted off/
NOT FINANCIAL ADVICE!!!

SPY PT 04/2021 Week 14 UpdateJPOW holding up this great American market like Atlas with the world on his shoulders. Good economic projections, good month historically & statistically, and according to wave theory you have to break previous highs in any major trend. Rising wedges to infinity while the boomers feed off the interest.
Took my previous PTs and ate them in a bowl without any milk.

QQQ PT 04/2021 Week 14 UpdateQQQ wants to z00m so bad. Hedgies like 'nothing to see here boomers go back to sleep rotation is over'.

