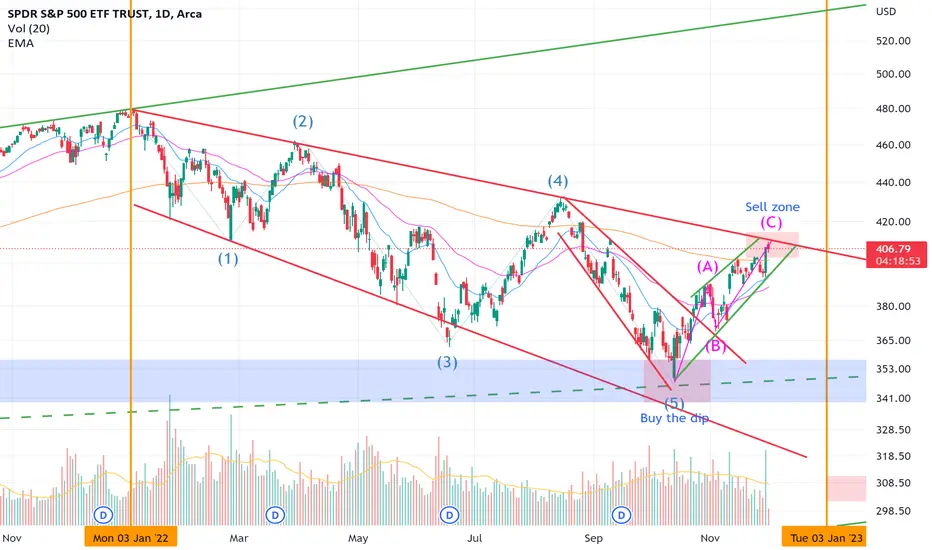
SPY S&P 500 ETF Options Ahead of the CPI ReportIf you haven`t shorted the Bearish Flag Chart Pattern:
The U.S. Bureau of Labor Statistics will release Consumer Price Index ( CPI ) data for the month of November 2022 on December 13, 2022, at 8.30am ET.
The rate of inflation is the most important data that will impact the Fed’s coming rate hike decision.
Now looking at the SPY options chain Ahead of the CPI Report, i would buy the $387 strike price Puts with
2023-1-20 expiration date for about
$8.96 premium.
If the options turn out to be profitable Before the CPI Report, i would sell at least 50%.
Looking forward to read your opinion about it.
Spyshort

SPXThinking the 5th on the expanding diagonal finishes around 3,330 but if not then diagonal likely invalid and 2900-3,000 will hold as massive support.

$SPY on 1hour Pullback NOTE:QUAD WITCHING DAY$SPY on 1hour Pullback NOTE:QUAD WITCHING DAY
Quadruple (Quad) Witching:
The term quadruple witching refers to the simultaneous expiration four times a year of stock options, index futures , and index futures options derivatives contracts.
The fourth type of contract involved in quadruple witching, single-stock futures , hasn't traded in the U.S. since 2020 and was never a major contributor to equity trading volumes
Today is Quadruple witching day. My indicator shows a incoming downturn for SPY .
"Quadruple witching day is a bearish day, quadruple witching week is bullish , and that the last hour of quadruple watching day is bearish ."
What are your thoughts?
Thanks,
Kelly

spy liquidity grab attempt? smart money concept.We are currently at a pivot point where we could easily fall or skyrocket. In this chart I have labeled supply/demand zones as well as trends and support/resistance. Where I have text and a circle resembles a change of character and a liquidity grab attempt outside the bullish wedge pattern. It is likely we may see a move up as a attempt to move closer to 400 but if not we will fall below 390. We skyrocketed past this point with the help of the FED last time, will the FED come through and save spy once again?

The 4th Horseman of the Apocalypse"When the Lamb broke the fourth seal, I heard the voice of the fourth living creature saying, “Come.” I looked, and behold, an ashen horse; and he who sat on it had the name Death; and Hades was following with him. Authority was given to them over a fourth of the earth, to kill with sword and with famine and with pestilence and by the wild beasts of the earth."
Congratulations. If you've been following my ideas then you've done very well for yourself this. Sadly, all good things must come to an end and we must bring this bull run to a close. However, not without some spectacular fireworks at the end to give everyone hope things are turning around. Overleveraged governments and companies will collapse within the next 3 months causing spillover across the globe, glorious. I'm scaling into puts as we've hit the peak of what should be expected (don't be surprised if we get 400) and am going all in on this play on the 24th. God speed to you all and I hope to see you alive in the apocalypse once the dust has settled.
Previous posts:

Strong Spy long/short opportunity brewing up. (Smart Money)We are close to breaking out of this box like pattern. I have located strong supply zones along with other things indicating that we are heading here as we wait for interest rates. If we go to this 420 zone than we shall most likely sell off to lower 410-400ish area after all the rally hype has died down to consolidate here. look out, big moves brewing up!

$SPY on 1hr Expected PULLBACK$SPY on 1hr Expected PULLBACK
Even with the FOMC meeting. According to my analysis in the next hour or two there will be a pull back before the meeting even though the trend shows that SPY is trying to go
up overall on the hourly as seen by my trend line. Possible pullback near support of $402
FOMC Meeting at 2PM est.
What are your thoughts?
Thanks,
Kelly

Told you the dump was coming in this level in my last publish. Hope you made some money today. Lat time I showed how when we get to this level we normal have a massive dump off. Still held true all this time later.

$SPY - Deteriorating Breath and Sell Signal From $VIX$VIX pivoting up from <21 low has been a strong sell signal for $SPY 2022 so far.
we are now pivoting from the said level for the 7th time (2022) since 5th December. each down cycle last an average of 27.2 days before an upcycle takes place.

40 Bar Cycle Chart - S&P 500 SPY SPX ES - Updated 121022 Given that we are headed into the release of the November Consumer Price Index this upcoming (Tuesday, December 13th ) and also the December Federal Reserve Interest Rate Decision (Wednesday, December 14th) , are markets set up for another short opportunity into the end of January (Q1)?
SPY Daily Chart Template
www.tradingview.com
Which camp are you in on the short-term (end of year into Q1/23') direction of markets?
Camp A: We are likely we headed for new lows in Q1/23 (Fluctuating Inflation + Persistent Price/Wage Pressures + Hawkish FED).
Camp B: We are likely to break the downtrend into the start of Q1/23' (Peak Inflation + Deflationary Forces + Dovish FED).
Let me know your prediction in the comments below!

$SPY Bullish Trend Testspy cant go much lower if its to hold the upward trend we've been on. breaking this trend will result in a new formation and will possibly look to long near the next support zone unless we turn it into resistance.

R.I.P. The S&PAs you can see, History repeats itself. To my technical eye, The S&P is loosing momentum at a price of major resistance AND(+) a Major trend line where price has previously ended its bull rally to return to its overall bear market downtrend. Second possibility attached. I see The S&P returning to the 350's if not much much lower. Its divergent sister, the VIX is showing similar confluence because it is also at a price area of major lows where it has previously reversed overall direction longterm. I see The VIX returning to 34.32.

Small gambling put on the SPYJerome Powell gave good momentum in the market yesterday. I do not think this is enough to breakout of the bear trajectory. Market went emotional and soon reality will resurface. Inflation and interests are still high. Macro economics are not favourable. Money is still getting sucked out of the market. As time goes by, people have less money to invest because of higher prices. This is not really a pivot, interest rates are still expected to rise further. Maybe at a slower pace.. so what? Credit will still go more expensive. I went with a small gambling put on the SPY.

SPY SPX Short? S&P 500Quick look at the S&P500 SPY
Technical is working great on this one.
We are clearly in a rising wedge, unclosed gap, and RSI divergence. Many things are working against us.
Chart:
- Rising Wedge, will break into down side on a 1H
- Unclosed gap at $380
- RSI divergence and shows bearish trend.
Will we test $380?

395 for SPY?Looks like it possible we can see another move down today. bearish flags are being displayed.

SPY Analysis (December)This is an analysis of the S&P 500 for December 2022. Right now, the market is producing some unusual charts.
Volatility
Volatility is one such unusual chart.
As most traders know, the VIX is a volatility index derived from S&P 500 options for the 30 days following the measurement date. Volatility measures the frequency and magnitude of price movements over time.
On Black Friday, the VIX closed the week at the lowest RSI in nearly 10 years.
The chart above shows the weekly RSI for the VIX closing at 40.86 on Friday, November 25th -- the lowest weekly closing RSI value since early 2013.
What's even more unusual is that this occurred only one trading day after the VIX closed with the lowest daily RSI value in nearly 18 years.
The chart above shows that the daily RSI for the VIX reached the lowest value in nearly 18 years on Wednesday, November 23rd.
While these unusually low oscillator levels for the VIX are not necessarily predictive of future price action it is interesting that the VIX, which is often portrayed as the fear index, is extended so low and yet price action remains so weak. One would think that with fear theoretically evaporating, as evidenced by a falling VIX, price would be rebounding more forcefully.
There still has not yet been complete VIX term structure backwardation. VIX term structure backwardation occurs when the market prices in decreasing volatility in the future. The VIX term structure usually goes into complete backwardation near economic cycle bottoms, as this structure reflects the type of capitulation that major stock market bottoms typically exhibit.
The chart above shows the VIX term structure. Currently the market is pricing in higher volatility in 2023.
This chart may suggest that a major market bottom has not yet occurred since the market continues to price in higher volatility in the future.
Regression Channel
Regression simply refers to the idea that price tends to revert (or regress) to its mean for a given timeframe. Regression channels can help us extrapolate the strength of the current trend. These channels can also give us insight into trend reversals.
Since the start of 2022, the daily regression channel has been down sloping.
The chart above shows a regression channel applied to the daily chart of the S&P 500 (SPX). The red line is the mean or average price. The lower blue line is 2 standard deviations below the mean and the upper blue line is 2 standard deviations above the mean. To use this indicator search for the script "Linear Regression (Log Scale)" by Forza.
The S&P 500 recently reached the upper channel line, or 2 standard deviations above the mean.
The chart above provides a closer look at the regression channel. The indicator on the bottom is the Stochastic RSI indicator which gives us an idea of how overextended price is currently trading.
Price appears to have been resisted by the upper channel line. At the same time, the Stochastic RSI oscillator appears to show that price is becoming overextended to the upside. This could mean that price may retreat downward on the daily chart.
Ichimoku Cloud
The 2-day chart of SPX below shows that since the start of the bear market no candle has been able to close above the Ichimoku Cloud.
The chart above uses the Ichimoku Cloud indicator. This is one of the best indicators for detecting trend reversals. When a candle breaks above the cloud from below, it is often considered a bullish trend reversal on the timeframe analyzed. Similarly, when a candle breaks below the cloud from above, it is often considered a bearish trend reversal on the timeframe analyzed. The shaded area that constitutes the cloud acts as support when price enters from above and resistance when price enters from below. A candle close above or below the cloud on strong volume is considered "piercing" the cloud.
We can also see that price is currently at a narrow portion of the cloud. This could provide an opportunity for SPX to pierce through the cloud on the 2-day timeframe.
Weekly Chart
In the weekly chart below, we can see that the EMA ribbon remains completely inverted. The EMA ribbon is a collection of exponential moving averages that act as resistance when price reaches it from below and support when price reaches it from above.
The last time the EMA ribbon completely inverted like this was during the Great Recession.
As shown below, the weekly chart of the Nasdaq 100 ETF (QQQ) looks even weaker than SPX.
The EMA ribbon has not only completely inverted, but it has widened, making it more difficult for price to pierce the ribbon to the upside. In general, price has a more difficult time piercing the EMA ribbon when it is wide than when it is narrow. This is often why price consolidates before it breaks out. Consolidation tightens the EMA ribbon.
Although anything can happen, it remains very possible that QQQ can capitulate all the way down to its pre-pandemic high as shown below.
This could mean that as a ratio to the money supply, the Nasdaq 100 goes all the way back to its March 2020 bottom, thereby wiping out all the wealth that investing in tech stocks created since the pandemic began.
To see why the money supply can be used in this way, you can check out my post here:
Higher Timeframes
When analyzed on the higher timeframes, the S&P 500's current price action looks analogous to the Early 2000s Recession, as shown below.
Following the Early 2000s recession, it took over 12 years for the stock market to sustain new all-time highs. Although anything is possible, unfortunately, the current situation is looking similar.
Additional Charts
Below is an assortment of interesting anecdotal charts that give insight into the current market.
The chart below shows the total securities sold by the Federal Reserve in the temporary open market (overnight reverse repurchase agreements). The chart shows a break has occurred below the trendline that has been in place much of the year. This could mean that the Federal Reserve has pivoted behind the scenes.
The below chart is merely the inverted version of the previous chart. It shows that the Fed has recently been providing increasing amounts of cash to the U.S. banking system.
Yet, the Fed is still hiking interest rates.
The Fed also continues to roll assets off its balance sheet.
So why might the Fed be continuing to hike rates and roll assets off its balance sheet, while also adding cash to the banking system? These actions seem to counter the effect of each other.
In effect, now that inflation appears to be cooling down somewhat, the Federal Reserve is ensuring that there are no liquidity issues within the banking system. While this is good for the banking system, it’s not immediately helpful outside of the banking system. Thus, while U.S. banks are faring quite well right now, liquidity crises are growing in the speculative fringes of the market, especially in the cryptocurrency space. The liquidity crisis is likely to get worse before it gets better because the Fed continues to hike rates, which has a lagging effect on liquidity.
The above chart shows that in the past 12 months over 70% of the capital in cryptocurrency has evaporated. The Fed’s tightening strategy has led to the worst monetary conditions for cryptocurrency in its short history. The liquidity crisis in the cryptocurrency space is likely the tip of iceberg of what’s to come as central banks around the world end their decades-long monetary easing experiment.
Even though the central bank is looking to slow down its most drastic hiking cycle ever, there’s little sign that commodity prices are cooling down sufficiently enough to allow for a pivot to easier monetary conditions.
In chart above, we see that the weekly EMA ribbon is still holding as support for commodity prices. This suggests that the bull market for commodities continues. Over the past year, commodities have increased in price despite tighter monetary conditions. This must mean that the scarcity of commodities, and/or the demand for them, must be greater than the scarcity and/or demand for U.S. dollars. As shown below, the monthly Stochastic RSI has fully oscillated down and is ready to begin pushing momentum back to the upside for commodities.
One might wonder whether commodity prices are forming a bull pennant structure. Imagine how bad it will be if the Fed stops hiking rates and commodity prices continue to inflate. What would happen if the unemployment rate rose to 6%-8% while the inflation rate remained around 6%-8%? This stagflationary outcome is actually quite possible.
The Fed’s tightening has already led to the most extreme decline in the money supply on record. This could have major consequences for corporate earnings because corporations can only earn some subset of a rapidly shrinking supply of money.
The decline in the U.S. money supply is likely to cause major liquidity issues that will reverberate from the speculative fringes of the market inward to all segments of the economy forcing the Fed to intervene to put out fires. Already, we've seen drops in the price of growth and IPO stocks that are so substantial that they are rarely seen outside of the context of recessions and financial crises.
The chart above shows how drastic the price collapse has been for the Renaissance IPO ETF. Recent IPOs depend heavily on borrowing. The cost of borrowing has skyrocketed in 2022, jeopardizing the existence of many companies that completely rely on continued borrowing.
Since the U.S. dollar is the world's main reserve currency, and therefore the most demanded currency, these liquidity issues could be amplified outside of the United States, especially in countries where central banks maintain a much looser monetary policy than the Federal Reserve. Although the Fed is effectively exporting inflation to other economies by hiking interest rates more than the central banks of those economies, the Fed's rate hikes are obviously not without harm to the U.S. economy. Among other things, these hikes will cause unemployment in the U.S. to rise.
Initial unemployment claims have been moving in lockstep with the inverted chart of the assets on the Fed’s balance sheet.
If we apply a smoothened 20-week moving average, the charts look virtually the same.
The reason for the connection between assets on the Fed’s balance sheet and the unemployment rate is simply that these assets influence the money supply. By letting assets roll off, the Fed is engineering tighter monetary conditions which in turn causes a scarcity of money. When money becomes scarcer, companies look to cut costs and the main way to cut costs is to freeze hiring, cut pay increases, cut employee benefits, and ultimately, lay off employees. Hence, the inverted chart of the Fed’s balance sheet can be considered somewhat of a leading indicator for the unemployment rate.
Recently, the yields on the 10-year U.S. treasury bond peaked right at the top of the EMA ribbon on the yearly chart. However, the momentum on the yearly chart is upward, suggesting yet even higher yields in the years to come.
The below chart shows that the 30-year treasury yield has inverted relative to the 3-month treasury yield.
This type of yield curve inversion usually occurs in the quarter(s) leading up to a recession. An inverted yield curve reflects the destruction of credit and the money supply. When the yield curve is inverted, banks can no longer profitably borrow at short term rates and lend at long term rates. Bank lending creates the most amount of money. Since the stock market generally tracks the money supply, as the money supply declines, generally so too does the stock market.
The below chart is very interesting. It provides evidence that the 40-year monetary easing experiment may have ended.
The chart shows the U.S. money supply as a ratio to the yields on 10-year US treasury bonds. By creating such a ratio, we elucidate the Fed's the monetary interventions over the past 40 years. As the Fed cut rates, the money supply rose proportionally resulting in this ratio chart moving horizontally.
Beginning in the 1980s the Federal Reserve began to steadily cut rates on government bonds over time as a means to increase the money supply. Then in the 2000s, in order to cut the rates on bonds even more the Federal Reserve began to buy large amounts of bonds. This allowed the central bank to force the yields on bonds artificially below what the market would normally demand. By 2020, this monetary action became so extreme that both real and, in some cases, nominal yields reached negative territory. In a normal set of circumstances, negative yields on bonds would never occur as it essentially reflects a guaranteed loss of money for the investor. Monetary easing, therefore, created a perversion whereby the yields on government bonds no longer accurately reflected the market’s belief in the credit worthiness of the government. The main reason why governments were able to get away with this market perversion was because commodity prices were being forced lower and lower by increasing globalization, increasing productivity/efficiency, and efforts by China to artificially drive down commodity prices to force out competition and gain control of supply chains. So long as commodity prices were falling, extremely loose monetary conditions did not result in high inflation.
Since the money supply moved horizontally relative to the yields on bonds over this period, we can extrapolate that the decline of these yields is how the central bank was able to increase the money supply. To increase the money supply exponentially without a corresponding decline in interest rates, the central bank would have needed the GDP to grow at a corresponding exponential rate. While exponential GDP growth was feasible in the past, today GDP growth continues to slow globally as populations and resource extraction reach their carrying capacity. Therefore, the problem that central banks currently face is largely insurmountable. Central banks can no longer increase their money supply exponentially while GDP growth is slowing, and while interest rates cannot be cut further without causing high inflation. Central banks are trapped because they have run out of tools to artificially prop up the value of risk assets. They are now forced to let the air out of the biggest asset bubble in history. Fortunately, so far, the deflation in asset prices has not been particularly chaotic, but that could change as unemployment rises and geopolitical tensions mount.
Nonetheless, it is during market turmoil that continuing to accumulate diversified, no-fee or low-fee investments in tax-sheltered retirement accounts can prove most lucrative in the long term. History has shown that staying invested in the stock market is the best means of wealth preservation over the long term.
Please leave a comment if you find an error in my analysis above or if you'd otherwise like to share your thoughts. Thank you.

SPY Bearish Flag | Put Options After the Midterm Elections price target was reached:
Now the S&P 500 Etf SPY is ready for a breakdown from the Bearish Flag Chart Pattern highs.
In the light of recent unemployment data reports, i would buy the $387 Puts expiring 2023-1-20 for $4.89 Premium.
Looking forward to read your opinion about it.


ES short ? Tomorrow is a key and pivotal moment for ES and the rest of the market…a good reaction to NFP tomorrow morning and we change trend moving forward, but a bad reaction and this likely starts the next leg lower. You can take a speculative short w small size here and target 4000 with a stop loss above 4110. Preferably i prefer to wait until the reaction and react accordingly. If we break the trend we likely head to 4300 area before years end. If we break 4000 then 3950 is on the table minimum, and we can possibly test lows in the next few months. I am inclined to lean bullish based on Dow already breaking its TL and making a higher high, plus high yield bonds breaking its trend as well as yields and DXY as well…which has marked major lows in the past

SPY FORCAST (sell)- on the weekly chart : the price reachd the SNR level
- on the daily chart : the price show a regection from the SNR level and good red canddle indicates the continue of the down trend
- best move : sell

spy targets on weeklylets go for the dump where it will be going looking at the fundamentals being bearish charts start to make sense
