Spyshort

SPY To resume lowerSpy to resume lower after completing corrective rally.. Possible catalyst are Jerome Powell speaking at conference sponsored by the wall st journal.

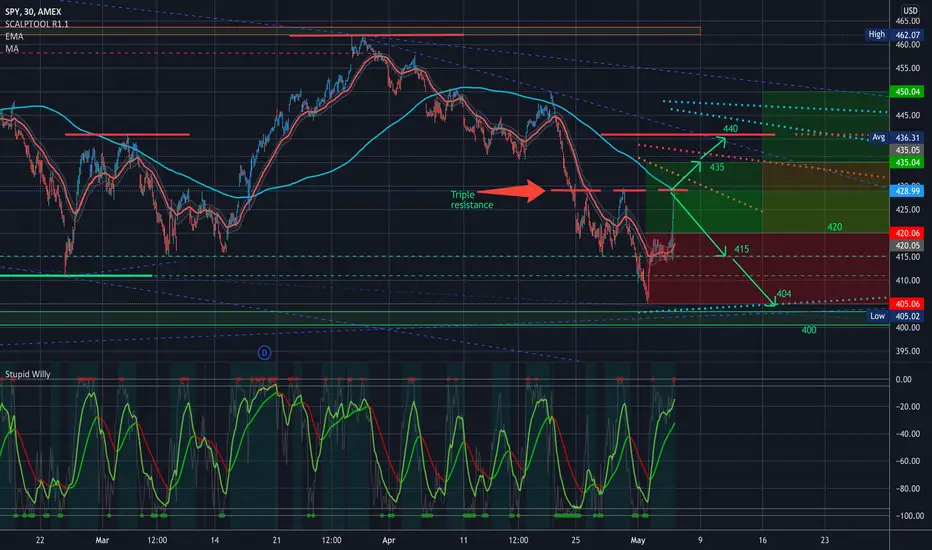
SPY POTENTIAL LONG SQUEEZE!Hey everyone,
Here is a demonstration on a long squeeze for the SPY. Given we have overall bearish momentum, this move is an institutional trap for retail traders who believe they are trading a break of resistance. Always trade the trend.
Peace, Seb.

SPY, ESBattle of the 20d SMA (blue line) is inevitable going into OPEX and even beyond.
The old adage of "Sell in May, Go away" has been in full effect since the week after April OPEX. Failure of the bulls to recapture the 20sma with two consecutive closes has contributed to the decline (one of many factors).
Again, price will be a combination of many things:
technicals (what we're pointing out)
liquidity
sentiment
fundamentals
macro
Fundamentals are starting to matter in an age where the FED is not providing endless liquidity anymore (QE).
They are actually decreasing liquidity (QT) and reducing balance sheet of assets.
So we know the big picture here.
The 20d sma is declining, but that does not mean price cannot quickly move upwards from here.
If anything, we can expect a game of chicken at the 20d sma (as jam croissant would say) - where bulls and bears alike are battling for control.
We are reaching a critical window here for bulls heading into OPEX. Supportive flows will help bulls IF they can get some kind of rally above the 20d sma on two consecutive closes. That will kick start bear rally #2.
If bulls cannot regain control and there are continued closes below the 20d sma by 05/27/22, then we may be in for more decline.
Even with the big picture in mind, counter-trend rallies will be brutal, taking out stops on both sides.
Be careful here in the short term friends.
Long term, as said - until FED pivots, nothing has changed macro wise. Trend is down until proven otherwise.
The 20d sma and price is just one piece of the puzzle.
Ultimately, price is truth and has to be respected though.
Levels are posted for supports.
For ES: 4040 --> 3980 --> 3850 --> 3720 --> 3640 --> 3500 per Wifey on Twitter. Give him a Follow @ WifeyAlpha.
Rough spy levels 404 --> 398 --> 385-383 --> 375-372 --> 365-363 --> 352-350.
Upside will be 4040 --> 4125 --> 4270 --> 4360 -->4410 --> 4500 on ES
404 --> 410 --> 425 --> 435 --> 440 --> 448-450 on SPY relatively
TLDR:
Bulls need to regain control of 20sma at levels posted above in the next couple weeks (ESPECIALLY week after OPEX). If not, big trouble and more decline incoming til June OPEX.
Best of luck traders.

SPY 2008 dailys vs current daily with Burry tweet bout Nadir 180Two questions I had:
how low will this go? I have no idea, so I used Burry's tweet suggestion.
how many years will it take to recover SPY to the current level? I have no idea, so stretched out the pattern based on Burry's tweet suggestion.
I still suck at charting, so don't use this. I actually thought we had one more last bounce, but looks like it's already dropping already.
For this chart:
I took a bigger picture view (curious how long it took for 2008 crash to recover to the same level as current pattern.
Biggest assumption here is using Burry's recent tweet, which said something about Nadir being 10% below the most recent market crash.'
The most recent crash was March 23 2020 (wonderful Covid lockdown times) when Spy was about 220 to 230
So 10-15% below (based on Burry's hypothesis) puts the bottom around 180.
So, I used the same bars pattern to make the very bottom at 180, and then it gave the timeframe.
Don't trade on this, it's just a hypothesis/theory, and I still am new to charting.

SPY 2008 dailys vs current daily with Burry tweet bout Nadir 180I still suck at charting, so don't use this. I actually thought we had one more last bounce, but looks like it's already dropping already.
For this chart:
I took a bigger picture view (curious how long it took for 2008 crash to recover to the same level as current pattern.
Biggest assumption here is using Burry's recent tweet, which said something about Nadir being 10% below the most recent market crash.'
The most recent crash was March 23 2020 (wonderful Covid times) when Spy was about 220 to 230
So 10-15% below (based on his hypothesis) puts the bottom around 180.
So, I used the same bars pattern to make the very bottom at 180, and then it gave the timeframe.
Don't trade on this, it's just a hypothesis/theory, and I still am new to charting.

SPY MAY 12 GAMEPLANToday Apple broke the support level of 150 level which was the main reason spy went from 403 to 392. Bounce back to the 398 area, which is spy resistance. Make sure to observe pre-market we can hit 398 there and then back to 390 level. Significant support at 392. I am going to short from resistance tomorrow. If we see a sell-off in pre-market, then I will observe the market. Then scalp a little on support or resistance depending on where the market is going.

SPX short till 3600 level- SPX expected next support level @ 3600
- SPY expected next support level @ 360
- High inflation could lead to more aggressive rate hikes by FED

The Market Is Crashing and We Are All Doomed - Or Are We? TLDR: A market crash of 50% is not as unlikely as you may think, probably probable actually. Buy gold, buy land, buy commodities. Gather your cash, so you can deploy it on cheap stonks after and become a gazillionaire.
I'm about to break down why the largest crash in history may happen very soon. A lot of very interesting events culminating right now, and if you plan on investing throughout your life, moments and times like this are important for your future self, as it wont be the last time a correction or crash happens. Paying attention now means more mula later.
First and foremost, its clear there's a correction happening. There's no argument there. I'm not typically a bear, nor am I typically a bull. I try my best to stay neutral and go with whatever flow the market takes me. BUT...
Many of the same aspects from previous crashes are showing here such as:
Frenzied investor spending - Multi Million Dollar NFTs, Exploding New "wacky" Cryptos (Doge, Shib etc), The takeoff of "meme" stocks
Extremely high growth in emerging markets - (SPY grows 90% in 3 years, has one of its best performance years ever (2021), (look at AAPL, MSFT, FB charts) The same happened in the previous three crashes of the last century (1929 crash, previous year saw 80%+ in growth)
High deviation from the mean (price always reverts back to mean!!) Looking at the S&P, the past 3-4 years has seen quite the deviation compared to price average in the past 100 years.
Why might this one be the worst so far in history? Just as price goes exponentially higher as time goes on, so do the price dumps. Also, the FED has always been there in the past to buy assets and keep companies afloat. However, this time, inflation may keep that dragged down, limiting the FEDs buying power. Not to mention the economy is currently "fake" in a way, as the FED for the past 20 years has been bailing and supporting the economy after every (even small) correction.
(edited)
Also, the ongoing supply problem China is about to bring, with it shutting down factories and continuing lockdowns. The Ukraine debacle, Russia being one of the largest exporters of Oil, this could put a huge damper on the U.S (that doesn't even include Russia being mean to the U.S because of the U.S sanctions to be placed by these actions.) In super high speculation, if this begins to escalate, China would take the side of the Russia, and China is the largest exporter for U.S goods - period. This would not be like WW2. ( I don't just mean fighting, I also mean sanction wars - taxing etc)
We also have a super old president. This isn't a jab at Biden. He's the oldest in history, and assuming he has no health scares from now till election, I doubt he will run again. If he does, we have even more reason to be concerned about his health. God only knows what would happen if something happened to a U.S president in this hyper-informational world, and with events like this going on. If Biden doesn't re-run, we will be dealing with another election in the U.S. High disinformation and political polarization, all while this is going on and our historic enemies are doing no no's that NATO does not like.
Now, with all of this being said. I, am, not, a, bear. I love things going up. Just seeing things for what they are right now. Take the information above as you will, and form your own hypotheses. Hopefully all will be well in the short and long run, and we can all make some money from this - lets not forget history's richest men appeared in the most turbulent times.

SPY S&P 500 Compared To 2008 - Will We Follow The Same Pattern?The daily chart for the S&P 500 looks eerily similar to the chart from the 2008 crash. We have already crossed below the VWMA 100 and VWMA 500 now which are both historically very supportive moving averages. I think it's very possible we chop around in this area for the next couple weeks while we wait for the VWMA 100 to cross below the VWMA 500, but if we can't stay supportive back above the VWMA 500, it will likely fall pretty hard. If it's anything like the 2008 crash, it should be a steep drop from here, but there are a lot of other factors at play so we will just have to wait and see.
The 2008 drop fell 56% from its high over about 510 days. If we perform the same this time, that would mean a drop to around $210 that would happen around the middle of 2023. Again this is just if we repeat the exact same thing statistically. $210 is also the low from the 2020 pandemic crash and a likely area for it to hold if it does make it down that far.
Something to note though is that when matching the two timeframe's chart patterns, the 2008 chart pattern took twice as long to play out. So with the bottom reaching a 56% drop over 510 days, it looks very extended and not very similar to the timeline from 2008. This makes me consider that if we do follow the pattern from 2008, it may happen in a shorter timeframe such as a year or so. This is purely speculative and obviously there are a lot of other things that factor into this, but I'm just comparing chart patterns here as possible outcomes.
We should see some good support in that purple cloud though on the way down. Those are the EMA 1000 and EMA 2000 which I are typically very strong support/resistance.
If we do follow the same pattern as 2008, I'm waiting for price to reclaim and stay supportive above the VWMA 100 before entering LEAP Calls when it rebounds. Then wait for price and the VWMA 100 to get back above the VWMA 500 for confirmation of another actual bull run to begin (but that could take 2+ years to happen again if this scenario plays out).
Drop your thoughts in the comments, I'm curious to hear what others have to say on this comparison.

Beautiful Bear trapHere's the deal for those perma bulls. this isn't an in-depth review but rather an summary and estimate.
1. We are in a market shift whether you like it or not.
2. We might have one test of 450 remaining. however, We may see sub 400, first due to the tape and the multiple short trend defining shorts being loaded.
3. I expect to see one shot test of around 420's or high 419's in the attempt of making a semi-major higher lower below 430's made on fomc Day.
So in general:
i expect another test of around could be from monday to tuesday in span testing the 420's area which could be supported by a GAP-UP in PM flowing a sharp rejection of that area leading to a test again of 410's which will be broken to 405's and prolly retest 410's with a combination of AH and IB period sessions before a push to pass 405's (this could be pushed into next week but could be friday of this coming week of the 9th of may, 2022..
Message: DON'T get trapped and tricked by RSI oversold/overbought reading going into the next two - three weeks will get burnt may want to stay out if you can't handle the VOLATILITY, expect some head spinning action.

SPY ShortLooking like SPY is creating new highs at $413 a share. Im speculating that SPY will reject this resistance and trade into the 406-408 zone. Thinking im goign to buy some Puts for SPY. I will update when I decide what put play I will get in

SPYToday, we saw a massive sell-off after yesterday's massive rally, but there was an enormous volume at the end of the 15 minutes of the trading session. I see two scenarios tomorrow.
Scenario 1- we might see a dump at the beginning and then upward correction in which the spy will touch the 417-418 area and then back down again.
Scenario 2- We might see a sideway trend as well. 417-418 area, then back down to 410-411 area.
I'm bearish here because the pump didn't last even for a day and nobody bought the dip today. I'm looking for a 340-360 area to go long.

SPY Inverse Head and Shoulders PatternI think SPY is forming an Inverse Head and Shoulders Bullish Chart Pattern with a target of $480 by the end of the year.
Today the Contrarian Investing is a good idea: "Buy When There's Blood in the Street"!
looking forward to read your opinion about it.

$SPY Key Levels, Analysis, & Targets $SPY Key Levels, Analysis, & Targets
So today was just FUN…. I was expecting a rally today and we sure got a face ripper…. No surprises in the fed meeting so the market had a party.
How did I play today? So we opened at 417 so I chose that as my call strike. I added a VWAP to that options chart which gave me a starting price of 3.28, which I cut in half giving me 1.64 so that is what I set my buy order to. It filled around 10:30 and I immediately set my sell order for a 50% profit and one hour later around 11:30 I closed that trade for a 50% profit (1.64——>2.46) X10 contracts. It was a small win (820), but I’m definitely sticking to small trades for now. Yes, the market rallied hard after that and I could have made a lot more, but I decided not to play the fed meeting. And profit is profit. I’m managing to hit that 50% quite regularly using this strategy so I’d rather be consistent then be upset that I didn’t make more.
Now we are at a double resistance level at 429 (red arrow)… and ALSO right at the 200MA on the 30min chart which you can see has been quite a strong resistance, and also the 35EMA on the 4hr chart. If it does break above I can see perhaps a run up to 435-440 (right shoulder of H&S?) and if it gets rejected then a retest of 404 or even a possible attempt to fill that gap below…
I’m taking this market 1 day at a time basically just scalping and day trading on the top contract which, again, I don’t really recommend if you’re still learning… if you’re still learning it’s better to wait for a confirmation of direction or trading much further out to improve your chances…
There you have it… my entire thought process LOL… Hope this makes sense…. I don’t know, the more I stare into this chart the more I’m thinking puts tomorrow…. But let’s see how this opens, there is a little bit of room to the upside so I don’t want to be hasty….
Let me know your thoughts… I truly enjoyed playing the bullish side MTW, but I think It’s time to get back in puts…
$SPYThe investment seeks to provide investment results that, before expenses, correspond generally to the price and yield performance of the S&P 500 Index. The Trust seeks to achieve its investment objective by holding a portfolio of the common stocks that are included in the index (the "Portfolio"), with the weight of each stock in the Portfolio substantially corresponding to the weight of such stock in the index.

$SPYThe investment seeks to provide investment results that, before expenses, correspond generally to the price and yield performance of the S&P 500 Index. The Trust seeks to achieve its investment objective by holding a portfolio of the common stocks that are included in the index (the "Portfolio"), with the weight of each stock in the Portfolio substantially corresponding to the weight of such stock in the index.

$SPY $417.39 Fib 0.5 and $420.33 Fib 0.618$SPY $417.39 Fib 0.5 and $420.33 Fib 0.618 on the table again, $420 last strong support now becomes resistance. $VIX having also some retrace should give room for continuation of Monday run.

The Frightening Similarity between the SPY in 2008 vs 2022! 😨Hey everyone!
Almost 1:1 fractal between the crash in 2008 and today.
The scales have almost tipped. Stay ready.
Just remember, be fearful when people are greedy and be greedy when people are fearful. It seems to me that many believe that the bull run is not over. Interest rates are increasing to counter inflation. Interest rate hikes slow down the economy. We are almost there.
✌️ Seb

SPY: Expect the downtrend to continueIf the downtrend continues as we expect then we need to focus on the DOM C level as a potential target.
If the markets were to 'gap up' on Monday it is our opinion those are triggers for going bearish into 'assumed strength' by the novice traders.
We are heading for the May 2021 lows on SPY (aka ETF of SPX).
NOTE: If this DOM C level is breached, then our position 'for the week' is to go reverse (bullish) with a close above the 394.82 as a weekly trade.

spy weekly head and shouldersspy forming weekly h&s pattern at critical support 410.64 break would be confirmation where we an see 400 and below where we have our next critical support at 394 then 368 which is around the weekly 200 ema however we can bounce here and see 423 then 454

$SPY Is in a broadening channel$SPY Is in a broadening channel. Should test sub < $410 before making a bounce to the 0.382 ($417.08) & 0.5 ($419.47-$420) Fibs

Spy 4/28/22 outlookSpy is still in my regression channel however i see areas of support at 437. I see spy either making move down through this cannel to 405 or reclaiming 437 before moving downward again.
Not financial advice i am not a financial advisor. Trade at your own risk.
