Spyshort

US Market Technicals Ahead (4 Jan – 8 Jan 2021)Markets will face their first major challenge of 2021 as the rapid spread of a new, more contagious coronavirus strain means that economic gains could still be a way off. The December jobs report on upcoming Friday could show that the pace of hiring is slowing down amid renewed pandemic-related restrictions on businesses. Meanwhile, energy traders will be turning their attention to Monday’s OPEC+ meeting where another output boost is on the agenda.
Here is what you need to know to start your week.
S&P 500 (US Market)
The benchmark index ($SPX) rallied with a modest gain of +1.43% (53 points) during the final week of 2020, closing at an all time high of 3,756. At the current junction, $SPX price action remains within the tight 3% trend channel range highlighted; and there will be expectation of a minor correction in the upcoming week in technical perspective, with $SPX trading near the upper bound resistance of its trend channel. Additionally, a short term price-volume bearish divergence is also been observed.
The immediate support to watch for any signs of weakness is at 3,660 level, a break of the lower trendline support.
Top 3 things to watch this week:
1. Vaccine rollout
With U.S. case numbers surging and vaccinations proceeding more slowly than projected Senator Mitt Romney on Friday urged the U.S. government to enlist veterinarians and combat medics to give out coronavirus vaccinations.
While the U.S. has approved two vaccines, rollout is going more slowly than the government hoped. About 2.8 million Americans received a COVID-19 vaccine by Dec. 31, falling far short of a 20 million target.
The U.S. is averaging 186,000 cases a day, down from a peak in mid-December of over 218,000 new infections each day. Health officials have warned that cases will likely spike again after holiday gatherings.
2. December jobs report
The first major U.S. data point of 2021 will be Friday's nonfarm payrolls numbers, which could show a loss of momentum in the labor market.
November data already indicated the employment market was losing steam, with 245,000 new jobs added, the fewest in six months. For December, expectations are for an even smaller 100,000 gain.
3. OPEC+ to debate supply vs. demand
The Organization of the Petroleum Exporting Countries and its allies, including Russia are to hold a virtual meeting on Monday.
Oil prices ended December with gains in a positive end to a year that saw U.S. futures turn negative for the first time ever in April.
In December OPEC+ held back from plans to boost output by 2 million barrels per day after implementing a record 7.7 million bpd supply cut earlier in the year to shore up prices. Instead, it increased output by 500,000 bpd and agreed that additional monthly adjustments would not exceed that amount.
Russia has indicated that it will support another 500,000 bpd production increase from February, despite concerns from others in the group that it is still too early.

Spy going down to 100ma and 200 maMACD in negative territory, SPY should be tagging 100 and 200 ma in the near future.

Must have hedge in every portfolio SPXS I cannot stress the importance of having this must have inverse ETF in your portfolio during these uncertain times. I have lost faith in believing anything I see or hear after living through 2020. I do not trust the news, data, markets, govt, etc. after going through the biggest fuck fest of my lifetime.
This year I learned everything there was to learn about my personality through trading. Trading exposes all of your weaknesses and strengths. It also exposes all of your bullshit and allows you to learn to change your very strong beliefs that market doesn't give a fuck about. Charts also expose all of the bullshit about markets. Divergence (bearish or bullish) is usually a bullshit-expose-barometer for me personally.
This chart is probably the biggest mindfuck I had pleasure looking at this past months. If I saw this MAGA bullish divergence on any other stock, I would be buying this stock with all of my ammo and I'd throw a kitchen sink at it. However, with Jerry at the driving wheel - I have no idea what this will do next but I wish Jerry and the gang a Happy New Year and I hope that demogorgon doesnt get his ass and doesnt drag him into the upside down cause Jim Hopper aint coming for his ass.
All I am trying to say - keep this one on your radar.
For those not familiar with this ETF, copy pasting it from Google: "SPXS is an extremely aggressive bet against the S&P 500, promising to provide -300% of the index's return for a one-day period. The fund, like most geared inverse products, is designed to deliver its 3x inverse exposure to the S&P 500—a cap-weighted basket of 500 of the largest firms in the U.S.—for one trading day."
Happy New Year Fellas!
PS: always do your own research, dont listen to pajama pants traders online.

SPY - Road to $400 What could cause the next sell off?
1. New virus mutations
2. No stimulus deal
3. Looming eviction crisis
4. Valuation concerns and earnings miss
5. Technical bearish divergence (look at all previous similar set ups on the chart)
6. Possibility of Govt shut down
7. Cyber security breach. What news can come from it?
8. Trump and recent Iran tensions
If any or a combination of these catalysts materialize, House and Trump will have to come to an agreement fast (before inauguration) and approve the MAGA way stimulus plan. If 20-30% of all money supply was created in 2020 - DO NOT expect SPY to go anywhere close to $220 (thats just mathematically not possible) and thats wishful thinking....even if you a perma bear.
What seems to be possible is a brief drop to $320-330 area, on the way there we would fill a few gaps and we would turn around on stimulus deal and go to our long term ultimate target of $400.
What about gaps down below? Well, they will have to wait for now.
Definitely do not take any of my posts as a trading advice but hopefully you find them somewhat useful.


Day Chart full of GAPS, $SPY is a sheer ILLUSION OH CUE THE D*MN MUSIC: A big fat $600 is coming to every American.
Naturally, the markets are pumping, but there are massive gaps on the daily chart. This might begin to correct immediately after hours, if not before with a loss of the false-floated enthusiasm. To be clear, this trader has no idea *WHEN* $SPY will begin to really crap itself-- but, ignoring the WHEN - we have the WHY & HOW: handout checks that will come back to bite us all in the rear in 2021.
But hey, in the meantime, everyone is singing "Let's GO BUY SOME STONKS, LET'S GO BUY SOME STONKS."
Good luck with that, b/c this bubble is going to burst and those bulls won't be able to get out fast enough as the Ls rack up.
F**K LUCK; BEST LOGIC TO EVERYONE!
-BDR

SPY Awfully similar patterns I am just drawing lines and scribbles here. Don't pay attention. Oh hey look FUBO is running....the next ROKU!
Wedge, megaphone, the W thingy with an extension. Am I just seeing things again or is this just some voodoo shit???
Every bear I know is dead, covered with blood and urine, laying in the dumpster somewhere. Nobody wants to short this thing anymore, Jerry got us!

BIG CRASH COMING!!! $3900 THEN BOOMSmall companies are going to fail due to this pandemic sweeping out the rug and causing a crash of biblical proportions... Looking to get short soon investers BE VERY CAREFUL!!!


Release the BEARS on $USOIL and $SPY: The question is WHEN?$USOIL and $SPY have the same bearish looks with the notion that this top out cannot last.
Oil has stagnated already (slightly upward tick but overall very "sideways"), while the S&P closed with a strong rally--and with what nearly looks like a GAP...
The reversal may not happen Monday, but this trader projects it to happen by late next week or early in the following trading week, after Christmas even.
Please See the related notion of an ending bull cycle (or period, if "cycle" is too loaded a word for some)...
This is something of redundancy but for a deeper look it seemed useful to parallel OIL w/ the S&P; they will tank in simultaneous fashions.
--BDR


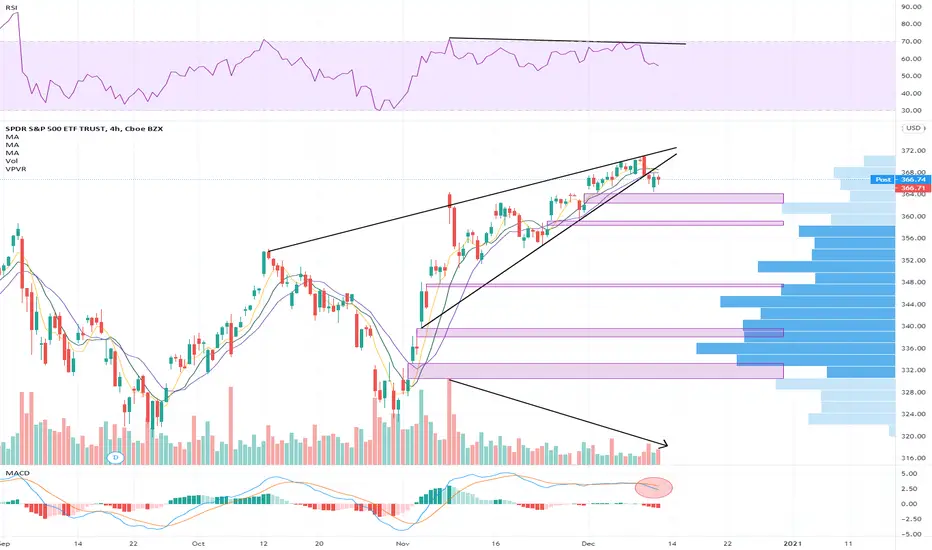
SPY about to move with Tesla inclusion and Stimulus I spotted a dragon fly doji followed by all-time highs. I drew an idea of potential price movement in a downward move. The $371 mark is clearly a resistance and it is funneling into a wedge. If it breaks 371$ we could see some price movement to the upside. With the tesla inclusion starting over the next 3 trading days we could see some downward movement. The index has to spend money to buy up shares of tesla. In the Yahoo inclusion to the S&P we saw a dip in the SPY during that event. With the world in chaos while the market is high on hopes of stimulus we can go either way. All I know is there should be a significant move here shortly.
Give me your thoughts in the comments below.


SPXS - Just leaving it here for you to seeDec 16 - Dec 26 major corrections across all markets. Aliens told me.

Bullish divergence on SPXSSPXS has been slowly gaining strength. The RSI is reversing from oversold territory while the OBV bounced off a support.
Similar price action can be seen before the March pump.
With the S&P and major tech stocks at all time high, it may be wise to get a hedge. In addition, US election limbo may lead to high volatility in the coming weeks.
This is a short term trade. Do not hold long term due to its decay.
Price targets:
4.85
6.5
Note:
This is not financial advise. Please do your own research.

SPY Holding Up During Holidays? Happy Holidays! After seeing the AMEX:SPY hit ATH last week, some wonder if the flame has just been lit or if it's being put out. Will the market hold strong into the New Years' or will it start a correction as Biden makes his way into office.
Right off the bat, I see a few key levels to watch starting with $363.22 as Monthly support and $365.73 as weekly. We should also watch $369.84 and $371.05 as weekly resistance.
As the vaccine is distributed nationally and globally, we could aim to expect a continuation up that is unless we see negative news about this pandemic or vaccine. We also need to remember that Biden will be making his transition into the White House on January 20th, 2021.
God Bless America

DOW Trading Under ATH | New Years WedgeAfter seeing the DOW hit ATH last week, it looks like it could continue sideways for the next week or so as we approach the holiday season.
I'm watching $29,820 as weekly support and $29568 as Monthly support. Looking toward the upside, we've tested the $30,325 range as ATH twice in the last week, confirming it as a strong level of resistance. I'll be watching this wedge moving into the week as we watch for a breakout.
As the vaccine is distributed nationally and globally, we could aim to expect a continuation up that is unless we see negative news about this pandemic or vaccine. We also need to remember that Biden will be making his transition into the White House on January 20th, 2021.
God Bless America


When is this cluster fuck going to dump? Are we there yet? My ANALytical skillset is telling me $400 on this bitch before we dump but my ego is telling me to short this party bus now and take the girls home. You can have the driver (his name is Jerry) but I am taking Ivanka with me. Dont fight the FED they said.

SPY final squeezeFinal squeeze on rising wedge, been consolidating for the past 2-3 business days
We should see a nice break out before EOD or tomorrow.

History doesn't Repeat but it certainly Rhymes Sire!
Be cautious and set stop loss even if you investing.
ATH SPY high 4K looks pretty reachable in the short term though.
Notice how times have changed, now the drops and recoveries are even faster. Exponential.
