Spyshort

SP500 (SPY) Hard SELL off of 3440-3500. Good for 400 points!Let's hope it gets up there, first! (Currently scalping/long for bounce.)

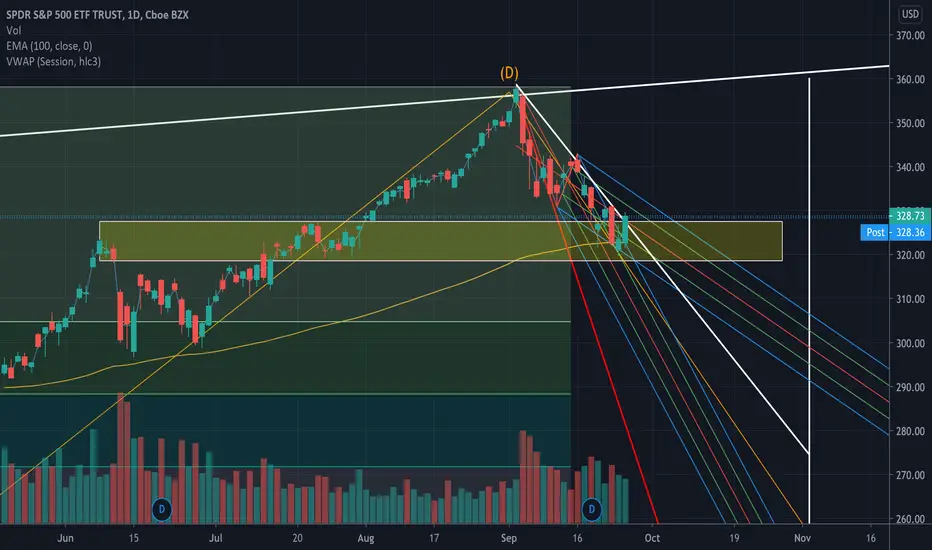
SPY Strong Support... But Still BearishThe SPY flew below the 50d Exponential Moving Average with ease, but now it's hitting major support at the 100d Exponential Moving Average.
On the 21st of September, we hit it and it was rejected.
On the 23rd of September, the day closed on top of it.
On the 24th of September, the market fell below it but the market closed slightly above it.
Today, September 25th, the market opened on top of it and had an extremely green day rising way above it.
I'm still leaning on the short side. We're still bearish as we haven't broken the bearish pattern yet (take a look at the white angular line and the pitchforks). If we break above these, I wouldn't say we're bullish or bearish... it would be a wait and see scenario.
If the market falls below the 100d Exponential Moving Average (and stays down there), we'll be in extremely bearish territory.
S&P 500/SPY Move down to continue!$SPY / $SPX
Today's price perfectly bounced from the 0.236 Fibonacci retracement levels. $ES_F S&P futures are hovering around a moderate resistance level of the 15 EMA and 0.382 Fibonacci retracement level which is around $3300. It's important to note we're still in a downtrend for the past almost 3 weeks. The price has constantly been rejected at the 15 EMA, 50 MA and Fibonacci levels. Thus, I expect the pattern to hold and expect to see a downward movement soon to around ~$3122 levels.
If we see a break of $3300 I'd expect to see a price of $3350 and possibly $3400 to trade.
Please share your thoughts. I love to learn and have a healthy discussion!

9/23 UPDATED BEAR THESIS $316-317 next stopKey points
The DXY may bounce on resistance as shown
Oil may bounce on support as shown
Bonds remain unchanged as shown
Need to gauge Asia's reaction from our sell off today for confirmation on tomorrows trade
For those that don't understand intermarket relationships. From left to right and can start at any point.
Currency ------> commodities -----------> bonds -----------> Equity -------> currency --------> commodities ---------> bonds -----------> equity.
Huge markets reacting to one another, all interconnected, all correlated globally.
Given the circumstances, Spy is sitting in no-mans land right now with a straight shot to 316-317, but given that the DXY and OIL is looking to bounce off support/resistance means its bullish for SPY(meaning a relief bounce is probable, but will only be able to tell at tomorrows open, we need to see how asian markets will react to our sell off today)
The Dollar had a textbook breakout to the upside. When the Dollar rises, equity falls.(not all the time). When Oil loses value ----> spy loses value)
My chart merely shows that OIL is near a support line and that Dollar is near a resistance = Probability of Spy having a relief bounce.
The Risk vs reward is still heavily favored to the bears.

Spy Major SupportYo guys, if we break this support for spy, we can possibly see $287 coming here in about a week or two. Hopefully the government steps in before that happens, but things are looking pretty grim.

3100 Target SPX SPY SHoRtNot saying a specific number but right around those 200 day averages and down trend play. I'm taking /NQ to 10550/650 area, as well. Short.

Short/medium term Bearish thesisSeptember 28th Resistance/support will intersect and we will see downwards movement into new territory.
The risk vs reward for shorting is much greater than going long at the moment.
Short term Bearish/neutral
Medium term Bearish
Long term Bullish
I believe we are setting up another Jan 2018 OR OCT 2018.
Red arrows indicating heavy resistance
Red Arrows resistance
Blue diagnal line - current downwards trend
White line- Major resistance
Red line - resistance
Orange line - weaker resistance
Green line - March - september bullish trend.
Green line intersects with white line on a catalyst day (fed speaking).
We are now in a trend reversal, but need to keep an eye on these levels.

My General view of SPY
In my philosophical view, humans tend to always need an "answer" for everything in life. Historically we created gods to explain the unexplainable. That's not to say that i am an atheist in my religious view, nor am i trying to make this a religious discussion, I'm purely commenting on human nature. We are a curious species and we learned to not take "no" or "i don't know" as an answer from a very early age of our ancestry.
If you look around you, it feels we "must" have an answer for everything in life, including the unexplainable (consciousness). Scientific people call it "coincidence", religious people call it a "miracle from god". To advance in our life we need to see these two groups of people from a third persons perspective, and understand both sides. It doesn't always have to be black or white, right or wrong. It's okay "not to know", as long as you are the path to enlightenment through spiritual or scientific, that's all that matters.
I am only a man, born into this world trying to make sense of something insensible for my time.
So why is my philosophical view important in the way that I trade? I see many traders nowadays pointing to the news as an "answer" for their directional bias in the markets. Trump said this, trump said that, markets go up, markets go down. The media business sells you the answers, and you buy them because its encoded in our ancestral genes to buy them. To reach a new level of consciousness, you would need to understand the words. " I am only a man, and too stupid of a species to understand anything but." We are a mere spec in the timeline of "(life?)".
My thesis is based purely on objective data with a technical analysis standpoint (sometimes with the exception of federal news.)
Before trying to understand the way that i trade, you would need to understand my philosophical standpoint, and to also assume that nowadays, there is a gap between the real economy and the stock market. The stock market ≠(does not equal) the economy. You would also need to understand the options market and that algorithms created by market makers are always trying to stay delta neutral hedging their positions. And finally the last thing you must understand is intermarket analysis to fully understand my trading view.
So if we can all come to the agreement that we are trading against algorithms, we could also say that we are trading against logic. In this case it is MUCH easier to trade against logic than against emotional traders because every move in the market is based on a formula instead of being based on a opinionated rational/irrational decision to sell or buy. Do I know the formula? No I don't, and that's okay. What i do know, is the results of the formula at work. Sometimes its easy to spot when live trading, sometimes it can only be spot with hindsight bias, sometimes the answer is never found, AND THATS O.K.
For example, i don't see where or why "2+2" is happening, but i keep seeing "4" as the answer.
So if we can all come to the agreement that we are trading against algorithms, we could also say that we are trading against logic. In this case it is MUCH easier to trade against logic than against emotional traders because every move in the market is based on a formula instead of being based on a opinion based rational/irrational decision to sell or buy.
TL;DR We are not trading based off psychology any longer, we are trading based off logic. (algorithms & formulas) My thesis is based purely on objective data with a technical standpoint (with the exception of federal news.)
AMEX:SPY
Multiple resistances/support areas for the S&P.
We have always respected the white resistance since the 2008 financial crisis. The solid green line in the middle is what i consider the "goldilocks" zone. A habitable zone in which "fair price" has been achieved in the context of the uptrend we are seeing since the 2008 financial crisis.
In conclusion, to not make my first post too long i will write some pointers in how i trade.
I trade Spx products vs volatility
I trade Spx products vs forex
I trade Spx products vs bonds
I trade Spx products vs commodities
I trade Spx products logically ( I heavily disagree with EWT methodology)
I trade Spx products using intermarket relationships
I use historical resistance/supports in all markets to gauge activity in what i'm trading.
As time goes on i will post many charts of what i wrote above, and too make things less confusing i will explain as i go.

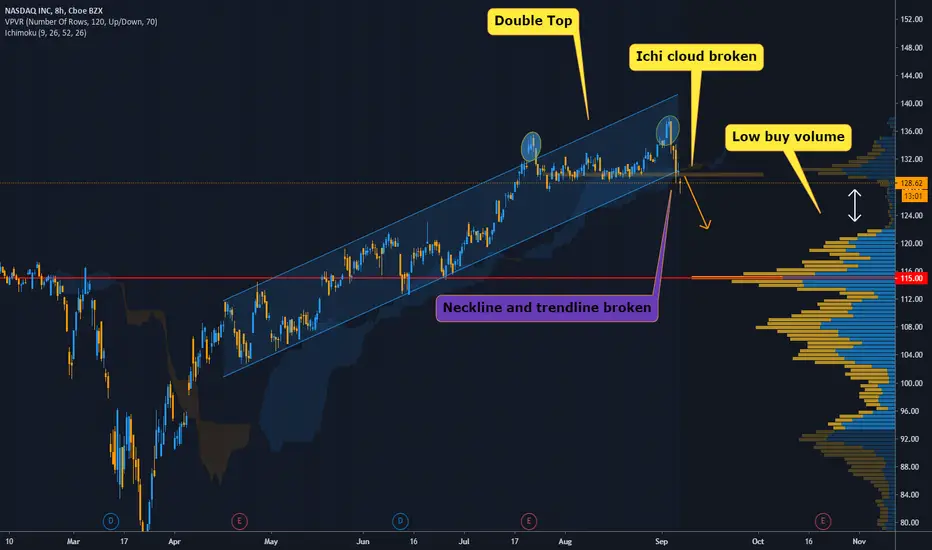
RSP's Head & ShouldersClearly bearish as we broke through the head & shoulder pattern's neckline. Likely to consolidate slightly around $105-$107 before heading lower. Currently finding support around the 100d-EMA right now, but imo, likely to head lower over the coming weeks. You can also see a "double top" pattern when you look at my top-most yellow rectangle. Each yellow rectangle represents likely support/resistance zones.
If I had to guess, I'd say we're bearish until the end of October or mid-November.
Keep in mind, the RSP is an equal weighted ETF of the S&P500 index. This means that, imo, the RSP gives a much clearer picture of how businesses (and the stock market as a whole) are doing. However, I don't believe technical analysis of the RSP (in terms of making buy/sell decisions based purely off of indicators) is extremely accurate. I don't believe it is because most people are looking at the SPY for their technical analysis to make buying/selling decisions.
When technical analysis is correct, it is my personal belief that it is because of the self-fulfilling prophecy that many other people see the same thing and are making the same decisions at the same time. Thus, the SPY is better for deciding short-term buy/sell decisions. I think the RSP gives a broader, clearer long-term picture of market direction which should be used as a tool in tandem with the SPY and your own strategy.

$SPY INDEX TECHNICAL BREAKDOWN | OCT 2020Friday was the quarterly event known as quadruple witching where S&P 500 (SPY - Get Rating) futures, options on those futures, options on individual equities, and single stock futures all expire. In the past, these ‘witching’ days have been characterized by above-average trading volume and increased volatility. But, in the current environment, those are relative terms as both have been elevated for the past few months. Still, expect some wild gyrations, especially as we head into the close today, which could carry over into Monday’s opening as positions get squared away, hedges get established and positions are rebalanced. Data suggests that there are some 90 million options contracts likely to settle in-the-money and approximately $32 billion in index rebalancing, which needs to occur.
~
SPY currently sits above what has proven to be strong support @ $327 which could offer as a decent entry point considering our next support is at $324.
Possible long on a break and hold of resistance @ $332.
Upside targets: $340, $344, $347
Possible Short Entry pn break and hold below $327
Patience will pay, be very patience with these levels.
DotcomJack | Michael Jordan of Stonks


SPY price chart similar to price of DJI during 1929
DJI during Great Depression price in USD is fairly close to S&P 500 index now. During Great Depression it was a 50% pullback followed by a 50-55% gain, followed by another 50% pullback.
On the SPY index it was about a 35% pullback and we are at the top of a 35% run up. Expecting a 38% pullback in the coming months.

SPX heading down to 2000..On today's close, the uptrend that began in April is now over based on the intermediate term EMA cross. There are several factors which I would conclude are ripe for a major decline in the S&P 500 of which include:
- Upcoming election in the US
- Global economy mired in recession/depression
- Massive overvaluation
- Poor internals
- A few select stocks (FANG) leading the capitalization weightings
- Overall bearish seasonality
We will be taking short -5x ES contracts (-1x SP CME) on Sunday evening. Target is 2000 on the SPX with a slight possibility of a major reset down to 1550-1650 range if the panic is strong enough. VIX 100+ is possible during this timeframe. Buckle up and get ready. USD cash will be the strongest asset. All else (gold, bitcoin, commodities, etc.) are going to get hit BADLY...

SPY May be Forming a Huge Reversion Trend PatternLow Volume at high move
Need to confirm mm20 Break and DownTrend Market will be ON

SPY| Bearish PA| Weekly S/R| Bearish Divergence|.618 Fibonacci Evening Traders,
Today’s analysis – SPY – possible blow of top with further downside probable, following technical points to consider.
- Bearish PA (swing high)
- Valid bearish divergence
- Weekly S/R support
- .618 Confluence (200 DMA&DEMA)
- Increasing volume
SPY’s immediate price action at swing high is bearish; a large wick on a weekly candle usually marks a temporary top, this allows us to have a bearish bias on the market.
Weekly S/R is the next logical support; price action is likely to have a reaction. Breaking this level will be very bearish. Price will then have a higher probability of testing the .618 Fibonacci in confluence with the 200 DMA&DEMA.
Spy currently has a bearish divergence on the weekly; this is an indication of weakness in the market, thus further downside likely.
There is also increasing volume after absorption, indicating sellers are stepping in pushing current volume node above average.
Overall, in my opinion, the SPY is likely to correct further with weekly S/R immediate target. Any short positions are to be risk defined. Price action is to be used upon management/ discretion of trade.
Hope this analysis helps!
Thank you for following my work!
And remember,
“Win, loss whatever emerges in the short-term, place and manage your next trades untouched, unattached... always keeping your eyes on the long-term picture.” ― Yvan Byeajee

Somebody is hammering the close on SPX and price is dumpingLook at the 3 minute chart below because Tradingview doesn't accept posts with a timeframe less than 15 minutes.
It is apparent that people have started to sell the close and there is not enough buying activity at the open or over the course of the day to keep the price up. A lot of traders appear to be exiting their positions at the last 3 minutes of the day. The volume SMA is set to the default of 20, so it when our closing volume of the day is 4.5 or more higher than the last 20 periods and the last hour is the busiest of trading it seems that smart money is selling into whatever strength it can find. On the 15 minute chart the volume for the last candle easily reaches 10x the last 20 periods
To zoom out even further to a dialy chart we see a bearishly engulfing candle that put price action back to where we were a month ago and the On balance Volume is below both the 10 and 20 EMAs. This occurs with the Multiple Time Frame Volatility Stop has flipped to bearish. this is generally a bad situation for the bulls.
I put risk on with SPXU on 9/3 and I intend to hold that till I see SPY out of the monthly bollinger band. If i see the MTF Vstop flip on me first I will re-evaluate.

Nasdaq about to drop???Just looking at the technicals not accounting for fed money this sucker looks ready to drop...
One week left for bears before moonshotEven though the downturn started a few days later than planned, it still met the expected drop. Wave A could have occurred until the end of trading on Friday, but it may have ended Friday morning at 1030.
The red down arrows and one green up arrow are based on Intermediate Wave 3 lasting 46 days and with its move extending beyond Intermediate Wave 1's movement by 134.09%. These arrows are a rough projection of movement. There length may not line up perfectly but points moved are typically much more accurate.
There are two possible tracks for the week.
Option 1:
Wave A may be in the early stages and have only completed wave 2 of wave A. This would drive the index down drastically at some point this week, before a bounce up and then more downward movement possibly with a bottom next week. A significant upward wave B would need to occur before the end of next week and then another week or too of significant drops until wave C finds its bottom. THIS COURSE IS UNLIKELY. I assess the next one to be most likely.
Option 2:
Wave A did in fact complete itself at 1030 Friday. This would mean it lasted roughly 18 30-minute bars instead of the projected 29. The projected top to bottom movement of Wave A was 246.25 versus the actual of 238.48.
Wave B's projected move was 145.44 over 20 30-minute bars. With wave B's likely end, it only lasted 9 bars and climbed 105.51. Based on my analysis, B waves typically last around 75% the length of their wave As. This B wave would be half of that, which is not abnormal, but could mean wave B moves a little higher over the first 2 hours of trading on Tuesday.
Wave C was initially projected to drop 223.11 over 33 bars. Wave C can still do this, especially if wave B moves up toward 3487 early on Tuesday.
If wave B does not find a new top by 1130 Tuesday, wave C could be in full force. With wave B starting early by 22 30-minute bars, wave C could end early by 22 bars or more. The earliest end for wave C is 1030 Thursday.
If wave B continues for a few more bars, wave C should find a solid bottom before 1430 Friday. It might be a little odd to sell during the course of a week, albeit it a shortened week, just to come off the bottom for the final 90 minutes of the week. A more likely action would be wave C's bottom earlier in the day Friday or the following Monday.
Long-term projection is still on track for a rise to new all-time highs before mid-October, followed by 700-800 point decline through Mach 2021, and a massive rise to new all-time highs again before finally crashing in early 2022.
We will see what happens. Keep checking back as we track this wild ride to the end in early 2022.

Nearterm outlook on $SPX $SPX $ES_FConsidering the Thursday/Friday price action as an impulse wave to the downside

Advance Decline Line did great job. What is next?Last week was hot for stock traders. As we discussed SP500 rallied a bit higher and was rejected. The Advance Decline Line did its job perfectly. I think the market can retest 3500 or higher and if rejected, we can sell for 3200. We still can see a big rally this year. Cycles and Fed Funds forecast indicate the beginning of an uptrend at the end of September. Besides, the stock market is usually strong before Elections. But for now, let's focus on very short-term trades.

SPY - Short: A Market Correction Could Be Coming in Sep 2020Base on Renko candle chart, we easier realize an ABC Correction Wave are forming after Elliott Uptrend Waves completed.
This correction should stop at $315 - $320, right the top of 3rd Elliott Wave. That is important Demand Zone.
If a big Panic Sell happen, it easy to take SPY down to $295 - $300.
To break this downtrend, SPY needs to close above $352 for at least 2 candles of D1.
This scenario, in my opinion is only about 15% likely to happen.
Sit on hands and watch the trend.
Disclaimer.
P/s. I hope I'm wrong.

