SQQQ A buy from 8 hour chartMFI 50 CROSSING OVER ON 50 PERIOD
Disclaimer, this is only for entertainment and education purposes and doesn't serve by any means as a buy or sell recommendation.
SQQQ

IXIC: What Beta Means When Considering a Stock's Risk If you like this analysis, please make sure to like the post, and follow for more quality content!
I would also appreciate it if you could leave a comment below with some original insight.
In this post, I will be providing a thorough explanation on the concept of Beta, and why it's important to consider the Beta value when investing in stocks.
Definition
Beta is a measure of the volatility , or systematic risk, of a security or portfolio compared to the market as a whole. It is used in the capital asset pricing model (CAPM), which describes the relationship between systematic risk and expected return for stocks.
For beta to be meaningful, the stock should be related to the benchmark that is used in the calculation.
However, a text-book definition of the concept does not really help us understand what Beta is
How to calculate the Beta
- To begin with calculating the value, we must first start by spotting the price change of a certain stock in comparison to the market's movement
- After a certain period, we collect enough data (grey dotted points), allowing us to plot a trend
- With this, we can figure out the relationship between the profitability of the stock we are looking at, and that of the market
- Based on the data, we calculate the Beta by dividing the product of the covariance of the stock's returns and the market's returns by the variance of the market's returns over a specified period.
Explained Through Examples
- We can consider 3 types of stocks:
- Stock 1 with a Beta value of 1
- Stock 2 with a Beta value of 0.5
- Stock 3 with a Beta value of 1.5
- We assume that these stocks are all listed on NASDAQ, and the NASDAQ Composite Index (IXIC) moved up by 10%
- Stock 1, which has a Beta value of 1, will show the exact same movement paired to that of the market. It reflects 100% of the market's movement
- Stock 2, on the other hand, reflects only half of the market's movement, with a Beta value of 0.5 Thus, it moves up by 5%
- Stock 3, moves up by 15% as it has a beta value of 1.5, moves up more drastically than the market value, indicating that the stock is more volatile
Four Possible Cases for Beta Values
- We can consider four possible cases for Beta values:
Beta Value Equal to 1
In this case, the security (stock) shows a strongly correlated movement with the market movement. Examples of such securities include Exchange Traded Funds (ETFs) such as QQQ which track the Nasdaq 100 index .
Adding a stock to a portfolio with a beta of 1.0 doesn’t add any risk to the portfolio, but it also doesn’t increase the likelihood that the portfolio will provide an excess return.
Beta Value Less Than 1
A beta value that is less than 1 means that the security is theoretically less volatile than the market.
Having a stock with such beta value helps make a portfolio less exposed to risk. Utility stocks often have low betas because they tend to move more slowly than market averages.
Beta Value More Than 1
A beta that is greater than 1.0 indicates that the security's price is theoretically more volatile than the market.
As in the example above, if a stock's beta is 1.5, it is assumed to be 50% more volatile than the market. Tech stocks tend to have higher betas than the market benchmark.
Having a stock with such beta value exposes the portfolio to more risk, but also higher potential returns as well.
Negative Beta Value
A security with a negative Beta value means that the stock is inversely correlated to the market benchmark.
Prime examples of such securities are inverse ETFs, and certain industry groups such as precious metal mining companies, where a negative beta value is commonly found.
Real Life Examples
- Based on the explanation above, we can now move on to the following examples of stocks listed on NASDAQ for real life examples: Lulu Lemon (LULU), Tesla Motors ( TSLA ), Amazon ( AMZN ), Costco (COST), ProShare UltraPro Short QQQ ETF ( SQQQ )
- Based on the NASDAQ Composite's movement (IXIC), we can see how certain stocks in certain sectors react differently, in similar trends
- In the case of stocks such as LULU and TSLA , we can see that the Beta value is extremely high, as their corrections and impulse moves are severely exaggerated compared to IXIC
- Amazon's movement also reflects a high beta value, but not as high as that of TSLA and LULU
- COST, on the other hand, seems to have a beta value close to 1, as it follows the movement of IXIC. It's less risky, as the drops are not as severe, but the potential profits are not too high either
- SQQQ , on the other hand, is a 3x leveraged ETF that tracks the Nasdaq 100 index . As such, it has an inverse beta value, and shows huge spikes during times of correction for IXIC
Limitations of Beta
- The beta coefficient theory assumes that stock returns are normally distributed from a statistical perspective, but returns aren’t always normally distributed.
- A stock with a very low beta could have smaller price swings, yet it could still be in a long-term downtrend. So from a practical perspective, a low beta stock that's experiencing a downtrend isn’t likely to improve a portfolio’s performance.
- While the Beta value is useful in determining a security's short-term risk, it becomes less meaningful for investors attempt to predict a stock's future movements.
Conclusion
Understanding the concept of Beta is essential in portfolio diversification. A good investor can identify bullish and bearish market trends, and rebalance their portfolio accordingly. A good balance of securities with varying Beta values is imperative for a good balance between risk management and profit maximization.

KEEP IT SIMPLEThere are a lot of new traders getting wrecked. I'm sorry. Follow the trend. Follow price direction. Remember: The news is irrelevant. Follow price. Can you keep your money in the right direction?

SQQQ stretched short term
Disclaimer, this is only for entertainment and education purposes and doesn't serve by any means as a buy or sell recommendation.

Another Taffer in the Shadows?This is the NEW YORK COMPOSITE INDEX. Please see my previous post just a couple of weeks ago about this drop and what to expect from here. Based on all the data I can muster to analyze, the correction is not over. It's possible that we rally and/or drift sideways into the election but this looks very concerning to me.. I keep hearing from too many people that the Fed has their back. They believe the Fed will hold their hand to victory into an eternal upward rally. I am not one to dismiss the melt-up scenario and hyper-inflationary end game, but this is what I see right now.. I see the potential for another drop. The bigger question- what happens after this drop? Do we have a 08-like melt-down or is that just another dip to buy in this bull run? We'll take it as it comes. Please be smart, patient, and immune to public sentiment. Think for yourself but study, study, study!

Update on Nasdaq Regression Trends, Support and ResistanceUpdating these charts for this week as the market character continues to change. If the NASDAQ is going to return to the regression mid-point lines for 1yr, 2yr, 5yr and 35yr, there is still significant drawdown to happen in the next couple months.
Over the past two weeks, the index has gone up and down, but has consistently followed bearish trend lines, even on up days.
Investors are rotating through sectors looking for safe havens that will hold up well. Real Estate was last week, Energy is this week.
Unless something changes (economic stimulus, other news), I'm still expecting a 0.5-3% drop this week (especially if China-relations further deteriorate from the TikTok stall) and 13-15% into mid-October.
Lots of others expecting these drops as well. Look at Call/Put Ratios and SQQQ Volume continues to be high.

Shorting opportunity: short QQQ through inverse ETFs like SQQQThe trend line from the March lows has been broken and the ETF is on the cusp of breaking below its 50-day EMA.
What's more, the MACD is showing a hugely bearish reversal, even more dramatic than it did back in March. This suggests further weakness for QQQ.
SQQQ offers 3x inverse leverage to the QQQ ETF. QQQ tracks the Nasdaq 100, an index consisting of the 100 largest stocks in the Nasdaq. SQQQ offers an easy way to short this selloff in tech, healthcare, communications, etc.

3 Gaps Down Bullish Reversal ConfirmedNASDAQ:TQQQ
On 9/8/2020, it broke support but recovered the next trading day. While doing so, the 3 gaps down bullish reversal got a confirmation when the prices crossed above the level of $124.00.

Quarterly rotation out of Tech and into Small-Mid cap stocks.
Equally weighted S&P 500 (RSP) and IWM had the smallest decline Thursday and Friday compared to other indices. This could signify that the sell-off was mostly over valued tech stocks and not a broader market sell off. Compare this to the price action in June, where RSP and IWM fell significantly, indicating a broad sell off of the S&P 500.
Using this chart, I measured the distance between the Nasdaq and the S&P 500 on June 10, just before the sell off. We can see that there is a 13% variance between the two indices. Compare this to August 12th variance of 21%. Considering that the RSP had a significant decline, we can conclude that there was a broad sell off of small-mid cap stocks and that money was then invested in large cap tech stocks (FANG).
Both of these declines happened in a two-day period but there is a big difference between the percentage lost. If you add up all of the declines in each of the indices, we see total loss for June 10 to be 31.4%. This is much less than that of August 12, which declined only 17.6%.
What is most interesting is when we look at the weighted average of these declines. It is almost exactly inverse! Meaning that in June the Nasdaq decreased the least but in August it decreased the most. The same is true with the Russell decreasing the most in June but the least in August.
I believe that going forward we will see greater percentage gains in IWM compared to the other indices. However, all of this is speculative and subject to change. But if you follow the wave counts for the S&P 500 and Dow you know we need a significant push to complete wave 5. A further decline in these indices would invalidate the wave count and cause significant bearish momentum.
In conclusion, assuming that this recent move was due to rotation I am bullish SPY and IWM and neutral QQQ. We should still see gains in tech but not as much as small to mid cap stocks.
To confirm this analysis, I will assess the weekly gains of each index over the next several weeks. If we do not see an increase in small-mid cap stocks then money is leaving the markets and not being reinvested. This would be very bearish.

We may be at the end of the down move, but it still looks bearshlook at the Stochastics, extreme overbought sell still in effect. Let me find the chart in the right timeframe.
My shorrts are nearing the Camirilla Pivots weekly R$ my trading plan is not disionary, I must take profits soon i think.

Nasdaq about to drop???Just looking at the technicals not accounting for fed money this sucker looks ready to drop...
NDX - What Really Matters Personally I enjoy trading the NASDAQ more than the SPX or its derivatives.
The NQ will let shorts out - added volatility creates bigger ranges for swing trading.
What really matters is the NASDAQ is respecting Points of Control and Gaps more than the Spoos. The S & P still has three unfilled gaps from August the NDX has none!
Todays price action was nothing more than house keeping. Forget about valuations if your trader - none of that makes sense. Price action make sense - and that's exactly what we saw today.
We stopped right at the bottom of a gap created a couple weeks ago, and rallied hard from there - over 600 points. Stocks aren't crashing - we just got to the bottom of a channel quickly - posted below.
Whats next? Is that a gap overhead?
The caveat to all this is a news bomb - but right we just playing back and forth inside a channel.

NQ1! Nasdaq futures analysis (resistance & supp, Elliott) 02-09What we saw today is an expansion of what we saw on previous days:
-Strong up movement corrects fast when meets an important resistance, and then retakes to completely recover the correction.
From an Elliott perspective, today's movement is similar but from a higher degree than what we saw previously
Therefore I would consider this a wave 4 of something one degree higher of what we had been watching
After a wave 4 begins, it's very difficult to determine its end.
Therefore tomorrow's perspective is not clear at all, it's better to wait outside

NQ1! Nasdaq futures analysis (resistance & supp, Elliott) 01-09Today's movement is similar to yesterday's:
->Force up at the beginning
->Finds important resistance and retreats heavily (yesterday it was relatively slow, today relatively fast)
->It then retested and defeated the previous resistance (both time with speed)
->It ends market hours moving up again
Therefore the analysis is not very different from yesterday's:
->We could see important movement up tomorrow
However, from an Elliott perspective:
->The important retracements of 31-08 and 01-09 are different in nature (one slow, one fast)
->They could be showing waves 1, 2, 3 and 4 of a wave 3.
->Today's market hours up movement could be wave 5
->In that case we could see a wave 4, that could find important support and therefore behave like the one in 26/7-08
What are your thoughts?
Thanks for reading, thanks for commenting


NQ1! Nasdaq futures 28-08 (res & supp, Elliott)General:
movement is back, compare to 26-27 night and all 28
after failing to test a resistance, strong corrections happen but find near support
up movement seems to be accelerating
both 2 and 3 suggest nesting that could move to the upside tomorrow very fast.

Nasdaq Moved down till ...
Nasdaq Futures with lots of targets below got stopped dead - as the ES Futures hit yesterdays VPOC - this turned off the downward action.
In the 15 Minute Bar the NQ lost 84 points - the move down was just as quick up, you couldn't hit the buy button fast enough to buy back shorts.
NDX - Gap shown one of only two - unlike SPX which has four for the month of August. Lots of small and single prints that still need to be retested below at some point.

Nasdaq - Top of Channel Chart is drawn with Renko bars.
This is the fourth time price has moved outside the channel - only to fall roughly six percent.
Impressive ramp right before the Jackson Hole Meeting.
CME_MINI:NQ1!

NQ Batman Pattern Lives and Risks on the DownsideSince NQ started that awesome batman pattern back on July 20th, It has been swinging wildly up and down. But we find ourselves back at the top of the channel around 11,000 where anything can happen. So far NQ has burned up to tap a bit over 11,000 and correct immediately. We expect no different this time, but that doesnt mean it cant break out and fling itself higher. Maybe 11,350? That's where my top red line is at so that is pure speculation. However on the daily NQ looks like it is in a very gnarly ascending flag, bear style and ready to tear a new asshole into some FOMOing retail traders.
We should know quickly this week if NQ needs to burn down or it will make a break for the border above. Until then I would keep your trigger finger near the sell button and set up some alarms both ways. If it flies up, let it run and then take profits! If it decides to fling itself to earth like the Space X Dragon Shuttle, then drop that b*tch like a hot potato. You can always buy more, but it sucks being underwater. At this point in the game, NQ has met its match for the moment and unless it clearly and decisively breaks through, we can expect this puppy to leave orbit and take a one-way ticket back down to earth.
NQ short: SQQQ (use rarely, because shorting the NQ 99% of the time is like predicting you are going to be a millionaire tomorrow. Sure it might happen and maybe eventually it will happen. BUT LIKELY IT WON'T HAPPEN, so don't waste your time hoping).

SQQQ - This is where champions are madeSQQQ
- Currently sitting on the 1.618 (non-log) retracement from the last major swing low to high.
- RSI showing some macro divergences
- MACD as well
#NasdaqIsABubble

NDX to SPX ratio - tech wreck 2.0?Keep watch of this ratio-We're looking like 1999 based on this ratio. Tech to go hyper before tech wreck 2.0? The recipe is slightly different but it's starting to smell the same. Even if this plays out, we should see the NASDAQ cool off & consolidate for a bit..perhaps we'll see some weakness going to the Fall prior to election with increased volatility in the markets. I'm looking for some type of cycle trough in the markets in the next 2-3 months. While I seriously doubt it's going to be a lower low (than March low), it's not off the table. Cycle lows occur very quickly whereas cycle peaks roll & roll. March is a great example of just how quickly cycle troughs can occur. We witnessed the fastest & deepest drop in market history this year which proved to be a fantastic buying opportunity. Let's see what the markets offers next. Another correction in markets might be met with even more life-support from the Fed.

ARE YOU READY TO MAKE A LOT OF MONEY SHORTING BITCOIN?✅In this video, we talked about Bitcoin, SQQQ and SPX .
I see a great potential in this short trade.
My 3 reasons are
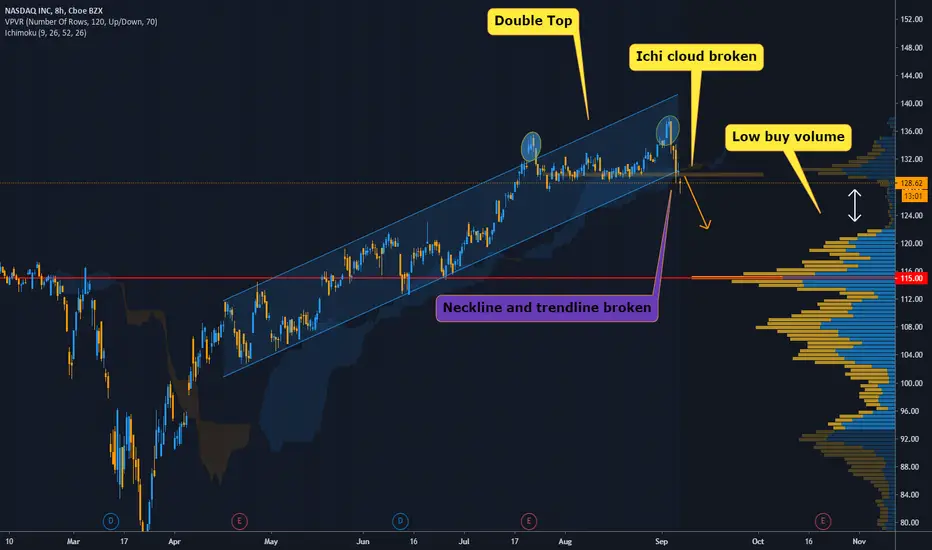
1) Double Top
2) TD9 Sell Signal
3) Megalodon Institutional Investor Strong Sell Signal
Take it easy.
~Bo Bugra Sukas
✌️

What no one wants to talk about American market is all over the place... one thing certain. COVID-19 Still here. Wall St. doing everything it can to hold up the markets.
At this rate, economy will have another March where stocks fell, even if only a 50% of last market fall.
SQQQ was at high mark around this point at around $30.00
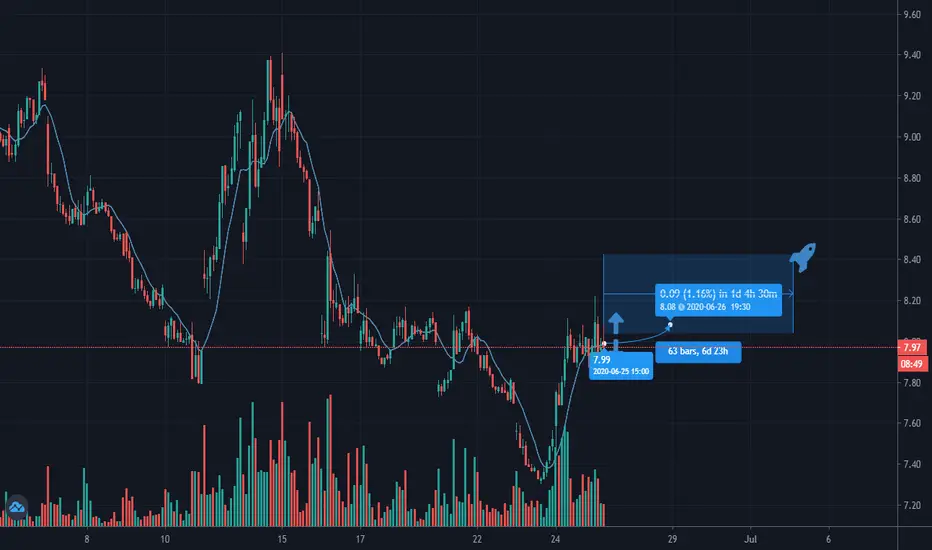
prediction based on chart and economy analysis that within the next 30 days we pass 8.09-8.20 into bullish zone this thing will fly.
I've been in @ 8.09 before drop as a little experiment, not worried. I will be in until I don't feel it will go any higher. (probably a 30-60 day hold here)
Where will your money be?
*As always, set your limits and stops traders
Good luck!