Square: Next Long & Short OpportunityHi traders!
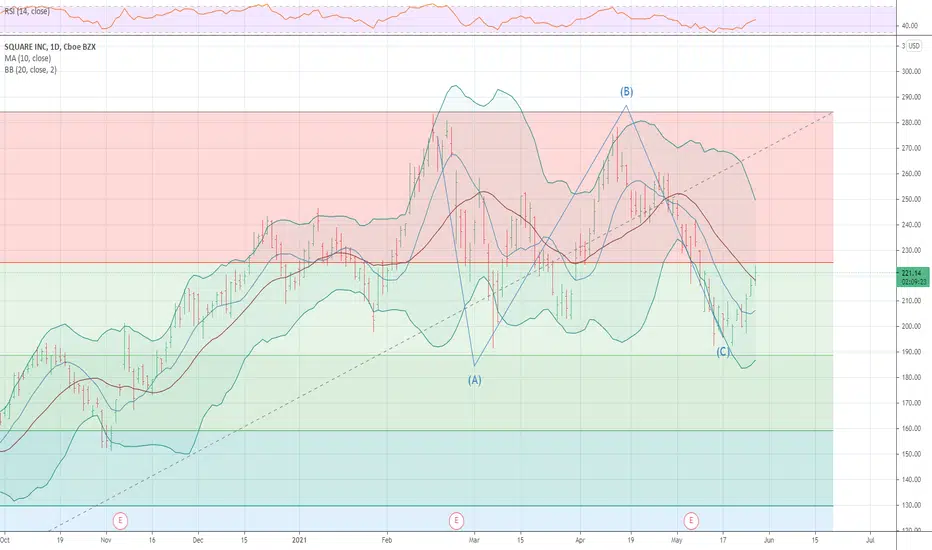
Square has completed a 5-ways impulse move up, and we have shorted it at the end of wave 5 to capture a potential breakdown in case the Nasdaq falls.
If that does not happen, we will take profit and invert the position into a long. The green box is our long entry (LE) where price may reverse with high probability, however the other fib levels are also possible. A move above the green "Bullish confirmation" line will confirm our bias and we can start adding to our position.
Levels
We find the strongest volume support at the .382 fib.
Averages
The 200 MA also heads towards the $220 area, a MA that has been respected well before.
Waves
Look for a completion of the ABC correction with a wave C that consists of 5 smaller subwaves.
Invalidation
If price keeps dropping without any sign of reversal, we let our short run and take profit towards the double bottom, or speculate on a total breakdown below the red line for the most bearish scenario.
Happy trading!
Square

Where is SQ going?Square started as payment gateway to accept credit cards for seller, now also provide reporting and analytics for seller. It also helped with payment hardware.
Since Dec 2020, its price has been moving in a range between $202 and $250. The price reached 52 weeks and all time high at $283.19 on 16 Feb 2021. It would be interesting to monitor the price level around $250-$252. The nearest support would be $220 or $190, depending on risk appetite.

Square bouncing from a Major Support ZoneToday, we will share our perspective on Square INC.
-The main thing we can notice is that the price has been ranging since December 2020. So, we will be working inside that range
-The Range is made by a solid support zone at 190 - 198. We have been observing several bounces from there, and in the current situation, it happened again.
-Another relevant item to notice is that the descending trendline has been broken, and we can see the price right at the edge of it.
-Based on that, we have defined a yellow horizontal line as an activation level for our bullish view. If the price reaches it, we expect a bullish movement towards the next resistance zone at 245
-The invalidation level for this view is below the current flag pattern.
Thanks for reading!

$SQ Trading Plan starting June 7, 2021reminders:
1. do not enter without the confirmation.
2. set your stop loss if entering with leverages
3. set your conservative TP
Disclaimer:
a negative catalyst can change a bullish trend
trade at your own risk


$GUSH further Fall Not A Factor: LONG (Elliot Wave)While $GUSH continues to actively fail its previous trade channel, this again represents a solid LONG to 91.
This could simply be a "completion of the square" w/in its previous 5-wave ascending channel.
It is hopefully just that: Profit Yield still hovers near 20-25% ROI on the position swapping (a long play on $GUSH).
BLOOD OR OIL

Older Bonfire chart shared to public. Here is the original chart.
I noticed the pivots and levels to be in sync with the price action so I decided to remove the testing indicators and share.
Always Bullish long term on BTC.
Short term = N
Midterm = Higher highs and lows needed

SQUARE SQ I am net long looking for min 242We have great support and a clear wave structure .In an A B C pullback min rally 242 and we pulled back to a perfect .382 on the lows
$SQ Making Bullish Moves$SQ has bounced off of the .618 fib level, which has provided a bounce in the past. The MACD has also crossed. Definitely risky though, we had a major double top pattern at $280. Good Luck!

Square - Going to Bikini Bottom ⬇-The stock market was having a generally negative day on Monday, with the S&P 500 down by about 0.5% at 2:30 p.m. EDT. However, fintech giant Square (NYSE:SQ) was a major underperformer, down by 5% on the day.
-The primary reason for the decline is that Square announced plans to offer $2 billion in senior notes (aka debt) in a private placement to institutional investors. Square plans to use the money for "general corporate purposes."
-It's not unusual for selling pressure to be seen when companies unexpectedly add debt to their balance sheets. And considering that the company had $3.7 billion in cash already at the end of the first quarter, this move might have investors scratching their heads. Including debt already on the books, Square will now have about $5 billion in long-term debt, more than five times its debt load at the start of 2020.
-With Bitcoin (CRYPTO:BTC) falling sharply over the weekend, companies that have cryptocurrency operations are under additional pressure. Not only does Square provide Bitcoin trading functionality through its Cash App, but it also owns about $360 million in Bitcoin itself. So it's fair to say that at least some of the pressure Square is under is being caused by these headwinds.


From 36 to 250 in a year, SQ is a gift that wont stop giving We just saw a clear double bottom, the pullback into the middle of the 'W' has already begun too, meaning not too long from now, we're gonna see a quick bulish run. The stock's at an ATH and apparently is still destined for more.
The OBV is also on a clear rise, another bullish sign
Like to spread the message, follow for more and tell me what you think! Ill definetely respond :)
_______________
For those new to TA, a double bottom is when a 'W' pattern is formed on the chart, its often followed by a pullback and a bullish run. When the 'W' is upright, its bullish and when its inverted, its bearish

SQUARE - 🚨Attention, it's getting dangerousHello everyone,
SQUARE is definitely one of the current hype stocks. Accordingly, the share price has developed well in the past. But everything moves in waves and Square will be no exception. There are some warning signals in the chart that suggest a strong correction. And it is precisely this expectation that I would like to use to determine a nice long-term entry.
Chart-technical assessment
- The momentum of the trend has clearly cooled down in the weekly chart and is slightly negative according to the MACD indicator. This is also reflected in the fact that no new high was formed in recent weeks.
- On the downside, a clear support zone can be identified in the chart (grey box).
- Within the supposed top there are two very exciting candlestick reversal formations.
1. evening doji star: A formation of three candles. This formation is not very common, but when it occurs after a strong rally, we should pay close attention to it. The formation represents a strong trend reversal signal with a good hit rate. The top of the Evening Doji-Star formation is considered strong resistance and is located at 283.19 points.
2nd Shooting-Star: A formation from one candle: The Shooting-Star is another trend reversal signal. Moreover, it additionally occurs in the range of the Evening Doji-Star.
Conclusion
- The chart gives many warning signals that the party at Square is over for the time being. Nevertheless, no decision has been made here yet.
- Should Square sustainably overcome the upper side of the current formation at 283 points, a further long movement should be the consequence.
- Should Square fall through the lower support, as I expect, I will use the marked zone in the chart as a buying opportunity. This is where many supports and the price target of a sell-off come together.
As always, it's "do your own research" - I am not an investment advisor and this analysis reflects only my personal opinion and is not a call to individual action!
If you want to support my work I'm happy about a Like & Follow 🙏
Best regards & success!
Chartdigger

Megaphone patternSometimes, it doesn't need much technical analysis to figure out the price action expectation, the low was predictable so will be the next top :)

SQ trending toward $300+I wouldn't sell SQ just yet. It looks primed for new highs with strong trend momentum.


Square Inc Tech AnalysisSquare Inc look very bullish and catching up the market after hard downtrend of March .
Indicators:
Obv
W%r
Average true range
Ema 20/50/100
We have positive deviation in Obv , W%r have more room for buyers to pushing up if we break and average true range ( Atr) of 13.6 .
Our supports level is 200$ on the bottom and ema 100/50/20 for the middle until now they act very good as well .
Our resistance level is 241$ , Weekly resistance top .
ema 20 is still below ema 50 , crossing above will trigger a uptrend and bigger chance to cross 241$ .
Our Two first Target if we se cross above 241$ :
T1 - 260$
T2 - 280$
Support :
S1 - 229$
S2 - 221$
S3 - 200$
Trade range time : Two weeks
* There is no buy / sell recommendation in the aforesaid ,


SQ looking set to fall tomorrowUsing both a schiff pitchfork and (more importantly) trend line, it seems SQ looks set to fall tomorrow to continue its “larger” wedge pattern formation

Head- Shoulder - Knees - & Toes - to $180?I'll be watching SQ closely on Monday pre-market and opening.
Long-term, I think Square is a great hold, but there could be a nice dip entry coming our way with the head and shoulders pattern becoming obvious.
There is news emerging that Square's cash app has been prone to hackers. There have only been 6 reported incidents according to Yahoo Finance, but if this gets a bit bigger and the stock dips this coming week, we will form a Head-and-Shoulder pattern.
As I said, long-term I am very bullish. With NFT's being linked to creative pieces of work, Square's acquisition of Tidal (HOVA!) is gradually starting to make sense. This is clearly a vision Jack Dorsey has -- just seeing that he is selling his first-ever tweet through NFTs. This is great long-term thesis, in my opinion of the company continuing to grow over the next 5-10 years. But, I am personally waiting for a re-entry at a better price. I expect it to come our way soon.
Good luck!

Anti-competitive allegation (boo) - $235+ target 2021 (yay)What a juicy entry into Visa.
I have worked closely with Visa, and these are some of the big points I think will work in their favour:
> Right where the stock was before the pandemic crash in March 2020. What?
> Olympic year -- Olympic years are good years for VISA as a TOP partner of the International Olympic Committee. Sure, we are a bit worried about how will the Olympics really look this year -- things seem a bit messy in Japan, but, if Japan can somehow get it together with the vaccines and protocol in time for the Games allowing some tourists in, this could be a good year with definitely stronger anticipated earnings for Sept/Oct earnings call.
> Travel and spend -- VISA's main revenue source isn't your domestic spend. Sure, the pandemic has perhaps even surprised VISA, as they reported positive earnings with online transactions and local spend -- but once those boarders open, the spend during international travel is where the bulk of the revenue will emerge from. I feel (and I could be wrong as who knows how safe management wants to play it) -- VISA will have fairly positive guidance during the May earnings report, which will be a big catalyst for the stock to jump and set all-time-high. If not then, I would still hold a position for 2021, because as things get better and people travel, they carry Visa in their pocket.
> Cryptos 'r' us + Dividend -- Few months ago VISA announced a Bitcoin based loyalty points program as a new product in select markets. VISA doesn't go "all in", but that's why I like VISA as a less risky yet growth-like stock. It can make strong moves upward, but, also keeps paying a tasty dividend.
I had de-risked by taking profits on VISA a few weeks ago. I did miss most of the rally we saw last week, but profit is profit and they still paid me the dividend. I have been looking for a re-entry when I felt the stock cools and a pattern becomes more obvious.
BUT WAIT...
While this dip is super tempting, I am not going all in just yet. VISA dropped so sharp on allegations of anticompetitive practices, as the department of justice investigates claims that VISA channeled transactions over their own (more expensive) networks for retailers, rather than giving them options to transfer through other networks (which is their legal right and possibly cheaper). What this means is that investors don't like the shock, and decided to take profits. What I will watch for is how the narrative develops over the coming week. If the market is generally recovering and the VISA news has no major follow up, great. If there is more news, we could even get down to $190s. I don't expect the stock to break that support.
Good luck traders!

$SQ 300$ Short term price target$SQ is the bull of all bulls. This innovative fintech company regained the prime trendline that held since the march bottom. With the economy reopening and small businesses reopening this stock is poised to surge. This is a great long term hold and a key part of my portfolio. Looking to hit new ATH within a short time frame.

SQ Stock 10/03/21 Analysis 4H ChartNYSE:SQ (SQUARE: SQ )
- Trend Analysis -
📑Value: 0/20
📈Growth: 20/20
💰Profitability: 10/20
🚀Momentum: 20/20
💸Earnings: 16/20
🖇️Total Score: 64/100
