USOIL 1H PerspectiveUSOIL showed a strong close last week and is seemingly looking for another positive close during the upcoming week. There are potential limit buy areas highlighted in the chart. The first area of interest being the weekly HLC3 @ 5773, the level from which the price bounced during the late Friday trading hours. Market participants seem to be waiting for a pullback to add on to their short risk exposure. Apparently, bears must first close and swap the bullish gap for bulls to panic and start vacating their holdings. A further push down of the market is likely to take place if bulls fail the gap area. As long as, the gap holds, short risk exposure will be the preferred alternative.
Squareof9

Bitcoin 1H Chart - Gann's Circle with Base-9! Never seen before.We taking gann to another level, this time lets not use a Gann Square, lets go radial lets go circular! Circle is divided in 9 segments of 40 degrees each, the smaller halfs are 20 degrees (easier to chart).
Hope you like the chart, seems to work pretty damn well for R/S lines.
Please Like and Follow for more! <3

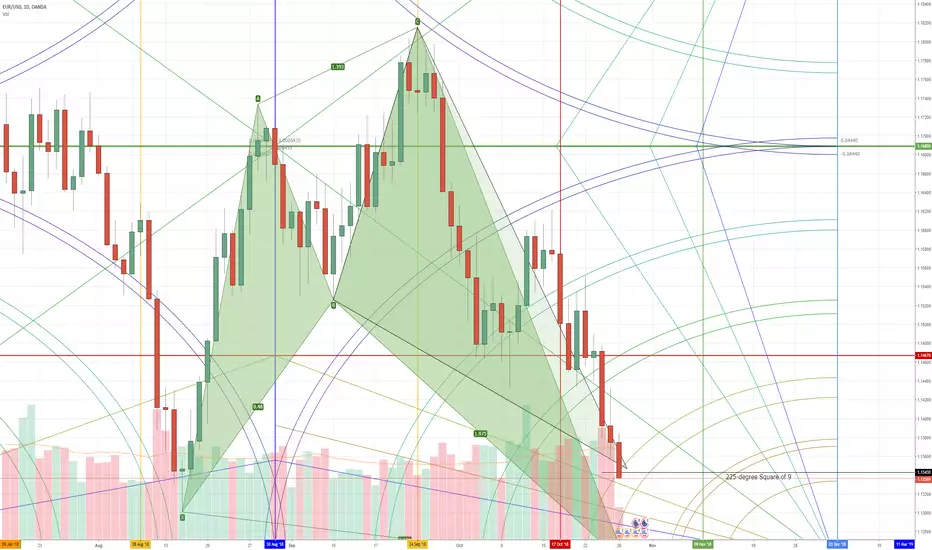
EURUSD long based on Gartley and GannMajor confluence zone of time and price
1. 225-degree Square of 9 value at 1.1343
2. Top range of a bullish shark harmonic pattern.
3. Intersection of key shared Gann 1x3 angle and 1x3 arc.
4. 30-day cycle, 30 day move down from recent swing high.
5. Probable double bottom found near, creating a 2018 double bottom – that’s if this entire structure holds and we don’t have a strong breakdown below the 2018 low of 1.13008.
6. Anomalous reaction to the square of price and time at the 1.1467 value area on October 17th, no responsive testing indicates a false move down.