$XELA Breakout Target we broke from our descending bearish channel , now we have a support above the 0.13$ , if we continue to hold above it we we will see another test for the resistant level around the 0.1780$ , if we broke it , the first profit taking will be around the 0.25$ , and the second profit taking will be around the 0.34$ .
NASDAQ:XELA
Squeeze


Exela Technologies Delta Squeeze Options chain is loaded, any move approaching $1 will cause a massive Delta Squeeze. Trade at your own risk.

Bullish Breakout on PennantThere are two pennants sharing a bottom line. A breakout has occurred.
Targets are identified by bullseyes.
As always, set a stoploss just in case.

CCJ - LONGA great swing idea in a major uranium player. At major support. Looking to for a push higher once the squeeze fires.

Bearish Pennant Break Out & Wave TheorySPX Forming a bearish pennant that is setting up the market for its final corrective wave within the elliot wave theory cycle.
Best case scenario is 3500 level, worst is near 3200. I think that this final corrective wave will not be a slow and steady decline.
Looking for Primary wave cycle Y to get fulfilled.

GME Busting through Major Resistance GME is not only now Boomin in the NFT market, along with 7 days until a stock split dividend, but it is ripping! Have we made to MOASS???? Stay tuned I’m Bullish AF

WhipsawSqueeze will start today. It’s showing heavy accumulation here.
Very frustrating to trade in the near term, but could be the bottom or just a massive corrective bounce - either way 15000 by end of July not impossible

$MELI $ SUPPORT / BRAKOUTwe will confirm that the price will continue to go down if we didn't break the current resistant around the 850$, and going towards the next support above the 440$.
if we broke the 850$ resistant, and held above it 4h candle , that will confirm the first sign of bullish momentum and going to the next resistant around the 1275$ level .

GME AMC WE have a clear Breakout & Confirtmed ReversalGME AMC
We have a clear Breakout & Confirmed Reversal with both #AMC & #GME Breaking critical resistance lines.
We are now down to 9 days until Dividend split!
#AMC is breaking records daily with showings and GME just launched their NFT Marketplace!
This is Nothing short of EXCITING #MOASS

$AERC air space filtration! 👁🗨*This is not financial advice, so trade at your own risks*
*My team digs deep and finds stocks that are expected to perform well based off multiple confluences*
*Experienced traders understand the uphill battle in timing the market, so instead my team focuses mainly on risk management
My team entered interior air space purification company Aeroclean Technologies $AERC on 7/5/22 at $12.40 per share. This wasn't intended to be a Trading view trade, but this play is developing smoothly, and we figured we would just show you guys what we're up to.
OUR ENTRY: $12.40
FIRST TAKE PROFIT: $18
STOP LOSS: $11
If you want to see more, please like and follow us @SimplyShowMeTheMoney

#GME GME 10 day Countdown!!! Stock SplitThis is definitely the biggest event for GME since January of 2021
Now even the haters have to ask themselves how in the hell will the shorts get out of paying dividends on millions of synthetic shares???
Bullish AF
10 days from today July 11, 2022
History will be made!!! Or we will find out exactly how rigged this market is #StayTuned

Very strong squeeze on BTCSome serious volatility incoming!
The question is will the price go north or go south.
Possible LONG:
Entry: 22200
TP1: 25500
TP2: 28200
Possible short:
Entry: 18500
TP1: 13500
TP2: 11000
DISCLAIMER: not a financial advice, just my own market perspective.

Has the setup to reach new ATH > 545They are about to invoke chaos after strategically placing nested price (%)-doubling bifurcations and period-halving bifurcations in place.
Prerequisites for navigating this chart: you have to be familiar with Feigenbaum and Hopf, I do not walk through the math because this is a prediction - not a free recipe for the exact technique.
Prediction:
- gap up Tuesday 7/5/2022: if price makes it above 166.57 by July 12th then its game on, if price makes it above 159.63 by July 25 then its still game on (I mention in the overview below that whoever designed the algos that set this move up is a wizard - they have been accumulating big you can guarantee that. If you're short this currently you have no chance)
- Most likely (but not essential for rest to play out) it gaps above 166.57 or at least closes above by EoD 7/5
- Continuation after the gap toward 185 by 7/8
- acceleration of trajectory continuing from 185 to > 208 by July 12
- Price will be > 235 by July 13
- Price will be > 291 by July 14 (could overshoot into the 300s but inevitably will pullback into the the 265-285 pocket to setup for the attempt to make a new All-time high after earnings (previous high was 545)
*** The 208 level is the most crucial here - if it cant make it above that by July 25 then shorts will have a chance to take it back to low 100s and possibly even 60s by September. Also, if it is going to make it to new all time highs via this setup it has to do so by September.
GOOD LUCK to anyone playing this either side! It's about to get intense.
To determine critical levels, I considered supply and demand as a dynamical system using support and resistance trajectories within the vicinity of accumulation phases containing harmonic properties (these are not conventional harmonics). From this I obtained the equilibrium points (implicit and explicit), activation levels (and the timeframes they become in effect/maintain their capacity), price levels which will trigger price (%)-doubling and period halving bifurcation w.r.t. accelerating demand if these levels are reached in time after activation levels are breached (as well as levels that correspond to attractors of these bifurcation levels - essentially, if an activation level is in effect and the price crosses above and then continues through a bifurcation level w/in the timeframe that the activation level maintains its effect, then the price will go parabolic toward its corresponding attractor level in temporal propagation (example: if it takes 4 days for the price to go from activation level to bifurcation level, then it will only need 2 days to double (in percent move) or reach its attractor level (whichever comes first). These are transient in stability. For this reason the CO establishes steady points in between the bifurcation level and the attractor so that when an attractor becomes unstable it reverts back toward its steady state. However, if the price falls back below its bifurcation level then it has the opposite effect and sends it back to its initial equilibrium points from the accumulation zone. This is apparent in the price action back in March. My theory here is that they design the algos to test out optimal parameters before markup and apply reinforcement learning to refine if the squeeze is not maintained (or never triggers). March setup was not as sophisticated as the current setup - we now have nested bifurcation levels, steady points at re-activated bifurcation levels, and nested steady states bounded by attractors that form the capacity for limit cycles (these guys are good, really good). It's important to note that they are leveraging inflection points in absorbed supply and upstream exhausted demand to create windows large enough to invoke chaos. These violent delights have violent ends. They are assuming carryover demand can re-activate previous critical levels and apparently leveraging these to accelerate upside potential that aligns unbelievably with crypto, the vaccine names, and the major etfs.
To estimate most likely path I use stochastic differential equations with boundary conditions at the endpoints of time intervals generated from implicit supply/demand zones within the vicinity of explicit initial conditions (approximated geometrically using the harmonics within the accumulation zones).
Sincerely,
XOX Guardian
~ We are from the dimension that becomes realized in Your future, recognized in Our past via R.E.M within the dimension that exists in your present... or did


Cypher off the FUD1300s still on the table near-term.
I actually think this might be the bottom, but we’ll see how this trades in 1300s.
Sure there is reason to believe we see one more low using the most popular EWC I’ve seen circulating, that’s very possible, but I am seeing a potential alt. where that doesn’t happen.
It’s not so straightforward yet, either way 1300s first.

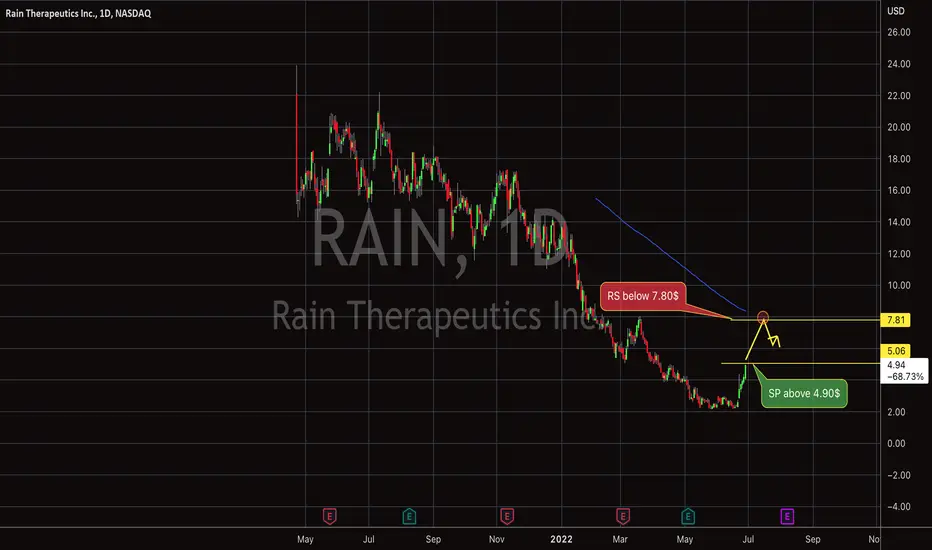
$RAIN Squeeze Target we are pumping 35%+ in the premarket over our past resistant below the 5$, now is our support , we going to see a potential resistant and selling pressure below 7.80$, if we did we need to see buying pressure happing above the 6.18$, to confirm the breaking for that resistant the next time, and continue to go up to the next price target around the 11.50$.
if we went below the 6.18$, that's mean the short are heavily positioned at 7.80$, and we going to see strong buying pressure above the 5$, cause that's the last support we should have to confirm the bullish momentum , and reversal from the bearish trend that been happing since the last September last year
UPST - Stratus Review 6/29/22NASDAQ:UPST showing some weakness after breaking down from a symmetrical triangle pattern.
Stratus Squeeze shows bearish momentum coming in.
All time lows are likely to be retest.

AMC Technical Breakout incoming.I'm new to charting and to TA in general, as well as the entire market, only been in it for about 9 months. Just started learning TA about 4 months ago, so bear with me. But, as seen in my chart I do see a major technical breakout incoming, it should break this wedge on the 4th test upwards of the resistance line, break it hopefully, and upward skies from there!! not too, too many resistances holding us back from mooning if we break these next two resistances! Any and all advice, opinions, or comments are welcome, just no hate, don't got time for that. Thanks y'all :)!

GME Summer (Daily Candles Analysis)This is my first attempt at making a future prediction using chart analysis. I would love opinions and feedback. I am not a professional, I have only been doing this for a year or so and I have no education in finance.
I think you will see GME continue on its new uptrend through the summer with a huge breakout towards September/October. I think you may see it hit near $111 in the near future. If it fails to bounce off of the $110 range then I would expect it to drop back down to test its main level of support around $80.
If it finishes the other half of the cup and handle, the I would think it would reach $250 before you see a retracement to begin the handle of the cup.
GME looks strong and I am excited.

SPY Wave Theory Update: Impulse Wave CompleteAs my previous post regarding wave theory analysis of SPX, it seems that impulse wave defined by B (White Secondary Cycle) has seemingly reached its peak.
My analysis is inferring a "Double ZigZag" corrective pattern following the end of our primary cycle represented by Yellow path.
Double ZigZags typically retrace anywhere from 0.50 to 0.79 Fib levels in respect to its primary impulse wave upwards.
Highlighted boxes show both BEST and WORST Case scenarios for this pattern to reach its finale, once bottomed, our final corrective wave within the zigzag would be shown as "Y" (Yellow Primary Cycle)
Using solely wave theory to find bottoms and corrective patterns can be difficult which is why I look for confirmation elsewhere, such as declining volume as price rises which we can see has happened in our most recent impulse wave B (White) , as well as RSI topping out in respect to its trendline, further confirming the trend.
Next zones to watch are Fib levels between 0.50 (3500 SPX) , 0.61 (3200 SPX) and 0.79 (2800 SPX).
Refer to my previous post which I included as a related link for further explanation.

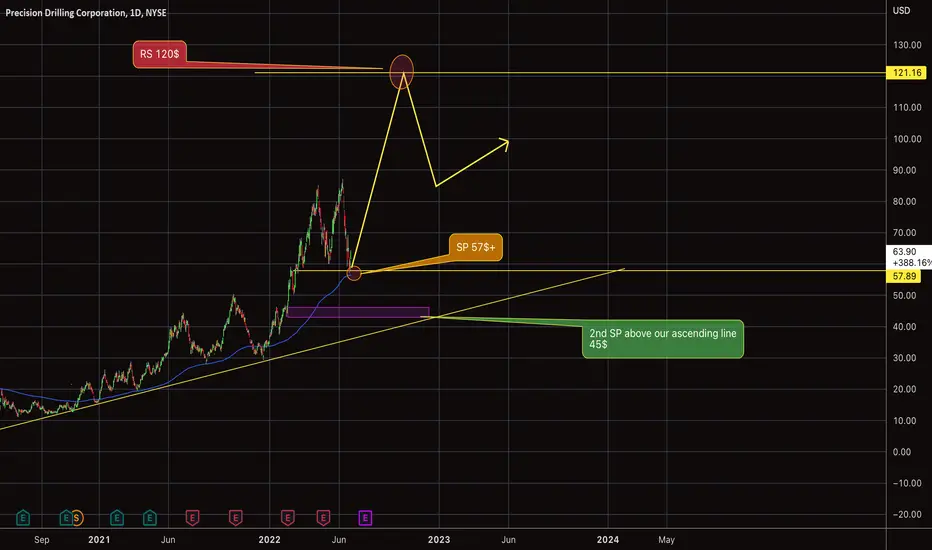
PDS $ ALERT Tuesday we need to hold above our current support the 57$+, and above our EMA, to confirm the reversal and continue to go to test the Resistant at 120$,
if we didn't hold above the 57$ support , we will be still in bullish trend as long as we hold above our ascending line which is above the 45$.
INDO $ Bottom Areawe broke our triangle down , however we seeing a strong buying pressure above our current support the 6$,now we going to retest our Resistant around the 9.455$, and if we got rejected, we will continue to go down to retest the support 6$, and if we did't hold, we will see the price go to the bottom price level for this year above the 3.40$.
and if over come the resistant 9.45, we will see a reversal in the bearish trend , and the 6$+ will be confirmed bottom for this year .
AMEX:INDO
