Bitcoin watching for short squeezeThis is just idea but i watch for something like this, short squeeze to 48k, then retail will go fomo long and the big players will push the market down to take their liqs. Not sure but funding is still negative and most of peoples are bearish and wait 34-36k.
Squeeze

Bullish Squeeze for TTETTE has retraced to one of its Fibonacci supports and have bounced off of it pretty significantly. Not only is it holding support, but there is greater indication of a greater bullish move. The %R indicates that a oversold condition was not too long ago with the addition of selling momentum reducing greatly, given by the Squeeze indicator. My price targets are 47, 50 then 57 if it gains a substantial amount of bullish momentum. For a significant sell signal, let the squeeze play out until there is a reduction in momentum.
Bullish Signals
-%R oscillator
-Squeeze indicator
-Fibonacci Support
Price Targets
-1st 47
-2nd 50
-3rd 57

BTCUSD - Squeeze but can it really go 9 days?Latest Note:
So we are entering another squeeze here with a slightly bullish signal. This is a pretty unfathomable run at 8 straight days green. I can't see this continuing the streak however it could cool off and wait a whole day going slightly red in a squeeze before taking off again. Watch and hold here. 38.5 is about the possible breakdown area. 40.8 is around the Uptrend area.
Previous Replay Notes:
1) This has been on an insane ride up after 2 Uptrend signals. Profits would have been at 20% here so a good place to exit but also would have been difficult to refrain from entering when you see the next pump and drop.
2) The hold squeeze was very short lived and bulls regained quickly after just 1 bounce. I didn't catch it till the 2nd bounce, but didn't matter as I was still long in a hold pattern. If you exited at comment 1, the squeeze would have been a good place to get back in.
3) The Uptrend was also short lived. There was still plenty of money to grab in the short stint, especially if grabbed back in at the last squeeze.

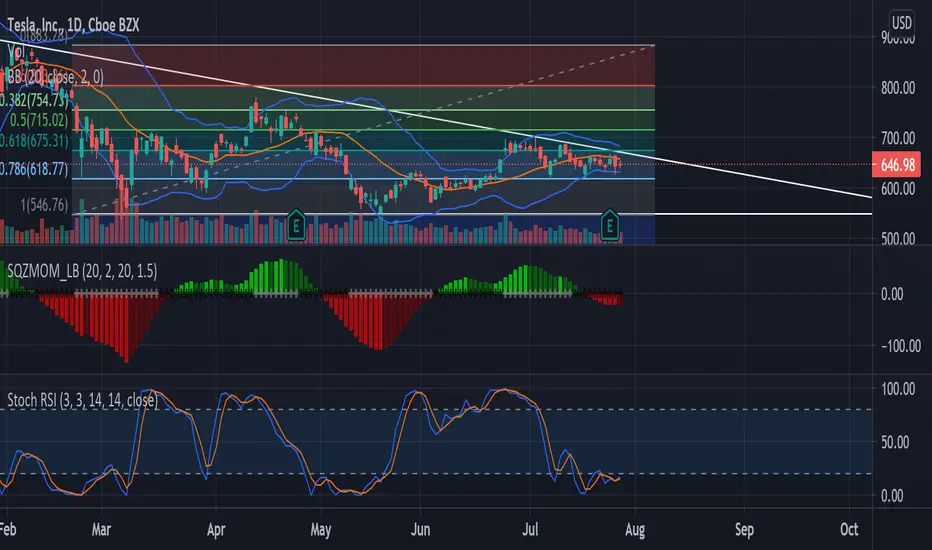
TSLA Primed for a Bullish BreakoutAs you can see TSLA is forming a descending triangle which normally suggest bearishness, but both the daily and weekly suggest a squeeze to the upside. If Stoch Oscillator rose upward as we got closer to the breakout resistance than that would help indicate bullishness. I will list price targets below. I recommend watching this stock till an oversold oscillator starts to gradually increase to provide greater confirmation to a breakout.
Bullish Signals
-Squeeze Indicator
Price Targets
-672, 714, 752, 806, 886
Support
-622
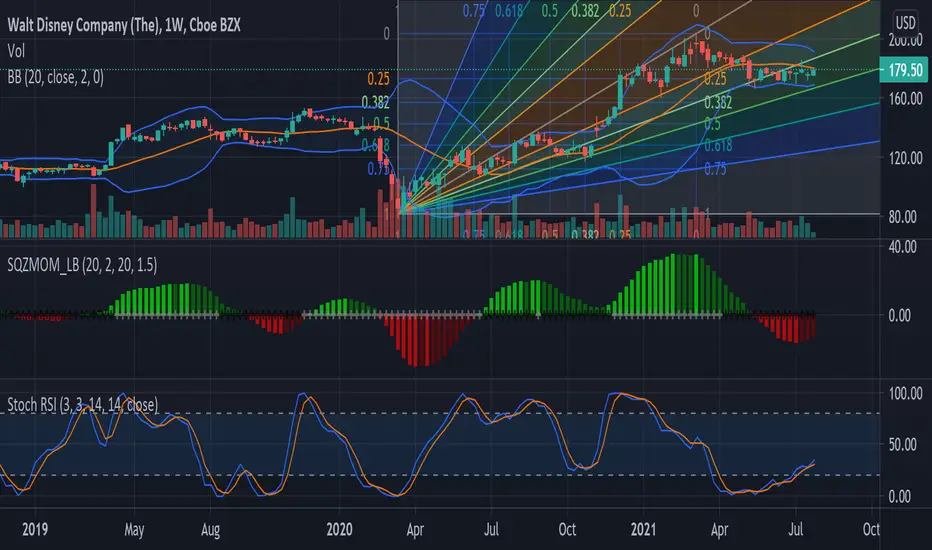
Disney Setting up for something large Disney is to be slowly increasing regarding its Stoch Oscillator, indicating gradual bullishness. Not only is the Stoch indicating bullishness, but the squeeze indicator shows decreasing bearish momentum. My Price Targets are 190 and 200 if we get the squeeze that is to be expected.
Bullish Signals
-Stoch Oscillator
-Squeeze Indicator
Price Targets
-1st 190
-2nd 200
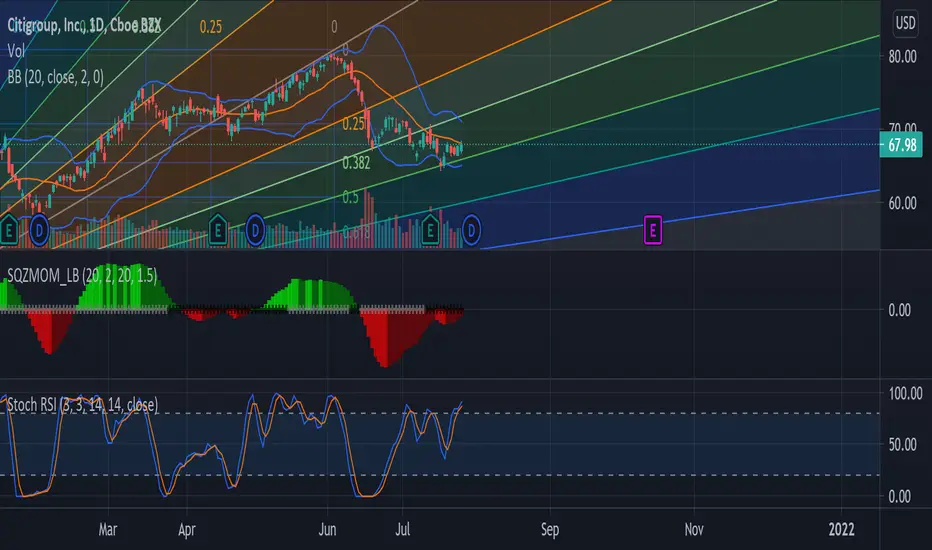
Great Entry for Citigroup Great Up-move to be expected. A squeeze is about to occur on the daily while also holding its support. Another indication towards bullish sentiment is the Stochs Bullish Divergence. Not only does the daily suggest an up-move, but the weekly indicates an oversold condition. Price targets are 73 then 80.
Bullish Signals
-Squeeze
-Stoch Divergence
-Fib Support
-Weekly oversold
Price Targets
-1st 73
-2nd 80
Great Bullish Setup on NFLXNetflix slowing showing signs of bouncing off of the the lower Bollinger Band while also displaying bullishness via the Stoch indicator. Price target is Fibonacci resistance which is 547.
Bullish Signals
-Bollinger Bands
-Stoch Oscillator
-weekly signals a potential bullish squeeze
Price Target
-547

GME - The Black and The White
GME - the story is clear.
Long-term chart/trend/indicators bullish.
Company fundamentals solid.
Company leadership top tier.
The January squeeze halted...
Shorts didn't cover.
Nobody sold.
Next uptrend is here.
TICK TOCK!
Not financial advice.

$MIRM doubling down*This is not financial advice, so trade at your own risks*
*My team digs deep and finds stocks that are expected to perform well based off multiple confluences*
*Experienced traders understand the uphill battle in timing the market, so instead my team focuses mainly on risk management*
Recap: My team entered $MIRM on 5/28/21 at $16.30 per share.
Today we're taking the dip opportunity and doubling down at $15.60 per share.
FIRST ENTRY: $16.30
2ND ENTRY: $15.60
TAKE PROFIT 1: $20
TAKE PROFIT 2: $30
STOP LOSS: $14.90
If you want to see more, please like and follow us @SimplyShowMeTheMoney

$LODE rise of the silver surfer*My team digs deep and finds stocks that are expected to perform well based off multiple confluences*
*Experienced traders understand the uphill battle in timing the market, so instead my team focuses mainly on risk management*
Recap: My team has been analyzing $LODE for the past couple months. We're long on silver this summer due to the US dollar continuing to weaken. We opened a long position in $LODE on 7/6/21 at $3.36 per share.
Today my team is increasing our $LODE positions at $3.12 per share.
Our first take profit remains $6.50.
FIRST ENTRY: $3.36
2ND ENTRY: $3.12
TAKE PROFIT: $6.50
STOP LOSS: $2.60
If you want to see more, please like and follow us @SimplyShowMeTheMoney

AMC THE BIG SHORTShort the bounces! We have multiple sell signals at the top and now we have a classic bounce formation, strong drop probable.

EXPR - Think Big!It is looking like the trend up on EXPR continues. The cycles are aliening and indicators are very bullish but not over-extended on the daily.
EXPR still has plenty of room to run to the upside.
Based on the trend up that started in late 2020 expecting more BIG things from EXPR soon. See chart.
Not financial advice.

$SQBG Squeeze300 shares left to short according to Fintel. Can it squeeze past $30 again? I’ll be buying some Monday Insanely low float too

Ethereum looks goodLooks like Ethereum is trying to form double bottom. I long it with small size and small leverage. (no advice)

AMC settled at $37 as predictedThe trading volume was cut in half today and the steam is out. Even though the Call Put Ratio dropped to 0.66 today, which means for every CALL Option out there are 0.66 PUT Options out there. But we also see that 90% of the trades today were all within a one week horizon.
Gamblers. Just put your money there and leave the table.
The bank takes it all.
There are about 168,000 Put options to expire this Friday and about 262,000 Call option. I also will say that when a Call option goes one Dollar into the money, there will be no profit for the option holder. Very little if at all.
The huge Call option Barrier is at $40. about 35,000 contracts the Market Maker do not want to pay out and hence they will try to keep the price below that. Remember the Market maker also makes money when your calls actually go into the money. They have their positions covered, they bought the stock, the underlaying. When the call goes up and get sold back to the MM, the MM sells the shares for a higher price. He makes money on commissions and wins on the slippage. If the option expires worthless he gets the commission, no slippage but holds the stock. When you start buying Calls on Monday the Market maker already has the stock at hand
There are also about 22,000 Put option sitting at the $40 level. All of them will expire and since the Call options numbers are bigger it is less risky for the Market Maker to stay below $40. And even at 38 or 39 Dollar closing price tomorrow there is nothing lost with the Put options that are one Dollar in the money!
Thus my prediction is the price will stay at the $39 level and might slide to 38 by the end of the trading day.
And all of this depends if the apes can get their money together and chip it all in to run the price up so that their other bros can profit from it. But in the market everybody is your enemy. Dont wait for help. And today, after two strong trading days on Tuesday and Wednesday, the trading volume dropped by 50%. This is an indicator to me that the Market Maker are ready for the battle and have an excessive amount of shares. They didnt have to load up today. Their guns are full of powder. They will haven even more on Monday, which they will sell to the market and drop the price slowly.
The biggest mistake the Ape Army is doing betting on short terms. To the Moon, Bro!! All on board. if you follow the Option exchange then you would know that all those bets are gambler bets. Short term. They go off in smoke in a week.
Next week so far, there will be about 10,000 call option sitting at the $40 level and about the same amount at the $50 level. Thats it. Very little.
And there are 6,500 Puts sitting at the $20 Level, which might be insurance, married Puts. They have a 2 months expiration left.
Lets see Monday and lets see how it works out tomorrow.
Unfortunately I cannot attach any images. Though, that means do your own research.

Big short squeeze reminiscent of 2019 mini bull run incomingLong BTC - will reach $37,000 within 1 week.
Short squeeze incoming.
Record number of bottom shorters
= price will rise exponentially like in 2019 mini bull run.

$OSAT accumulating for the next XABCDAbout:
• A publicly-traded company headquartered in Miami, Florida, Orbsat provides solutions to fulfil the growing global demand for satellite-enabled voice, data, tracking and IoT connectivity services. There is huge demand and commercial potential for cost effective satellite systems providing voice solutions and high-speed internet across the globe, and Orbsat is already playing a leading role in delivering it to end users.
• Orbsat was included in Deloitte’s 2018 Technology Fast 500™, a ranking of the 500 fastest growing technology, media, telecommunications, life sciences and energy tech companies in North America, placing it amongst just 3% of companies recognized in the communications sector.
Technical Analysis:
Price Entry
$5.5 - 6.25 - Buy 100%
Price Exit
$9.65 Sell 30% THIS IS SAFE as most bought VPVR volume at this level)
$15 Sell 30%
$16.50 Sell 20%
$20 Sell 20%
Fib trend line support
Fib trend sight line,
FOMO kicks in when candle touch this line
1st XABCD =
03 June
10 June
25 June
07 Jul
08 Jul
2nd XACBD=
08 Jul
13 Jul
19 Jul
24 Jul invalidated if momentum squueze fails
08 Aug
Fundamentals:
• Investors are responding positively to Orbsat announcing that its Global Telesat Communications (GTC) unit has entered into an agreement with Alibaba.com. GTC is going to be a Gold- Supplier on Alibaba.com, the world’s largest Business-to-Business (B2B) e-commerce website.
• GTC happens to be the most trusted seller among all the gold suppliers on Alibaba.com, and it seems to be making some crucial moves lately. It seeks to expand its 24/7/365 e-commerce presence as much as possible, and it considers the unveiling of its latest global storefront to be a step in the right direction in achieving its objective.
• Orbsat is expecting to launch its new storefront during the third quarter with an extensive range of satellite IoT and connectivity products. And these will include Orbsat’s specialized satellite tracking products — some of which operate using the company’s many ground station-based network processors and can be used to track and monitor the location of cars, trucks, trailers, boats, containers, animals, and other remote assets.
• Orbsat’s full catalog of over 500 products and connectivity services should be available on Alibaba.com by the start of the first quarter of 2022.


Perfect bull flag formationVery nice bull flag formation. Rebond respects support level on Fib retracement. MACD and RSI in a reversal formation as well. Next level that we want to see is around the 45-60$ if we break 42$. Buy and hold, we can't lose if we don't sell, we own the float, the price is ours.

$WISH July Update*This is not financial advice, so trade at your own risks*
*My team digs deep and finds stocks that are expected to perform well based off multiple confluences*
*Experienced traders understand the uphill battle in timing the market, so instead my team focuses mainly on risk management*
Recap: My team entered $WISH on 6/15/21 at $11.30 per share.
Today my team is averaging up on $WISH at $11.77 per share. Our first take profit remains at $18.
My team is keeping any upcoming posts short and sweet due to upcoming market volatility within the next few weeks. My team busted ass to prepare for the summer markets of 2021.
Kick off is here...our players are in position...
We're just simply showing you the money.
FIRST ENTRY: $11.30
2ND ENTRY: $11.77
TAKE PROFIT: $18
STOP LOSS: $9.50
If you want to see more, please like and follow us @SimplyShowMeTheMoney

Bullish- Symmetrical TriangleWill be watching ATVI closely here as it's forming a large symmetrical triangle on its yearly chart. Buyer volume is starting to pick up again & Bollinger Bands are starting to squeeze. Closed on Friday almost right on top of its 200day SMA. Will be looking for a breakout of this triangle in the coming weeks- (*Broader market conditions permitting*)

SGOC Bullish Chart PatternLooking for price to squeeze to the ~ $36 area from the current bullish flag pattern its currently in. Great R/R setup.
Just a reminder that I'm not a financial advisor and my trade ideas should only be used for entertainment purposes and tried on paper trading accounts only.

GME - Adding on weaknessNice discount on GME today.
Adding shares.
See chart for details.
Not financial advice.
